一、服务端Prometheus二进制安装
https://prometheus.io/
下载过慢可使用迅雷下载
tar -zxvf prometheus-2.53.0.linux-amd64.tar.gz
启动
./prometheus --config.file=prometheus.yml
将其配置为系统服务:
vim /usr/lib/systemd/system/prometheus.service
[Unit]
Description=https://prometheus.io

[Service]
Restart=on-failure
ExecStart=/prometheus/prometheus-2.53.0/prometheus --config.file=/prometheus/prometheus-2.53.0/prometheus.yml --storage.tsdb.path=/prometheus/data --storage.tsdb.retention.time=60d --web.enable-lifecycle
[Install]
WantedBy=multi-user.target
web.enable-lifecycle是让prometheus热重启,开启以后请求reload
curl -XPOST http://ip:9090/-/reload或者浏览器直接请求
启动Prometheus:
systemctl start prometheus
查看Prometheus状态:
systemctl status prometheus
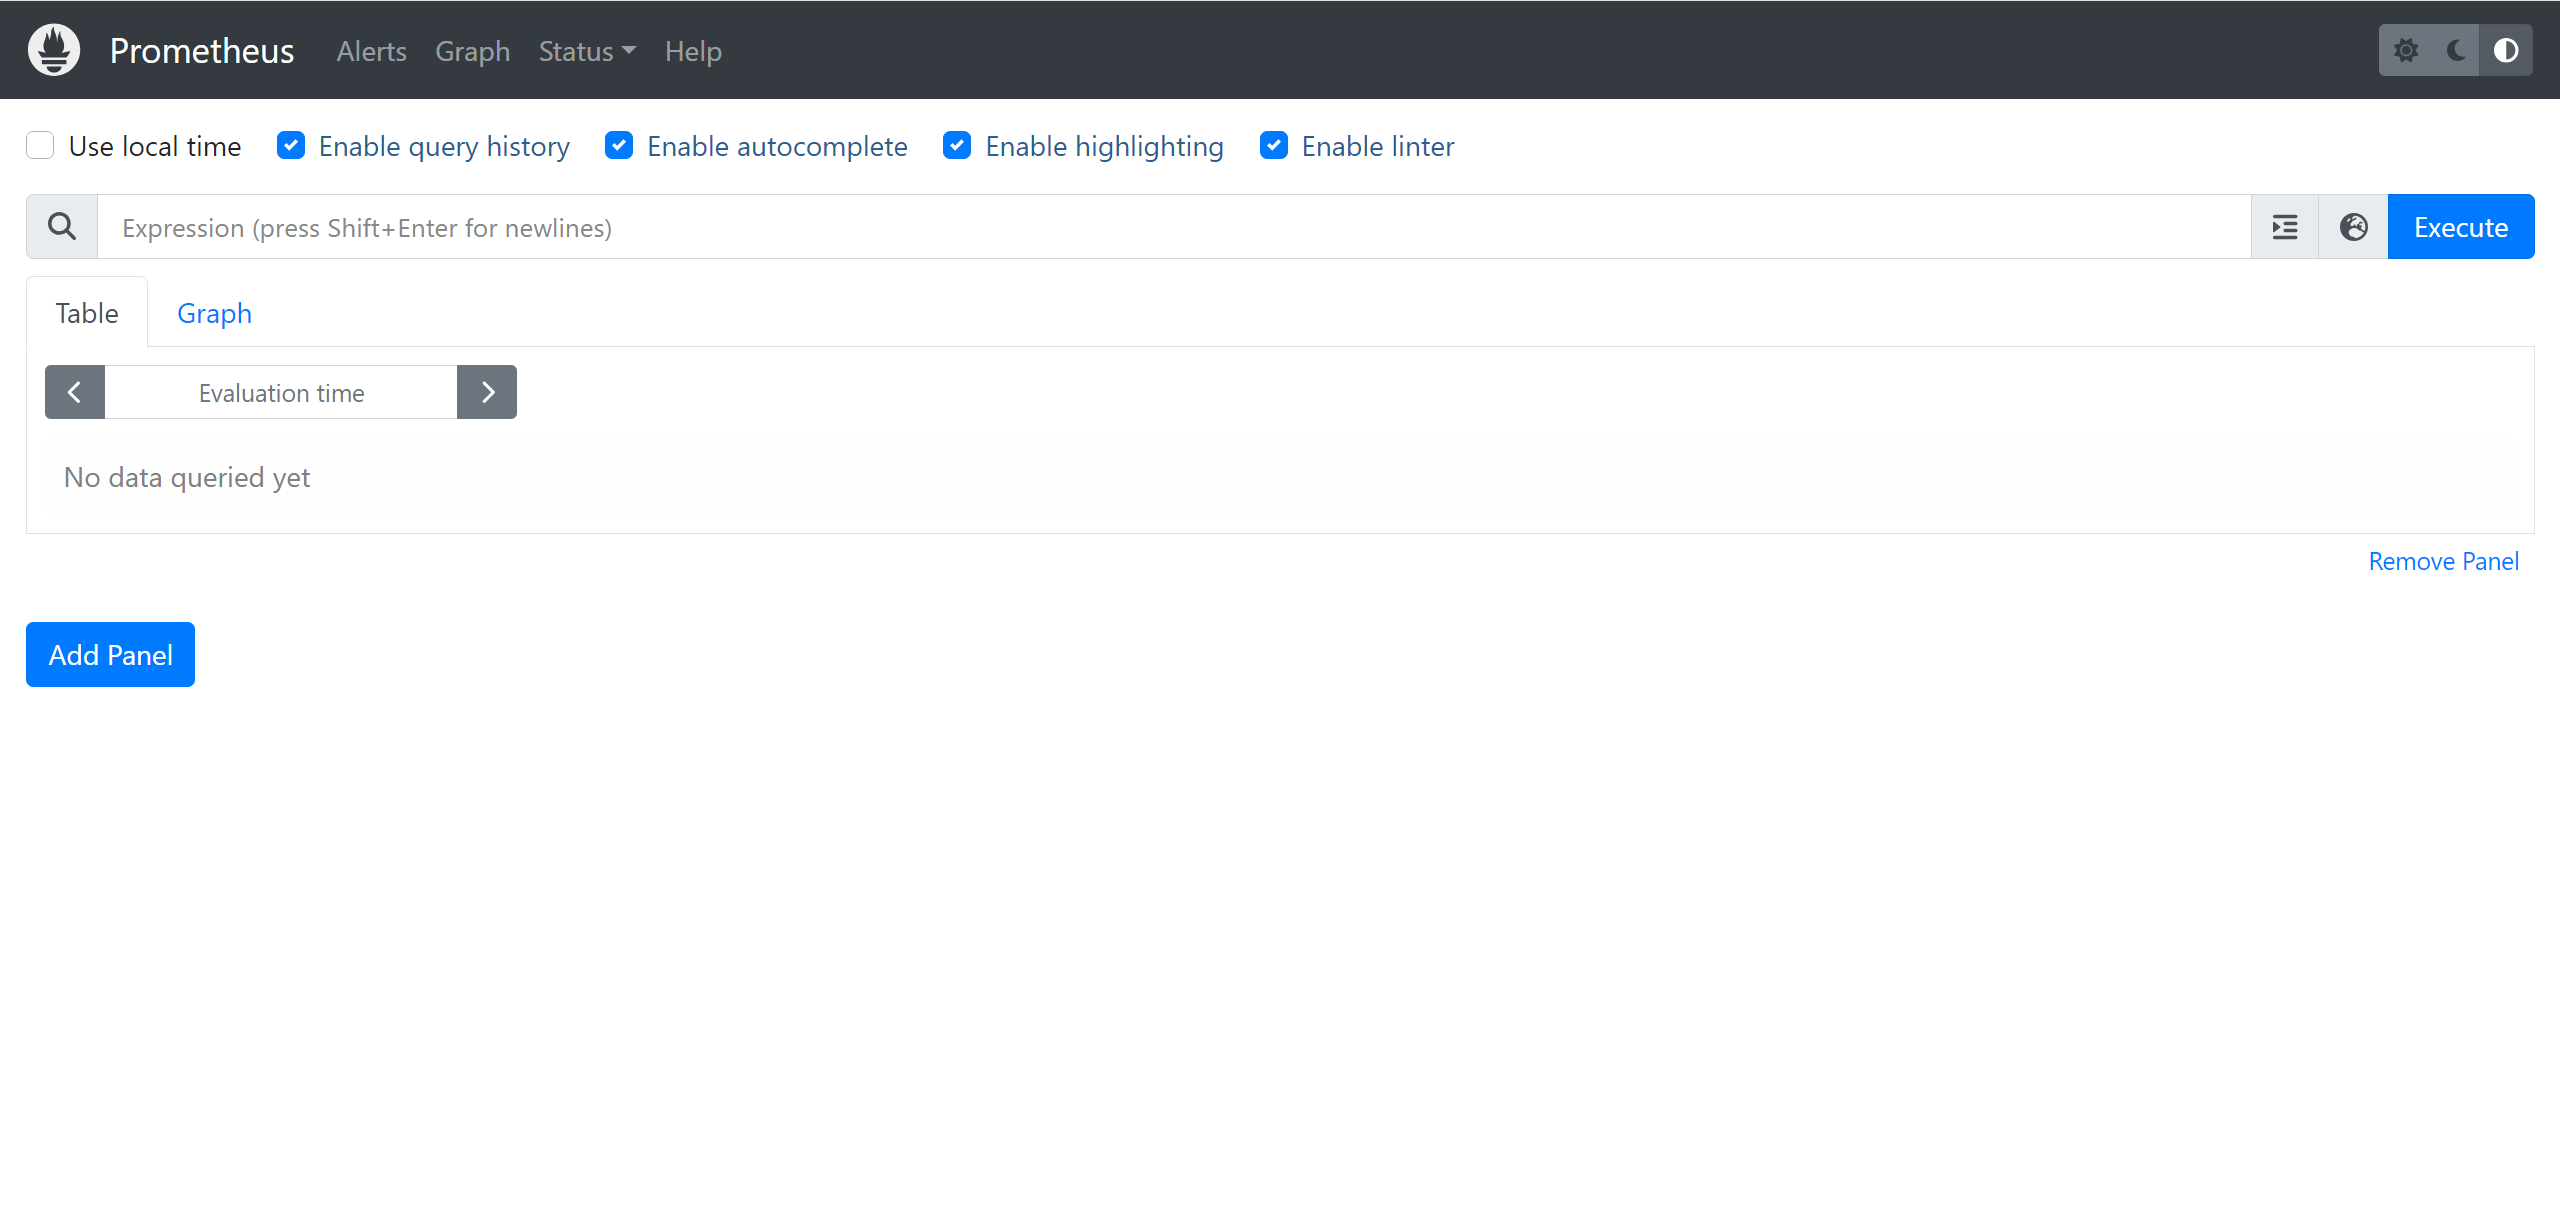
访问地址:http://127.0.0.1:9090
二、Grafana安装
https://grafana.com/grafana/download
tar -zxvf grafana-enterprise-11.1.0.linux-amd64.tar.gz
将其配置为系统服务:
vim /usr/lib/systemd/system/grafana.service
[Unit]
Description=https://docs.grafana.org

[Service]
Restart=on-failure
ExecStart=/prometheus/grafana/bin/grafana-server --config=/prometheus/grafana/conf/defaults.ini --homepath=/prometheus/grafana/
[Install]
WantedBy=multi-user.target
修改defaults.ini:
default_language = zh-Hans
启动grafana:
systemctl start grafana
查看grafana状态:
systemctl status grafana
访问地址:http://127.0.0.1:3000 默认账号密码都是admin
三、客户端node_exporter安装
https://prometheus.io/download/
tar -zxvf attachment\;\ filename\=node_exporter-1.8.1.linux-amd64.tar.gz
将其配置为系统服务:
vim /usr/lib/systemd/system/node_exporter.service
[Unit]
Description=node_exporter
Documentation=https://prometheus.io
[Service]
Restart=on-failure
ExecStart=/prometheus/node_exporter/node_exporter
[Install]
WantedBy=multi-user.target
启动node_exporter:
systemctl start node_exporter
查看node_exporter状态:
systemctl status node_exporter
访问地址:http://127.0.0.1:9100/metrics
四、将node_exporter加到Prometheus中
修改prometheus.yml,在scrape_configs下添加
  - job_name: "node_exporter"
    static_configs:
      - targets: ["192.168.0.1:9100","192.168.0.2:9100"]
# targets处可添加多个节点
重新加载配置文件
curl -XPOST http://127.0.0.1:9090/-/reload
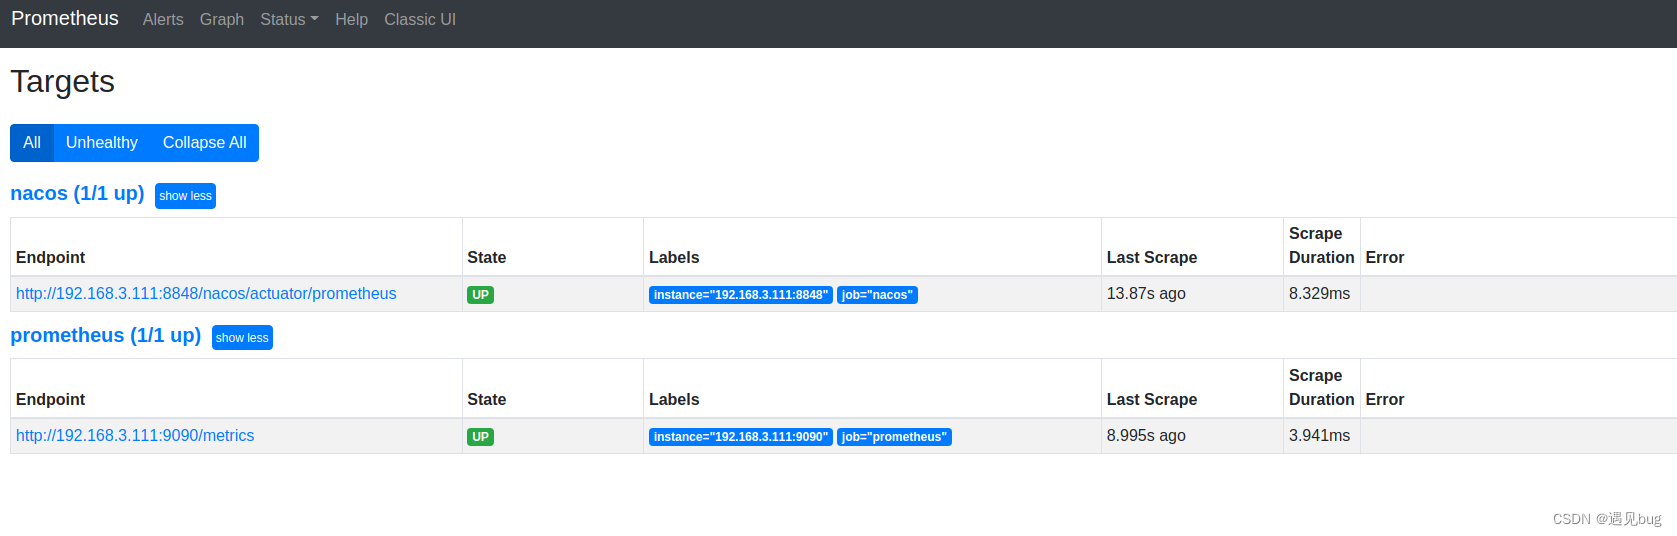
之后在Prometheus的status下的targets下可以看到node_exporter
五、Grafana添加仪表盘
1.添加prometheus
连接-》数据源-》添加新数据源-》选择prometheus-》在connection处添加prometheus地址-》save & test
2.添加仪表板
仪表板-》新建仪表板-》导入仪表板-》在https://grafana.com/grafana/dashboards选择仪表板并copy id to clipboard-》在导入仪表板的界面粘贴ID并加载
模板下载样例:https://grafana.com/grafana/dashboards/16098-node-exporter-dashboard-20240520-job/ ,内网环境使用JSON导入