一、安装prometheus
1.1 安装
sudo -i
mkdir -p /opt/prometheus
#移动解压后的文件名到/opt/,并改名prometheus
mv prometheus-2.45 /opt/prometheus/
#创建一个专门的prometheus用户: -M 不创建家目录, -s 不让登录
useradd -M -s /usr/sbin/nologin prometheus

##更改prometheus用户的文件夹权限:
chown prometheus:prometheus -R /opt/prometheus
1.2 修改配置
global:
  scrape_interval: 30s # Set the scrape interval to every 15 seconds. Default is every 1 minute.
  evaluation_interval: 30s # Evaluate rules every 15 seconds. The default is every 1 minute.

# 其他全局配置...

scrape_configs:
  # Prometheus 自身的监控配置
  - job_name: "prometheus"
    static_configs:
      - targets: ["localhost:9070"]

  - job_name: 'node_widgets'
    scheme: https  # 使用 HTTPS
    tls_config:
      insecure_skip_verify: true  # 忽略证书验证
    static_configs:
      - targets: ['xxxxx.xxx.com:443']  # 替换为您的服务器 B 地址和端口
    metrics_path: '/prometheus/metrics'  # Node Exporter 的路径
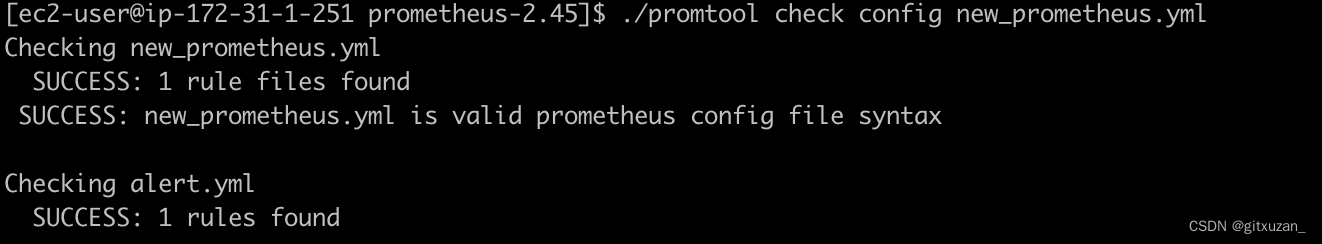
如果修改了配置可以验证配置
./promtool check config new_prometheus.yml
热更新
curl -X POST http://localhost:9070/-/reload
1.3 配置自启动
vim /etc/systemd/system/prometheus.service
写入数据
[Unit]
Description=Prometheus Server
After=network-online.target
[Service]
Type=simple
User=prometheus
Group=prometheus
Restart=on-failure
WorkingDirectory=/opt/prometheus/prometheus-2.45
ExecStart=/opt/prometheus/prometheus-2.45/prometheus --web.listen-address ":9070" --config.file /opt/prometheus/prometheus-2.45/new_prometheus.yml --storage.tsdb.path /opt/prometheus/prometheus-2.45/data --storage.tsdb.retention.time=20d --web.enable-lifecycle
[Install]
WantedBy=multi-user.target
开机自启动
sudo systemctl daemon-reload
sudo systemctl enable prometheus
sudo systemctl restart prometheus
sudo systemctl status prometheus
二、安装node_exporter
2.1 官网下载地址 https://prometheus.io/download/
2.2 开机自启动
添加
sudo vim /etc/systemd/system/node_exproter.service
[Unit]
Description=node_exporter
Documentation=https://prometheus.io/
After=network.target
[Service]
User=ubuntu
Group=ubuntu
ExecStart=/opt/prometheus/node_exproter-1.7.0/node_exporter --web.listen-address=":9101"
Restart=on-failure
[Install]
WantedBy=multi-user.target
sudo systemctl daemon-reload
sudo systemctl enable node_exproter
sudo systemctl restart node_exproter
sudo systemctl status node_exproter
三、安装grafana
3.1 官网下载地址 https://grafana.com/grafana/download?edition=oss&platform=linux
3.2 添加开机启动
添加service
sudo vim /etc/systemd/system/grafana.service
[Unit]
Description=Grafana server
Documentation=http://docs.grafana.org
[Service]
Type=simple
User=prometheus
Group=prometheus
Restart=on-failure
ExecStart=/opt/prometheus/grafana-v10.2.2/bin/grafana-server \
  --config=/opt/prometheus/grafana-v10.2.2/conf/grafana.ini \
  --homepath=/opt/prometheus/grafana-v10.2.2 \
  --http-port=3000
[Install]
WantedBy=multi-user.target
3.2 修改 grafana.init 邮箱配置
[smtp]
enabled = true
host = smtp.gmail.com:587
user = xuzan@lippu.ltd
# If the password contains # or ; you have to wrap it with triple quotes. Ex """#password;"""
password = 授权码
cert_file =
key_file =
skip_verify = true
from_address = xuzan@lippu.ltd
from_name = Grafana
ehlo_identity =
startTLS_policy =
sudo systemctl daemon-reload
sudo systemctl enable grafana
sudo systemctl restart grafana
sudo systemctl status grafana
四、alertmanager 安装
4.1 安装官网地址 https://prometheus.io/download/
4.2 新增启动项
编辑
sudo vim /etc/systemd/system/alertmanager.service
[Unit]
Description=Alert Manager
Wants=network-online.target
After=network-online.target

[Service]
Type=simple
User=prometheus
Group=prometheus
ExecStart=/opt/prometheus/alertmanager-0.26.0/alertmanager \
  --config.file=/opt/prometheus/alertmanager-0.26.0/alertmanager.yml \
  --storage.path=/opt/prometheus/alertmanager-0.26.0/data \
  --web.listen-address=:9071 \
  --cluster.listen-address=:9072

Restart=always

[Install]
WantedBy=multi-user.target
sudo systemctl daemon-reload
sudo systemctl enable alertmanager
sudo systemctl restart alertmanager
sudo systemctl status alertmanager
4.3 使用了prometheus 需要修改 new_prometheus.yml
新增
# Alertmanager configuration
alerting:
  alertmanagers:
    - static_configs:
        - targets:
            - alertmanager:9071

# Load rules once and periodically evaluate them according to the global 'evaluation_interval'.
rule_files:
  - "alert.yml"
在项目更目录下新增 新增alert.yml
groups:
- name: Prometheus alert
  rules:
  # 对任何实例超过30s无法联系的情况发出警报
  - alert: 服务告警
    expr: up == 0
    for: 30s
    labels:
      severity: critical
    annotations:
      instance: "{
   { $labels.instance }}"
      description: "{
   { $labels.job }} 服务已关闭"
具体告警规则:

alert: 这是告警的名称,在这个例子中命名为 "服务告警"。
expr: 这是触发告警的表达式。在这个例子中,表达式 up == 0 检查 up 指标是否等于 0。up 指标是 Prometheus 用来表示目标实例可达性的标准指标,其中 0 表示不可达,1 表示可达。
for: 这个条件指定了在触发告警之前必须满足告警条件的持续时间。在这里设置为 30s,意味着只有当 up 指标持续为 0 超过 30 秒时,才会触发告警。
labels: 这部分定义了附加到告警上的标签。在这个例子中,它设置了一个严重性标签(severity: critical),表示这是一个严重的告警。
annotations:
这部分提供了关于告警的更多信息,通常用于在告警通知中显示。在这个例子中,它包括两个注解:
instance: "{
   { $labels.instance }}":这将显示触发告警的实例。
description: "{
   { $labels.job }} 服务已关闭":这提供了一个描述性的消息,指出哪个服务(job)已经关闭。
4.4 验证配置
./promtool check config new_prometheus.yml
重新热加载配置
curl -X POST http://localhost:9070/-/reload
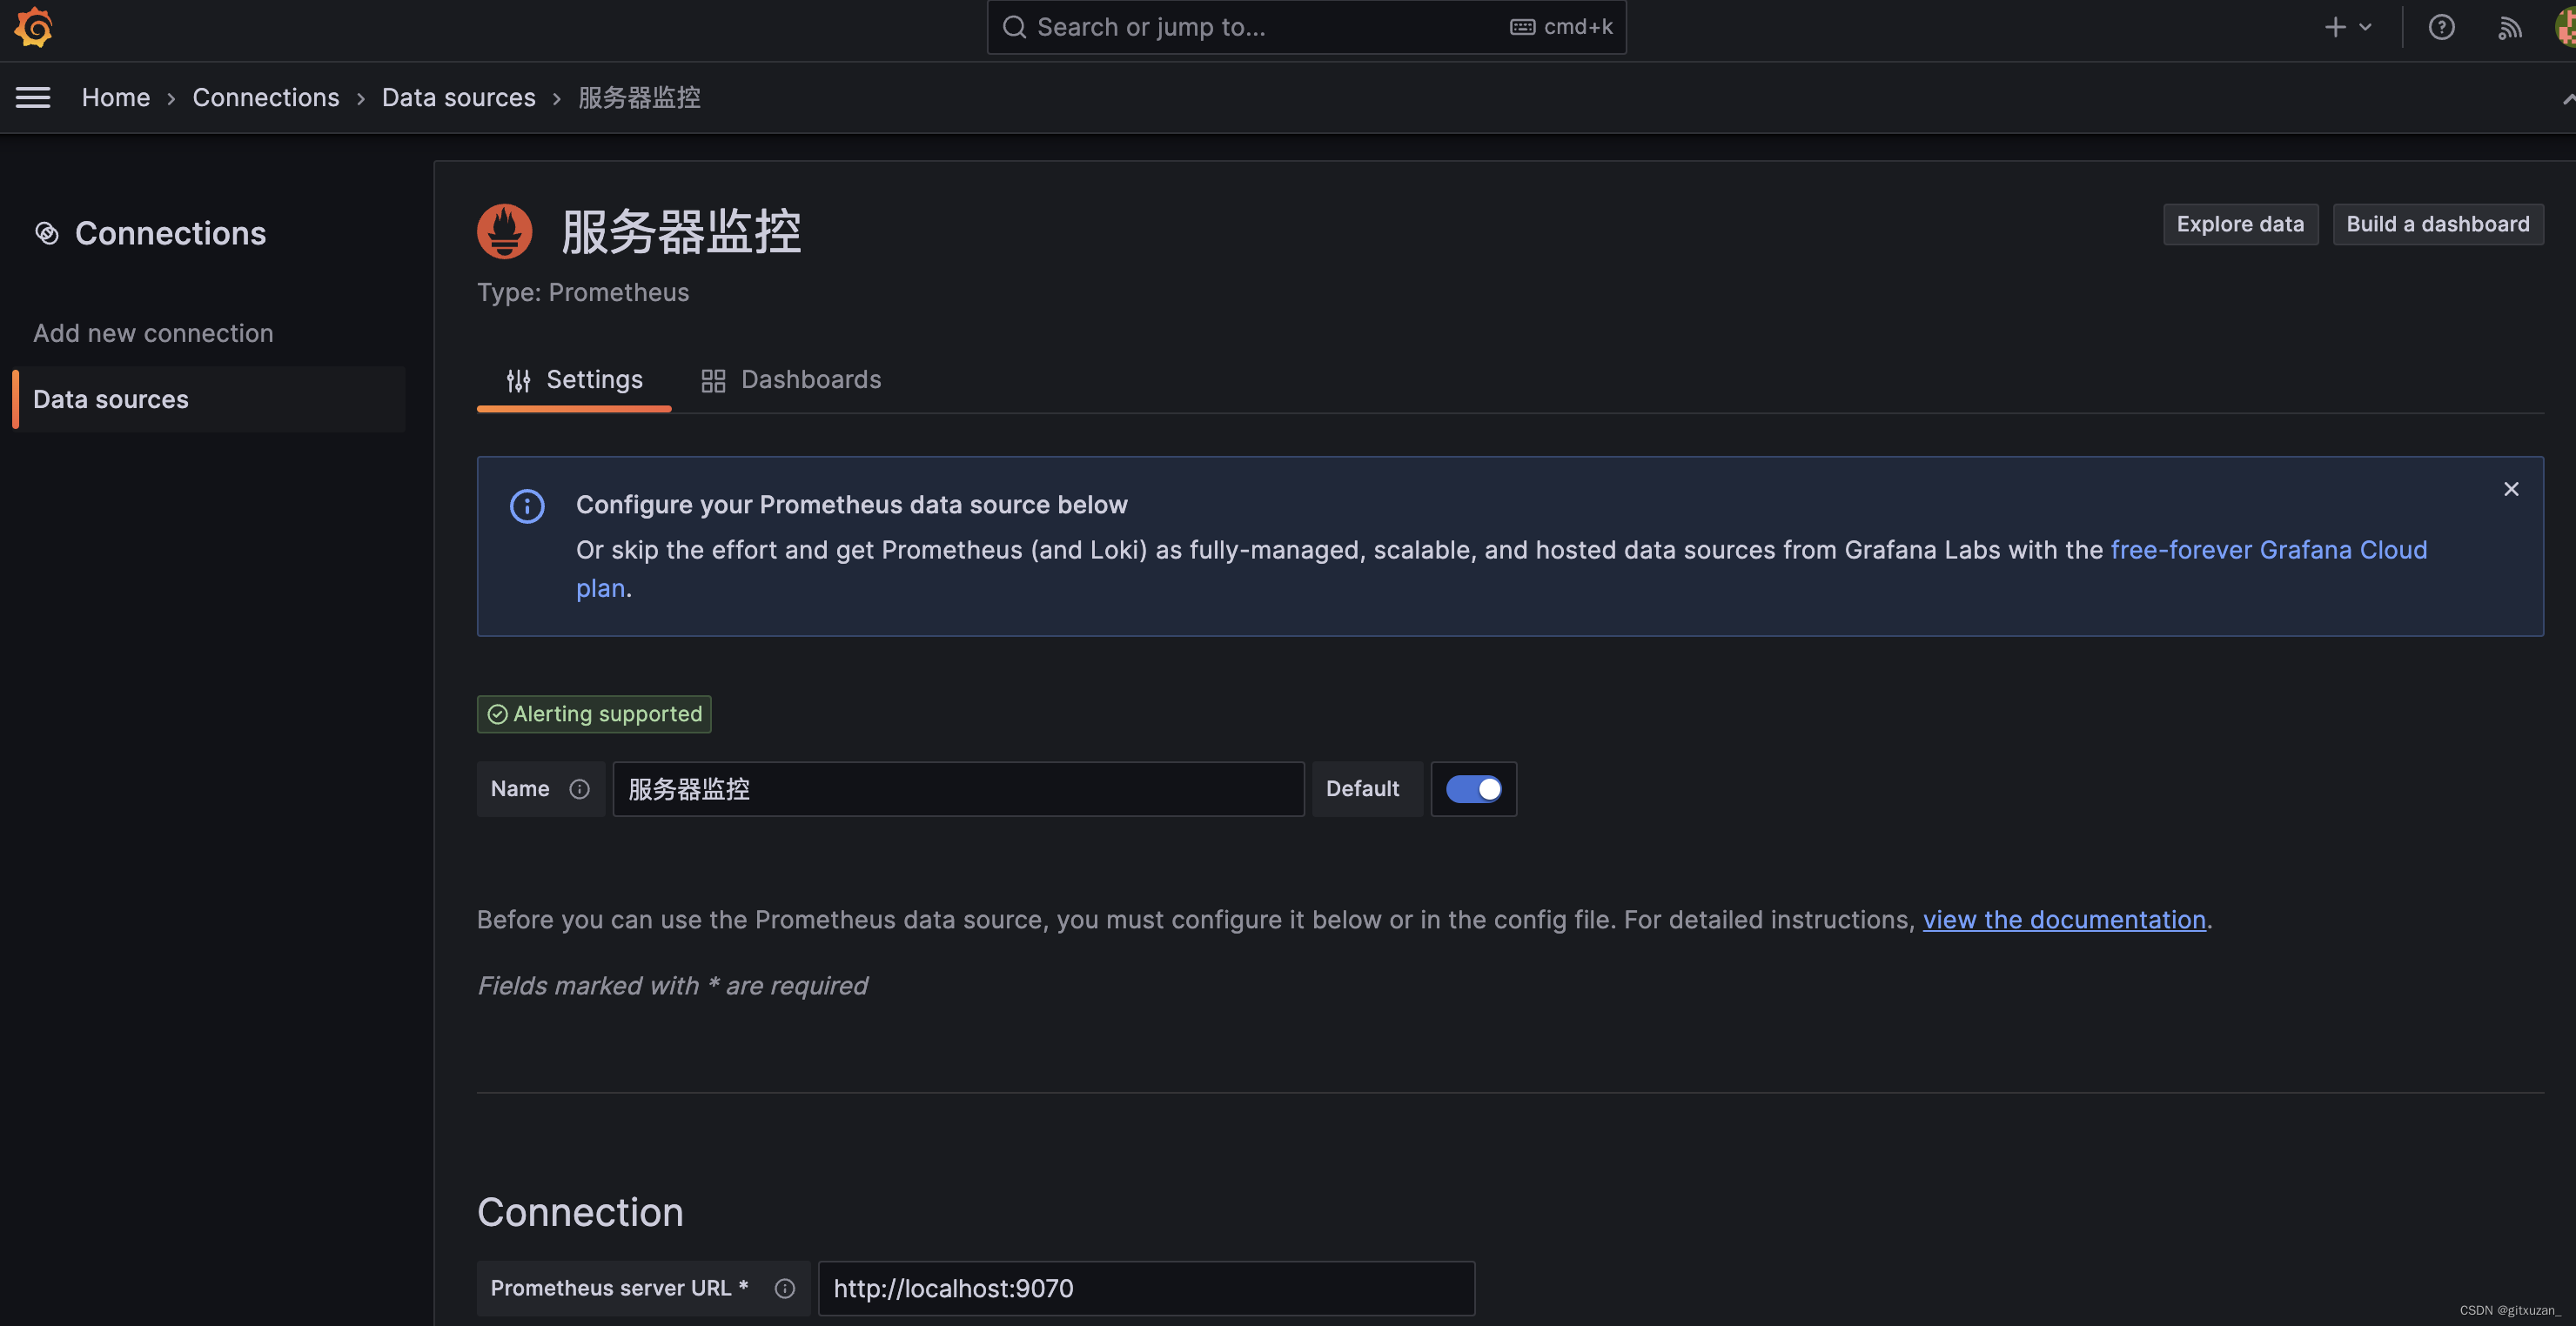
五、grafana 添加数据源
5.1 添加数据来源
这里填写prometheus 的数据源地址,因为grafana 和 prometheus 放到一台服务器上了,所以我填写的是localhost
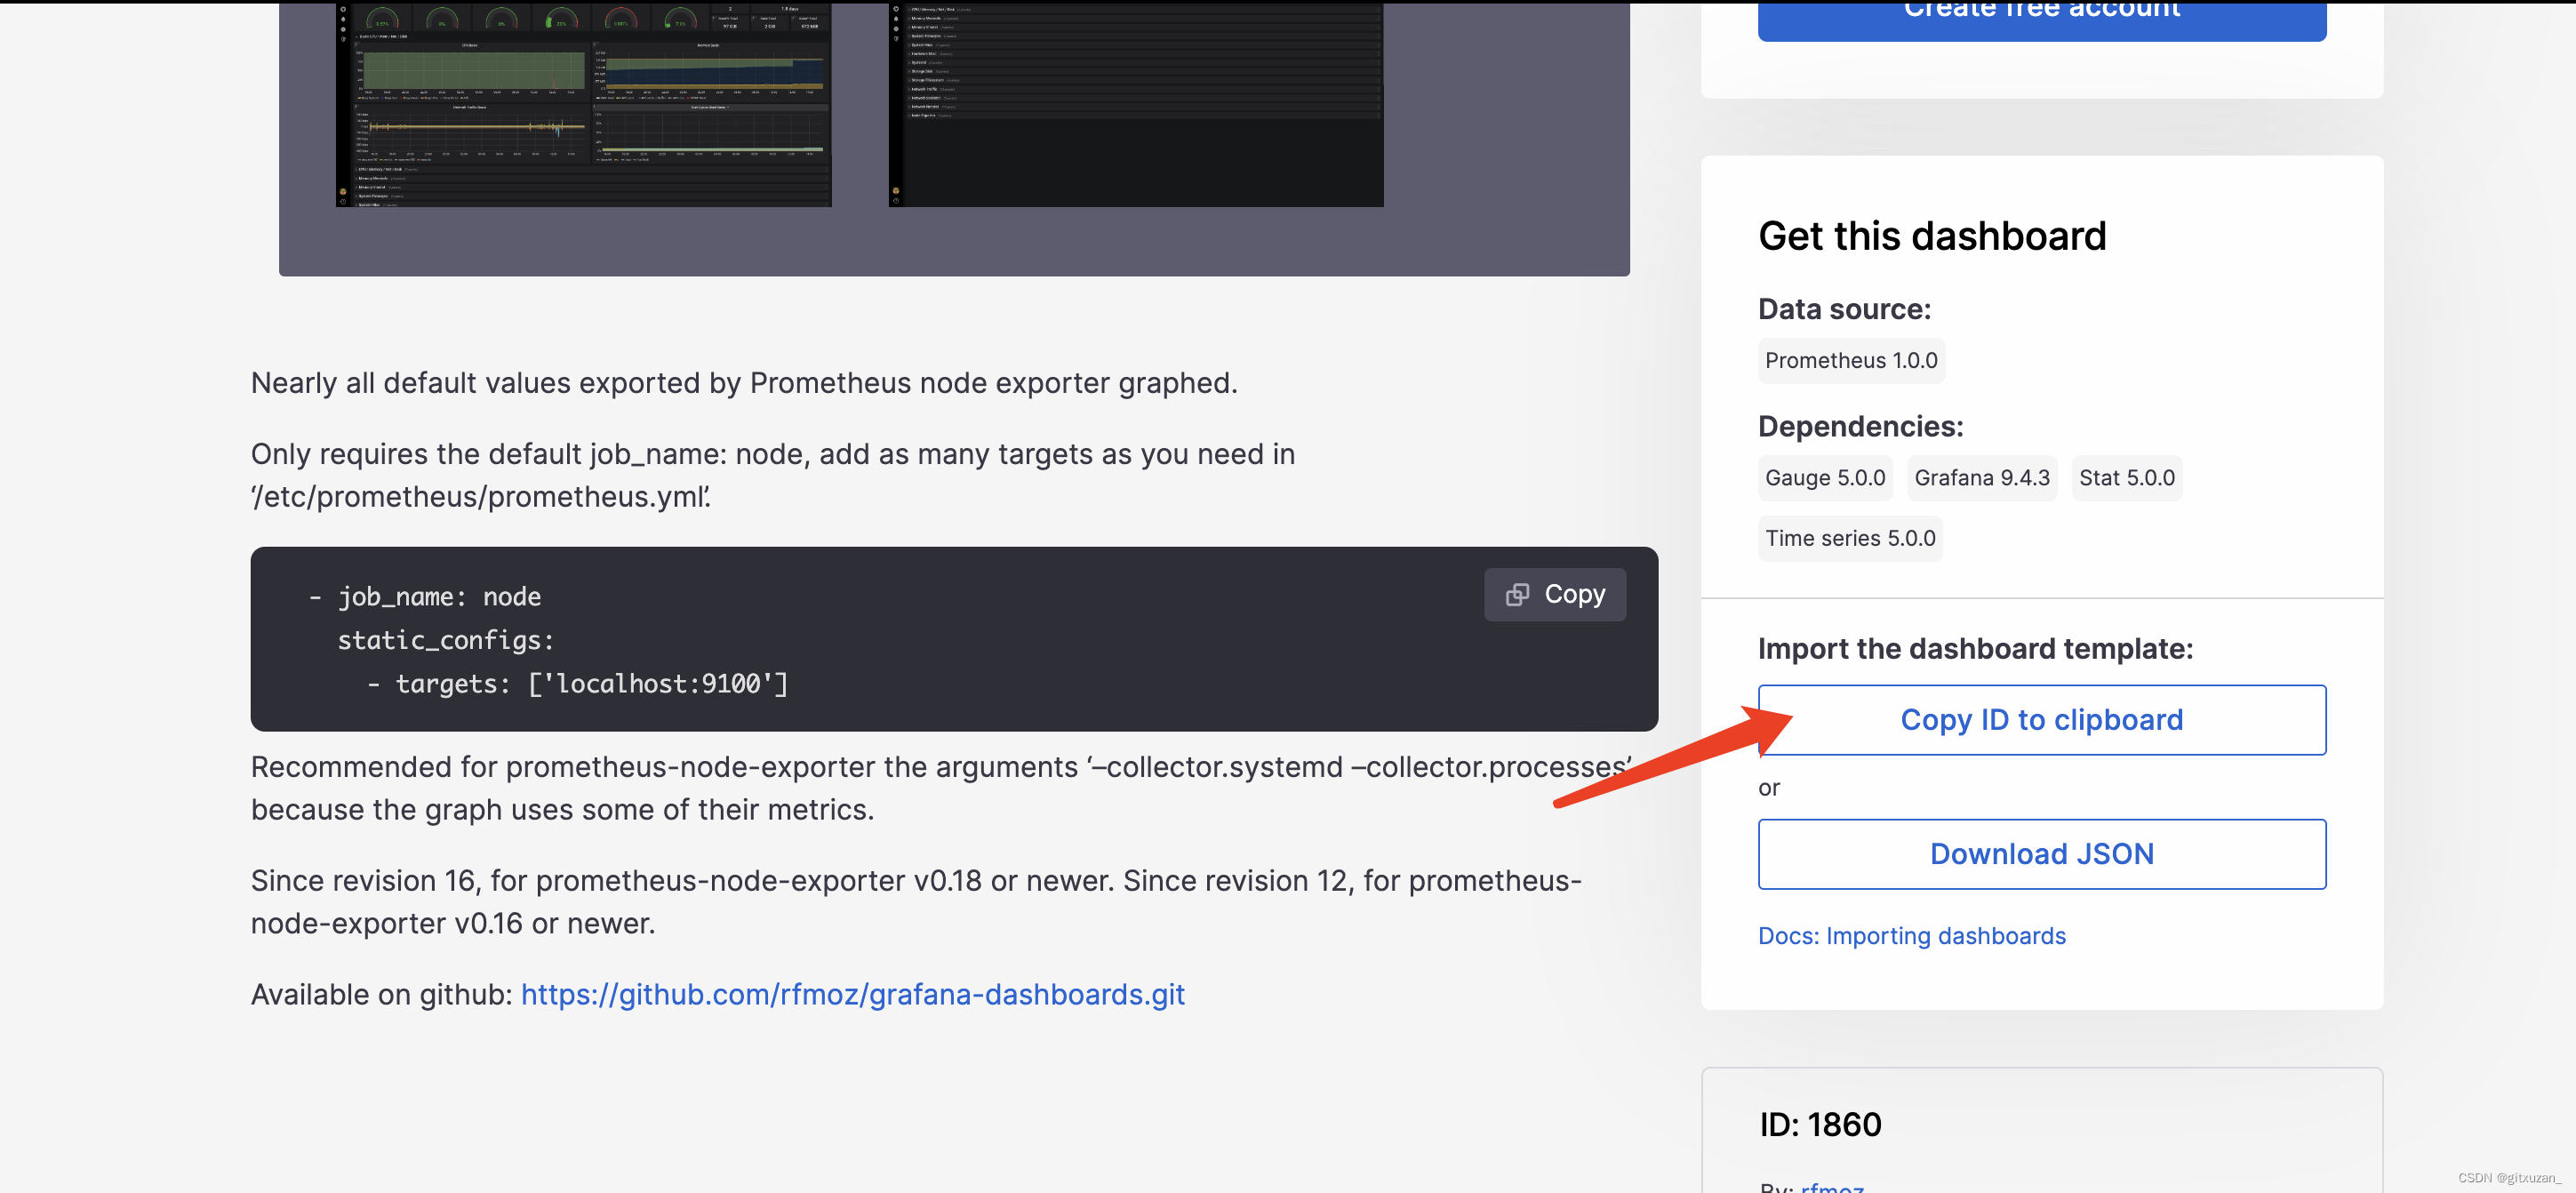
5.2 添加dashboards,添加地址: https://grafana.com/grafana/dashboards/
选择一个dashborads

copy dashborads 的ID
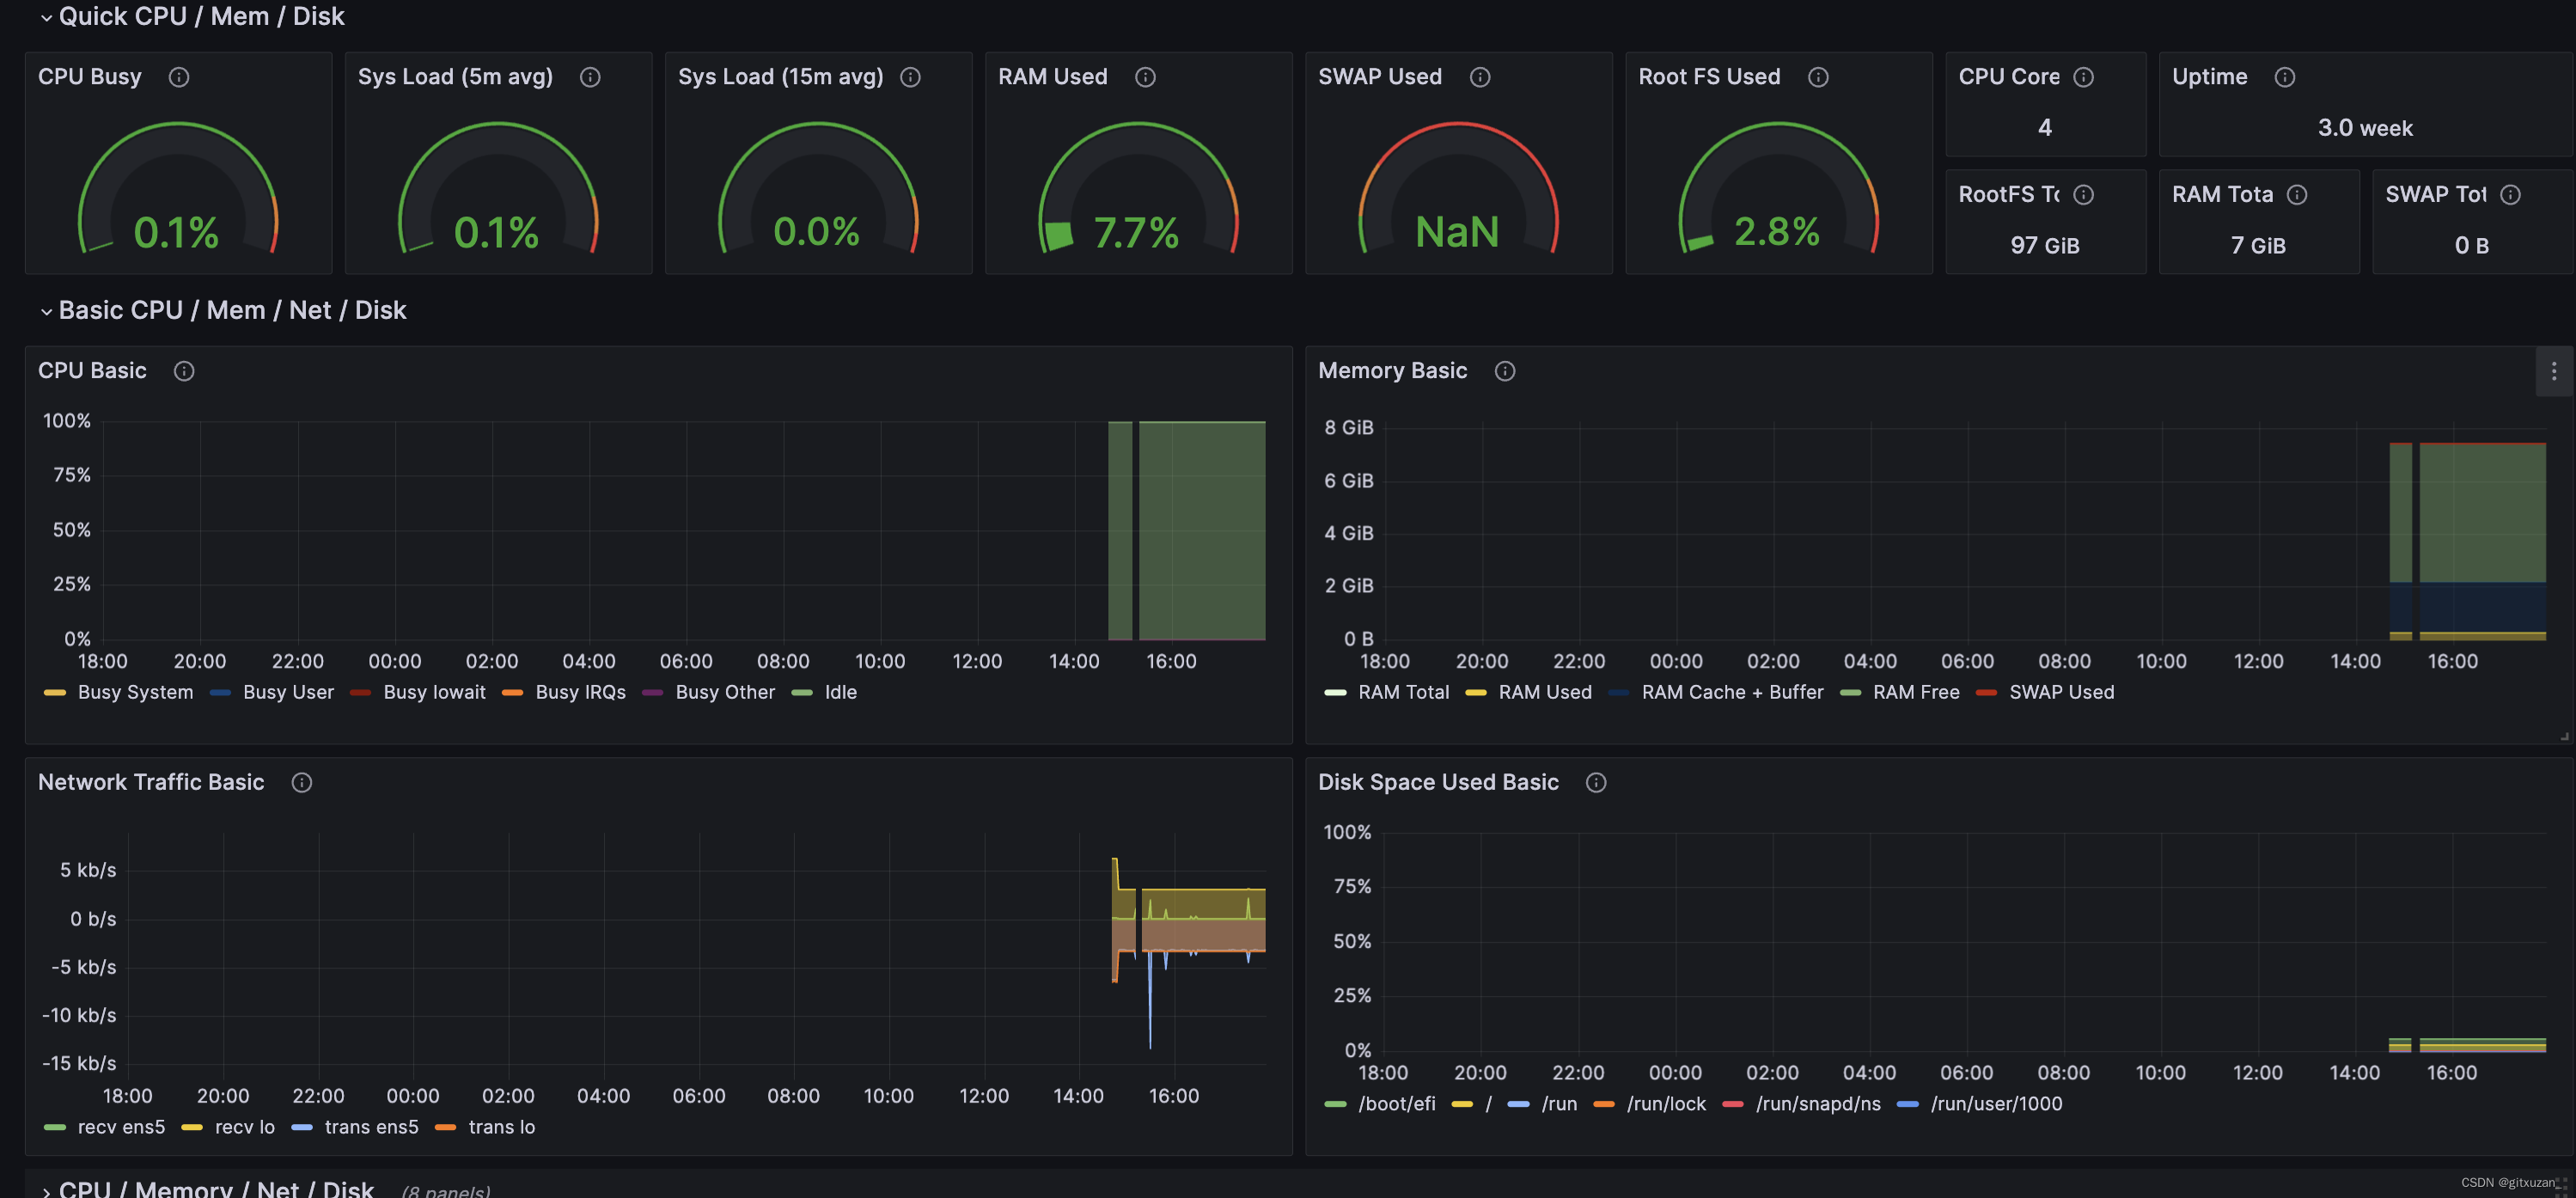
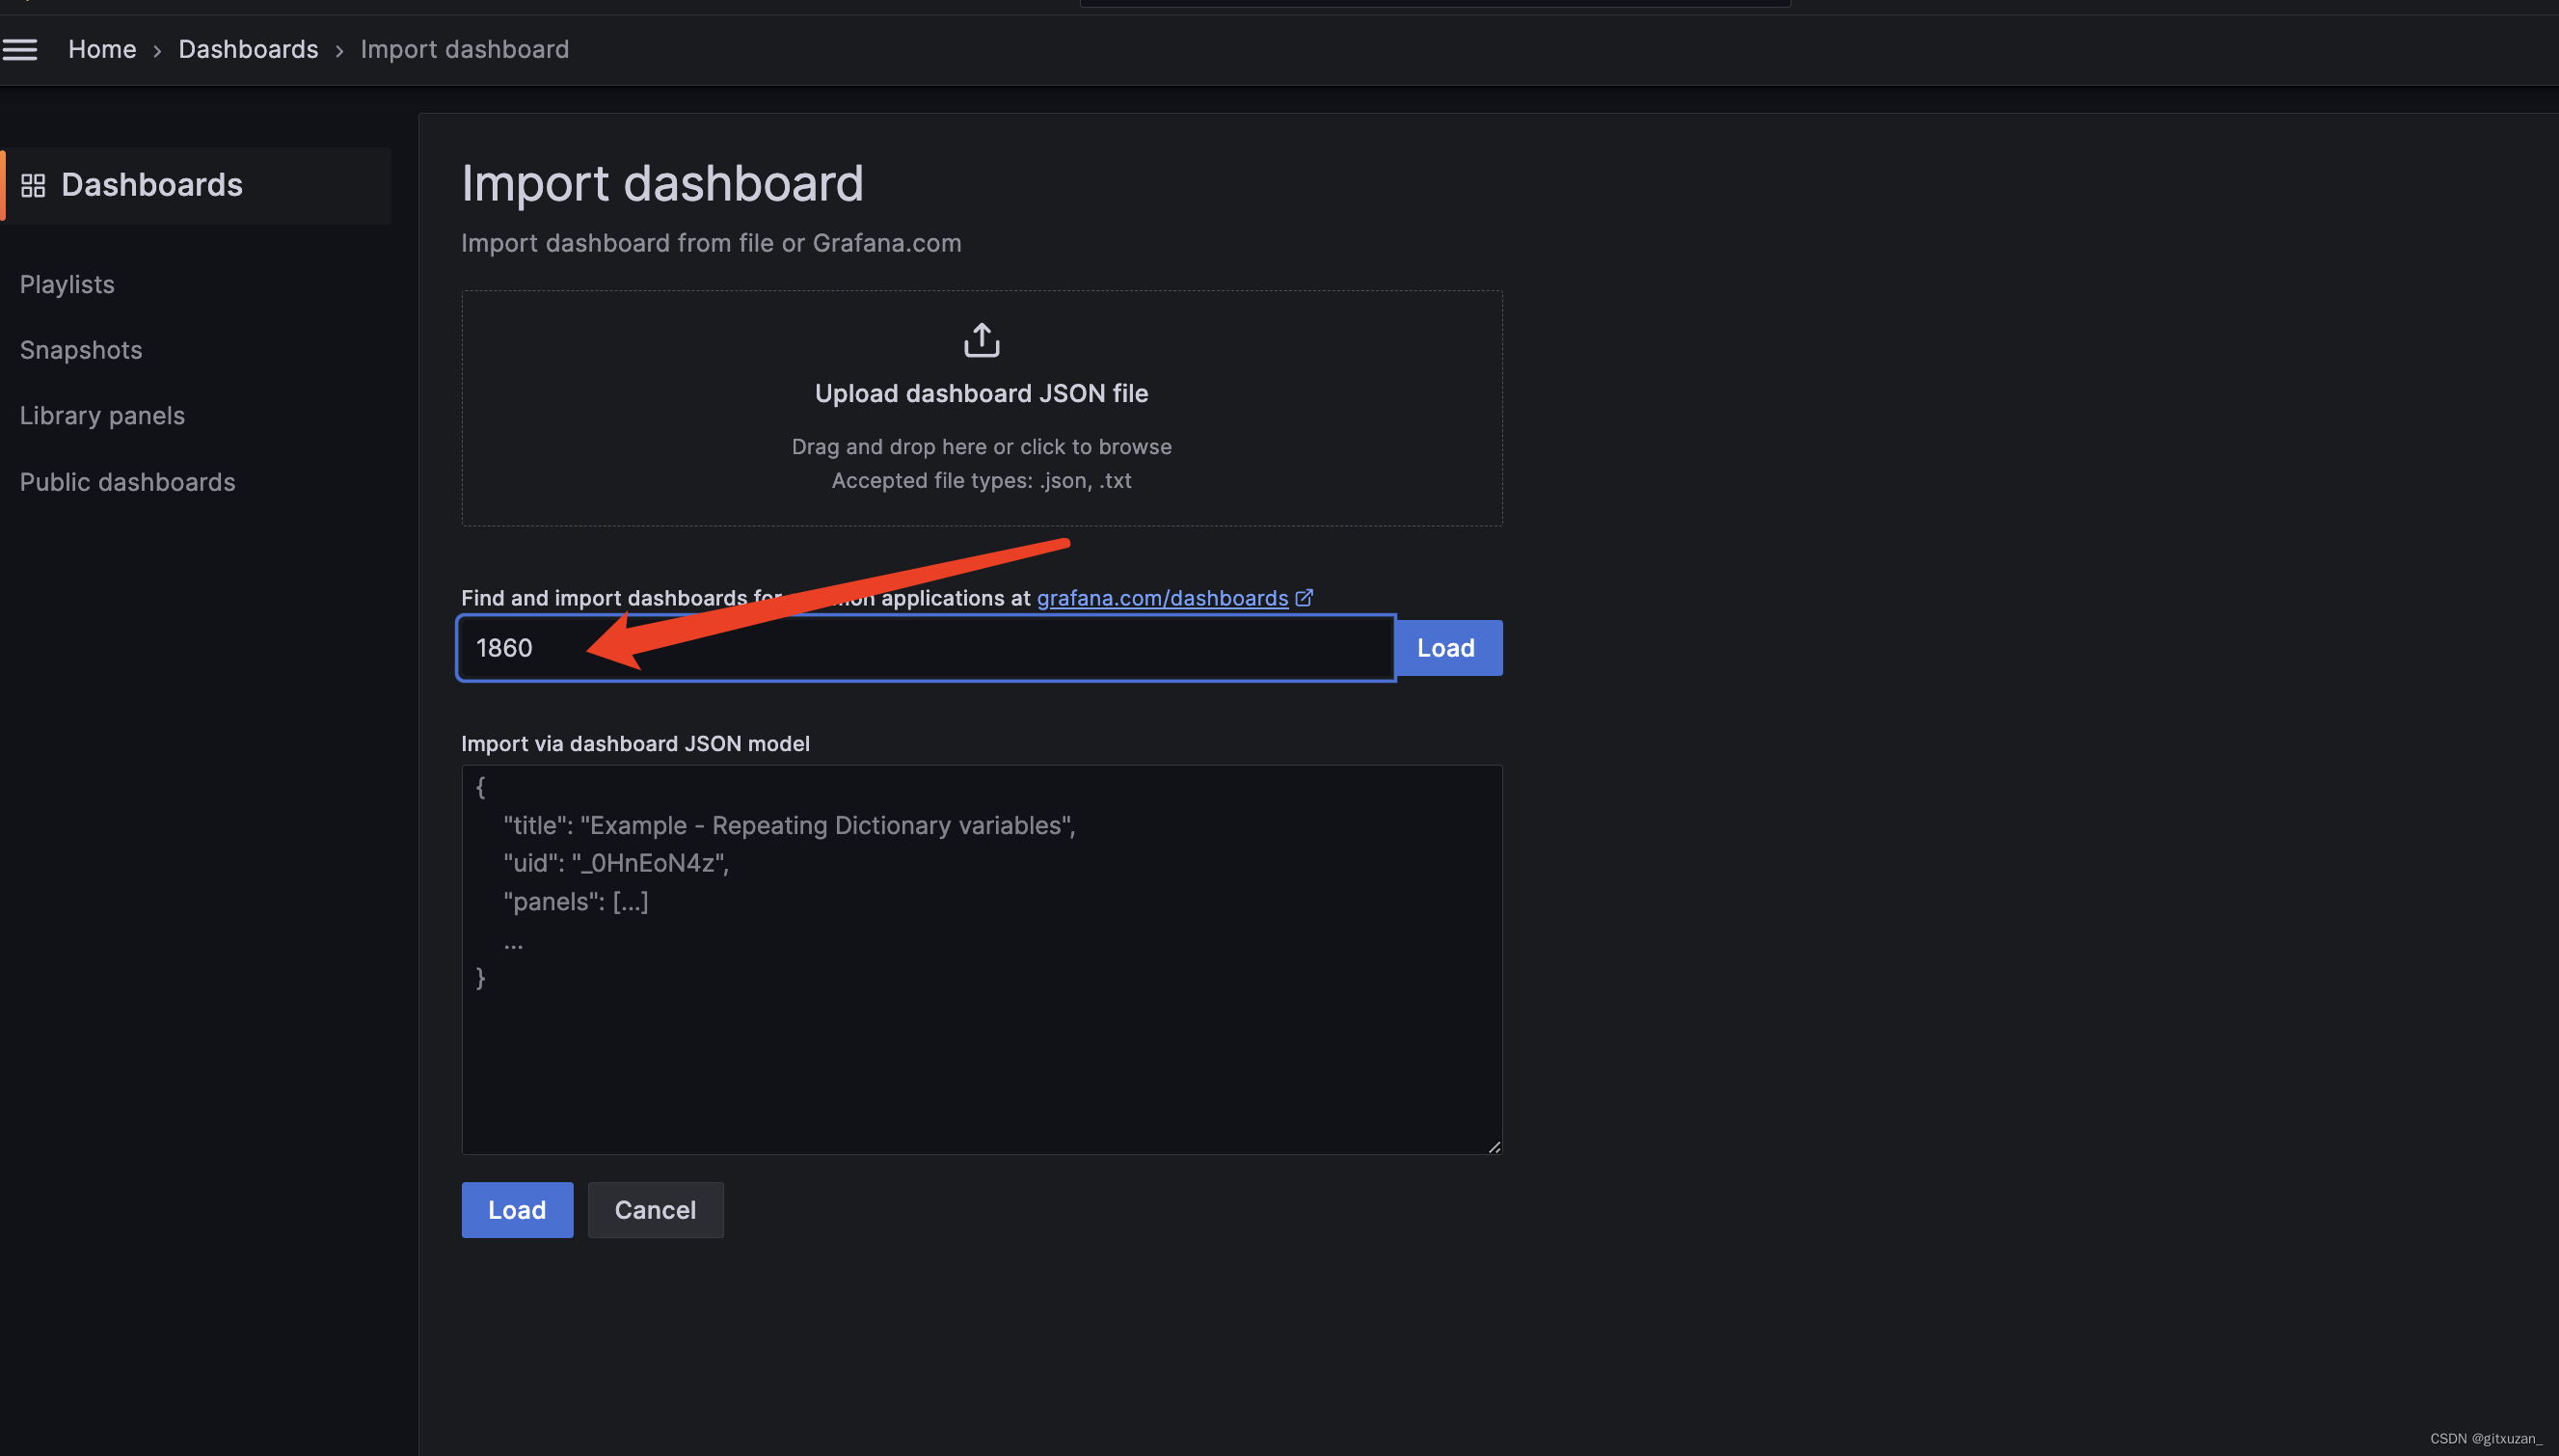
在grafana 界面导入dashborad ,可以通过ID导入
最后选择刚刚的数据源
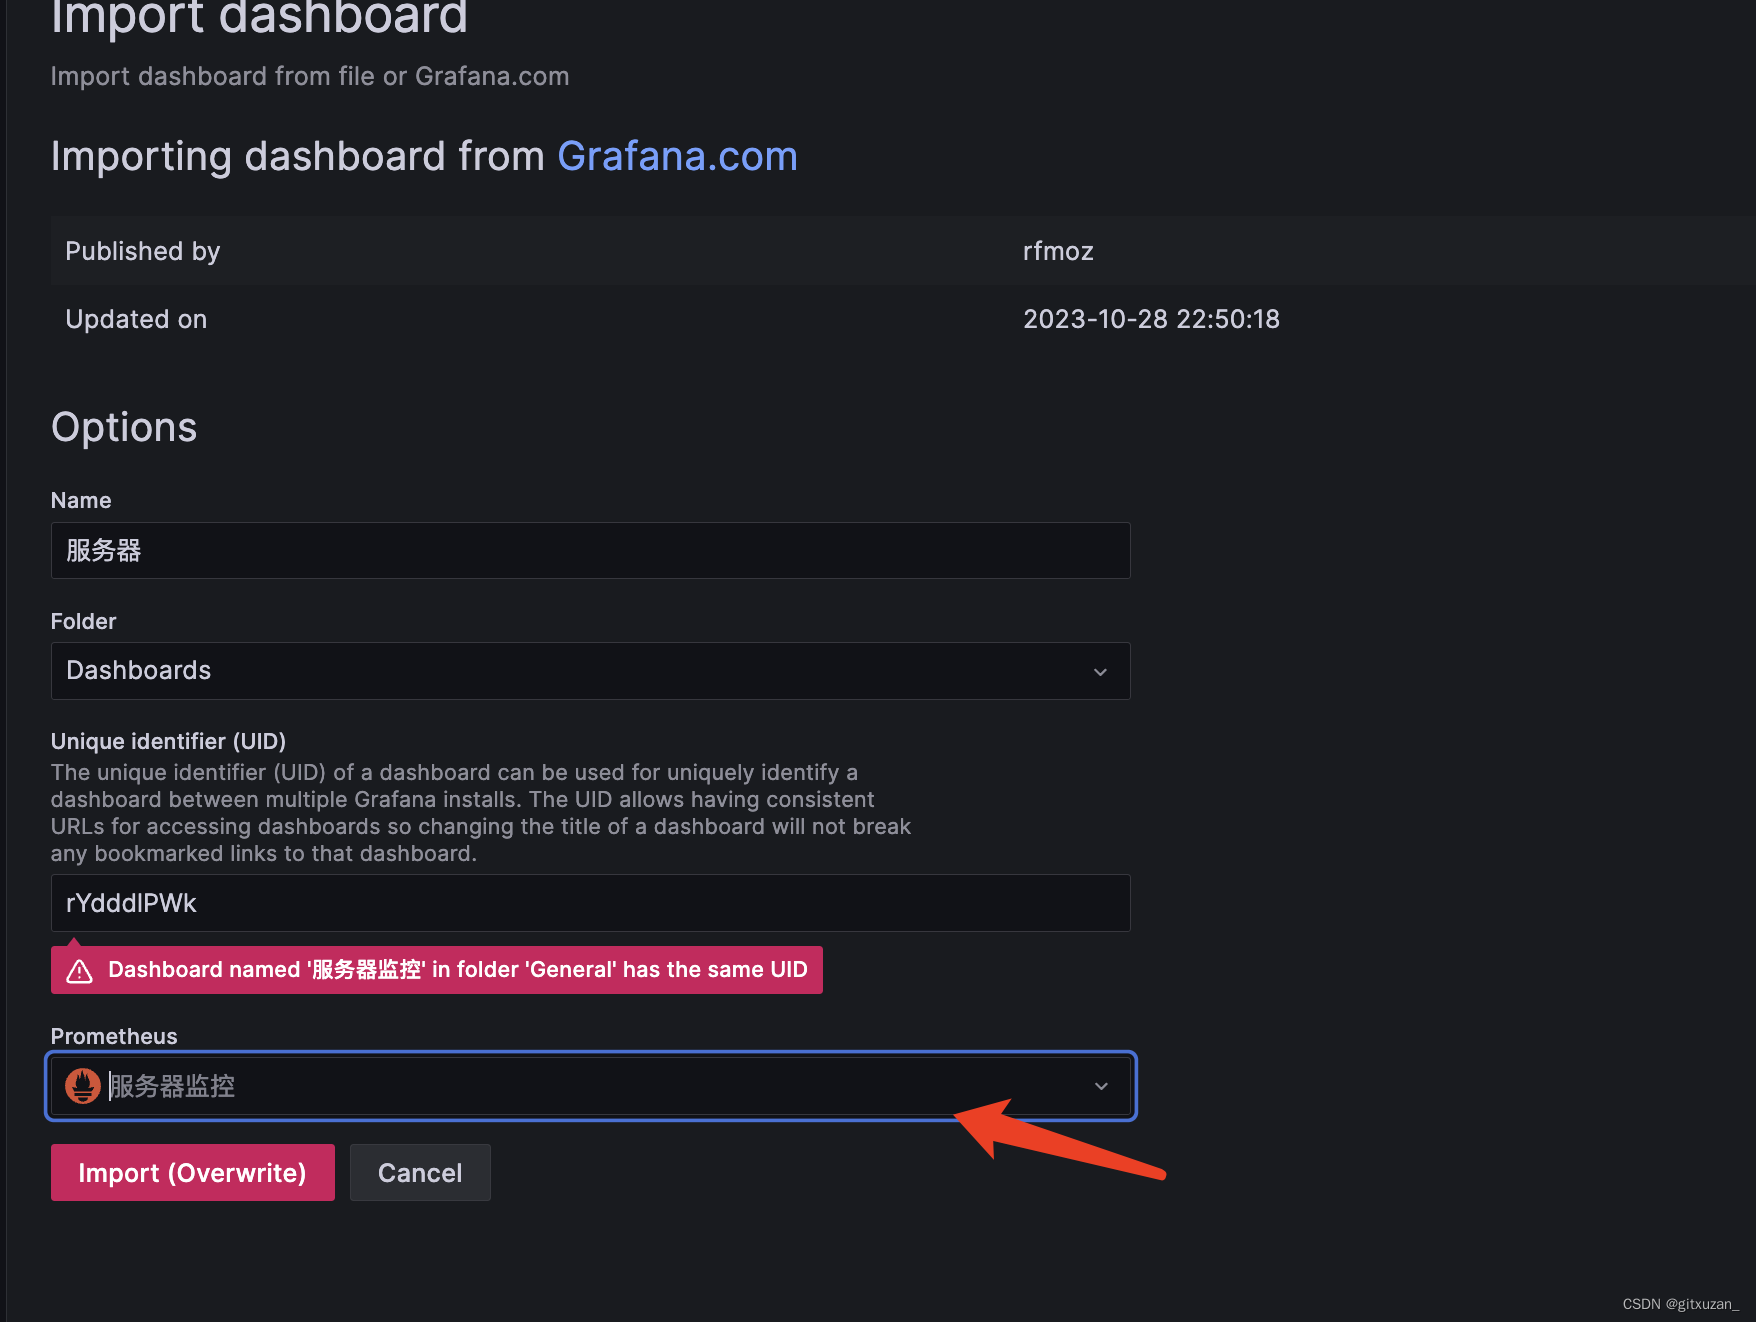
最终显示