「写在前面」
在科研数据分析中我们会重复地绘制一些图形,如果代码管理不当经常就会忘记之前绘图的代码。于是我计划开发一个 R 包(Biorplot),用来管理自己 R 语言绘图的代码。本系列文章用于记录 Biorplot 包开发日志。
相关链接
相关代码和文档都存放在了 Biorplot GitHub 仓库:
https://github.com/zhenghu159/Biorplot
欢迎大家 Follow 我的 GitHub 账号:
https://github.com/zhenghu159
我会不定期更新生物信息学相关工具和学习资料。如果您有任何问题和建议,或者想贡献自己的代码,请在我的 GitHub 上留言。
介绍
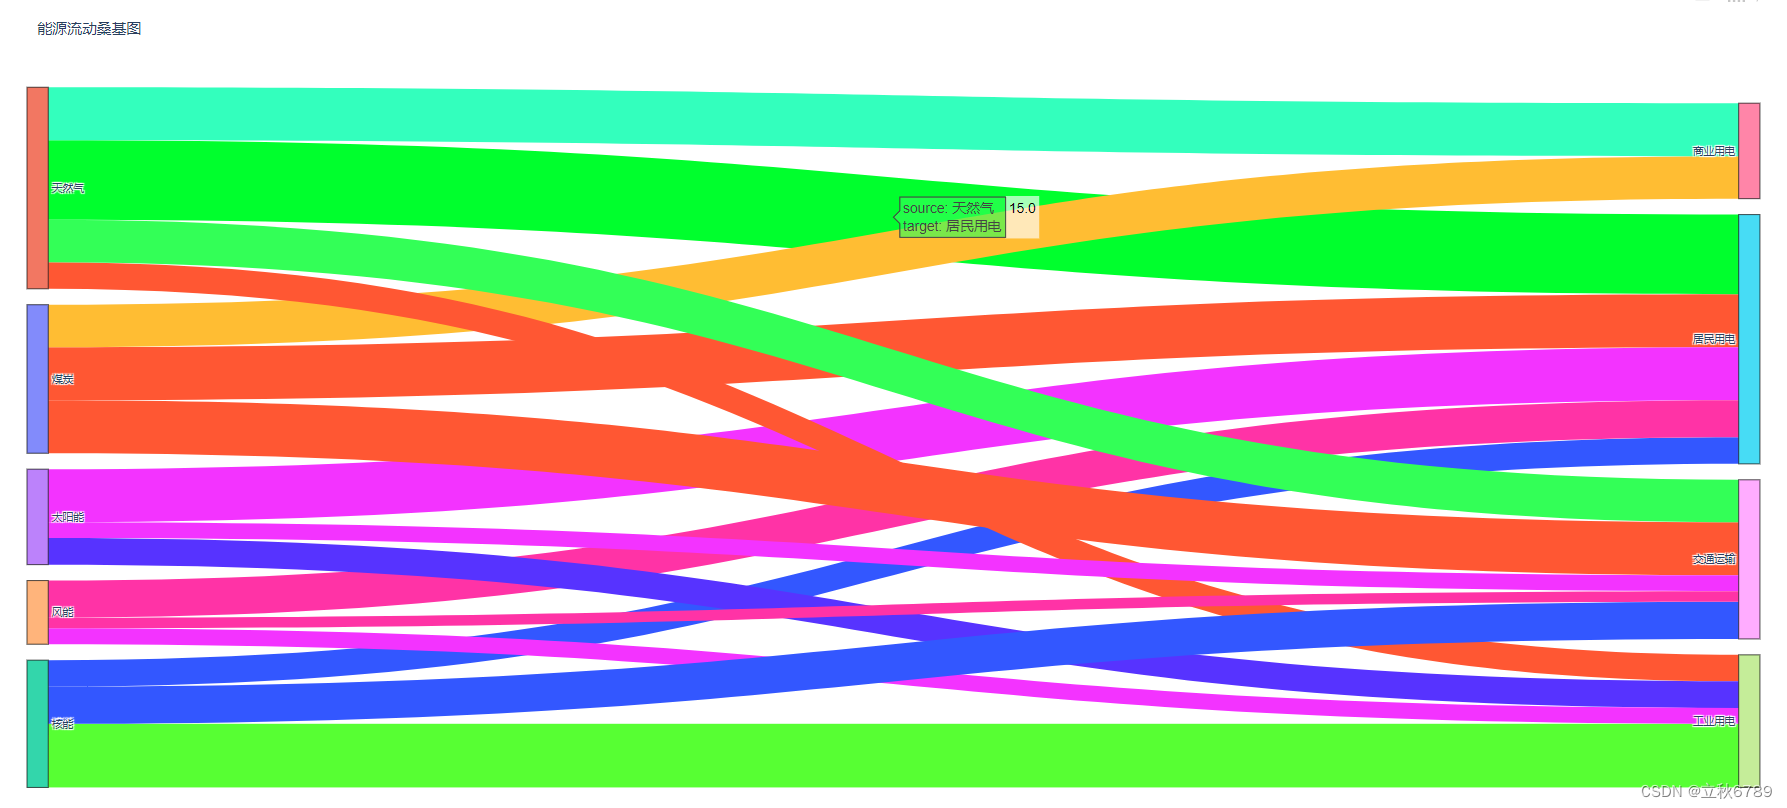
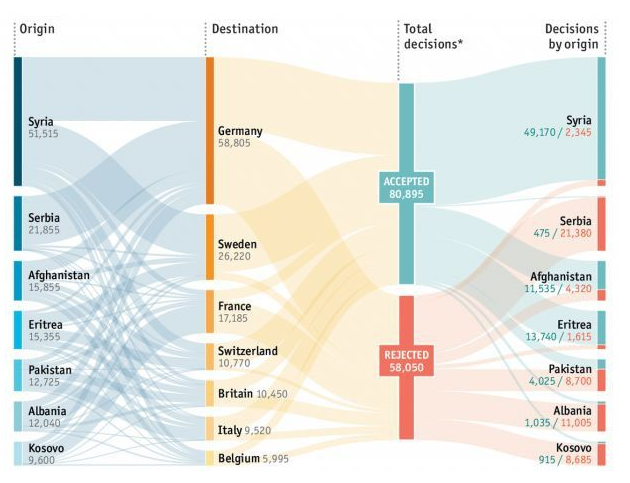
桑基图,是一种特定类型的流程图,图中延伸的分支的宽度对应数据流量的大小,比较适用于用户流量等数据的可视化分析。
在 Biorplot 中,我封装了 Bior_SankeyPlot() 函数来实现桑基图的绘制。
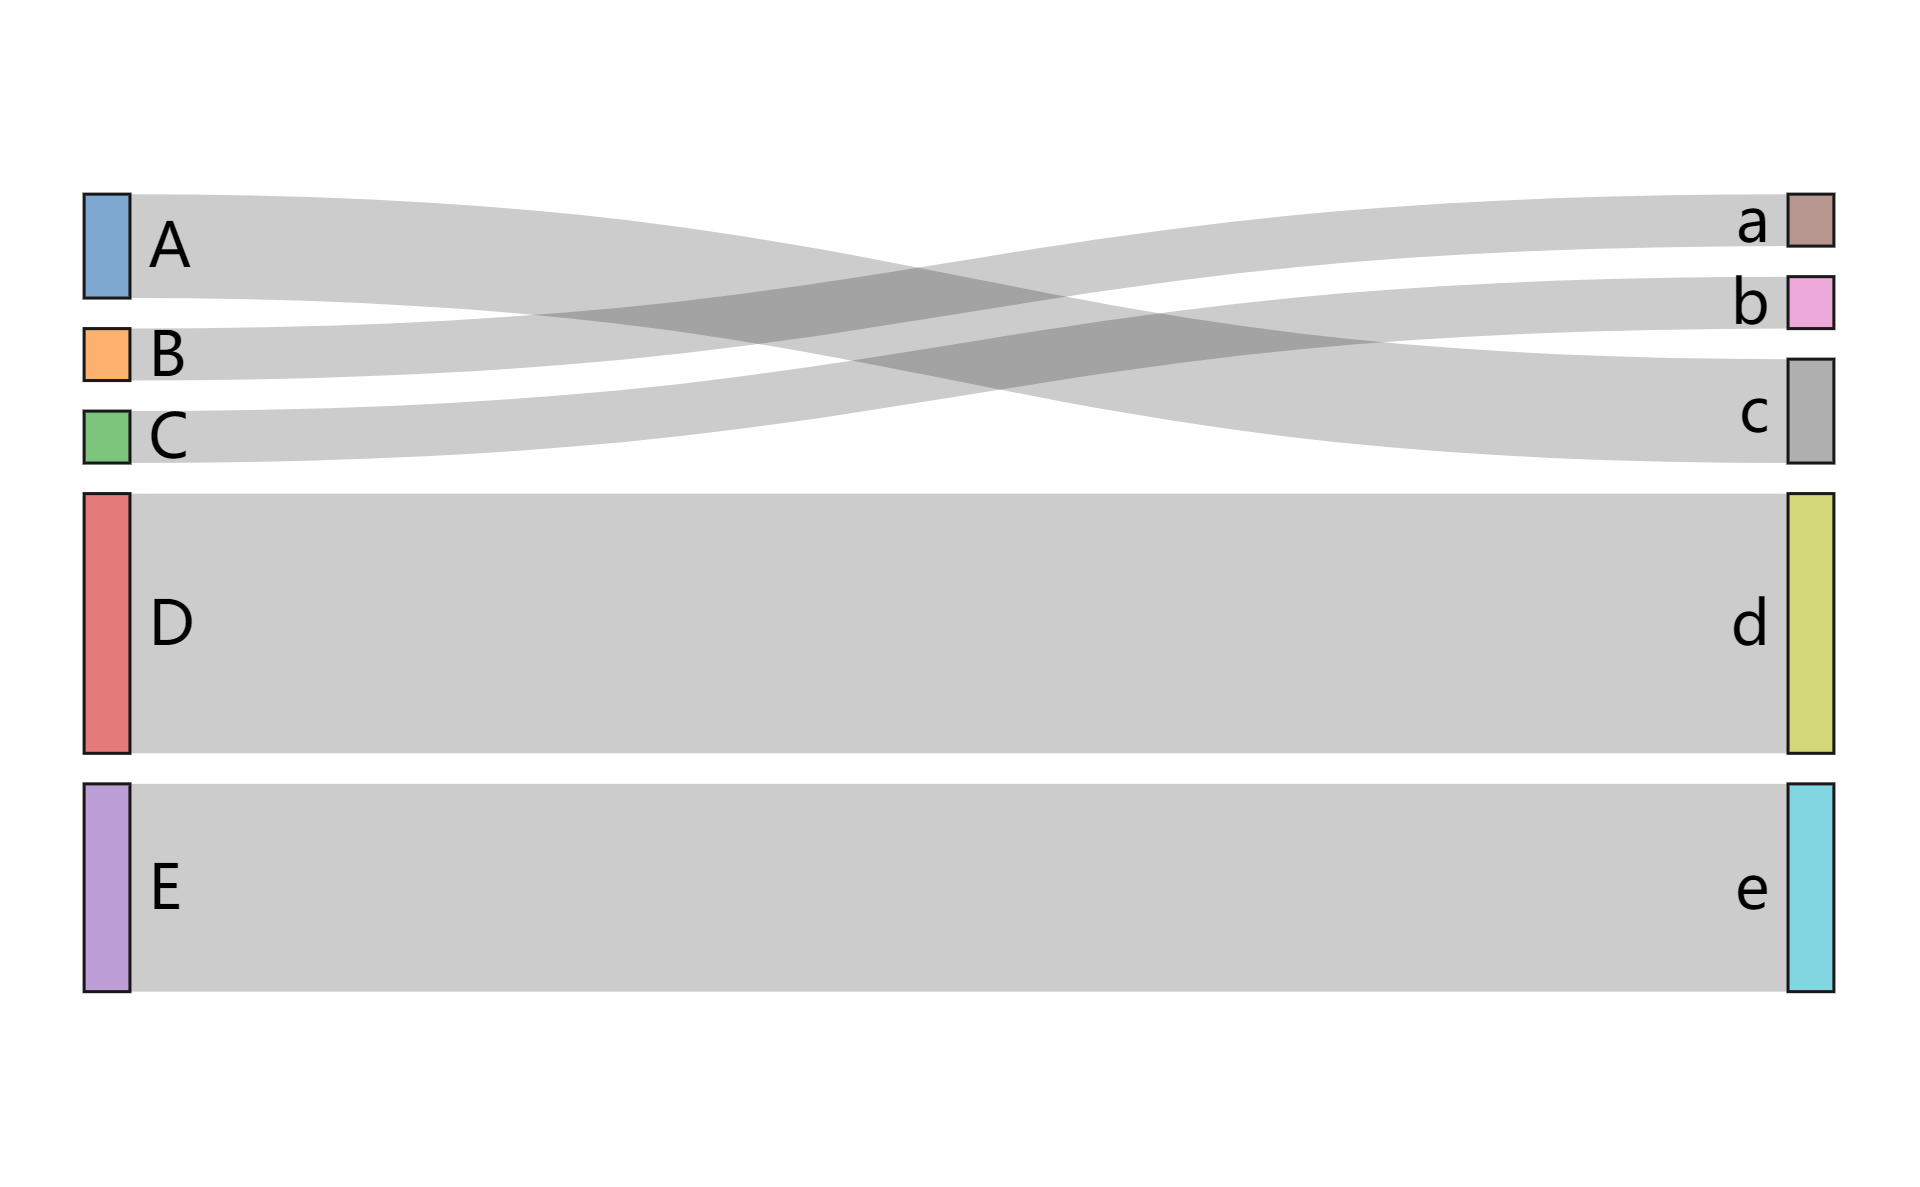
基础桑基图
绘制一个基础的桑基图如下:
绘图代码:
links <- data.frame(
  Source=c("C","A", "B", "E", "D"),
  Target=c("b","c", "a", "e", "d"),
  Value=c(1, 2, 1, 4, 5)
)
nodes <- data.frame(
  name = c("A", "B", "C", "D", "E", "a", "b", "c", "d", "e")
)
links$IDsource <- match(links$Source, nodes$name) -1
links$IDtarget <- match(links$Target, nodes$name) -1
Nodes.colour <- c("#1F77B4B2","#FF7F0EB2","#2CA02CB2","#D62728B2","#9467BDB2",
                  "#8C564BB2","#E377C2B2","#7F7F7FB2","#BCBD22B2","#17BECFB2")

p <- Bior_SankeyPlot(links, nodes, Nodes.colour=Nodes.colour, Nodes.order = nodes$name,
                     fontSize=20,iterations=0)
p
# save plot
# saveNetwork(p,"sankey.html")
# webshot("sankey.html", "sankey.pdf")
多层桑基图
绘制一个多层桑基图,并自定义颜色:

绘图代码:
links <- data.frame(
  Source = c(rep(c("A_1","B_1","C_1","D_1"),each=4), rep(c("A_2","B_2","C_2","D_2"),each=4)),
  Target = c(rep(c("A_2","B_2","C_2","D_2"),4), rep(c("A_3","B_3","C_3","D_3"),4)),
  Value = c(0.4,0.4,0.1,0.1, 0.1,0.8,0.05,0.05, 0.05,0.05,0.8,0.1, 0.05,0.1,0.05,0.8,
            0.4,0.4,0.1,0.1, 0.1,0.8,0.05,0.05, 0.05,0.05,0.8,0.1, 0.05,0.1,0.05,0.8)
)
links$Group <- ""
links$Group[which(links$Value > 0.5)] <- "Type1"
links$Group[which(links$Value > 0.1 & links$Value <= 0.5)] <- "Type2"
links$Group[which(links$Value <= 0.1)] <- "Type3"
nodes <- data.frame(
  name = c("A_1","B_1","C_1","D_1","A_2","B_2","C_2","D_2","A_3","B_3","C_3","D_3")
)
links$IDsource <- match(links$Source, nodes$name) - 1
links$IDtarget <- match(links$Target, nodes$name) - 1
Group.order <- c("Type1", "Type2", "Type3")
Group.colour <- c("#6860ff","#e489dc","#d0d5da")
Nodes.order <- nodes$name
Nodes.colour <- rep(c('#ffda11', '#f68d45', '#26d5ff', '#f05a9e'),3)

Bior_SankeyPlot(
    Links = links, Nodes = nodes, Source = "IDsource", Target = "IDtarget",
    Value = "Value", NodeID = "name", colourScale = colourScale, LinkGroup="Group",
    fontSize = 20, iterations=0,
    Group.order = Group.order, Group.colour = Group.colour,
    Nodes.order = Nodes.order, Nodes.colour = Nodes.colour)
源码解析
Biorplot::Bior_SankeyPlot() 函数主要继承了 networkD3::sankeyNetwork() 函数。并新增了节点和分组顺序、颜色设置参数:
-
Group.order(defaut: Group.order=NULL); text size Set Group order -
Group.colour(defaut: Group.colour=NULL); Set Group colour -
Nodes.order(defaut: Nodes.order=NULL); Set nodes order -
Nodes.colour(defaut: Nodes.colour=NULL); Set Nodes colour
源码:
#%%%%%%%%%%%%%%%%%%%%%%%%%%%%%%%%%%%%%%%%%%%%%%%%%%%%%%%%%%%%%%%%%%%%%%%%%%%%%%%

#' Sankey Plot
#' @description Create a sankey plot.
#'
#' @importFrom networkD3 sankeyNetwork
#'
#' @inheritParams networkD3::sankeyNetwork
#'
#' @param Group.order (defaut: Group.order=NULL); text size Set Group order
#' @param Group.colour (defaut: Group.colour=NULL); Set Group colour
#' @param Nodes.order (defaut: Nodes.order=NULL); Set nodes order
#' @param Nodes.colour (defaut: Nodes.colour=NULL); Set Nodes colour
#'
#' @export
#'
#' @examples
#' # Examples 1
#' links <- data.frame(
#'   Source=c("C","A", "B", "E", "D"),
#'   Target=c("b","c", "a", "e", "d"),
#'   Value=c(1, 2, 1, 4, 5)
#'  )
#' nodes <- data.frame(
#'   name = c("A", "B", "C", "D", "E", "a", "b", "c", "d", "e")
#'  )
#' links$IDsource <- match(links$Source, nodes$name) -1
#' links$IDtarget <- match(links$Target, nodes$name) -1
#' Nodes.colour <- c("#1F77B4B2","#FF7F0EB2","#2CA02CB2","#D62728B2","#9467BDB2",
#'                   "#8C564BB2","#E377C2B2","#7F7F7FB2","#BCBD22B2","#17BECFB2")
#'
#' p <- Bior_SankeyPlot(links, nodes, Nodes.colour=Nodes.colour, Nodes.order = nodes$name,
#'                      fontSize=20,iterations=0)
#' p
#' # save plot
#' # saveNetwork(p,"sankey.html")
#' # webshot("sankey.html" , "sankey.pdf")
#'
#'
#' # Examples 2
#' links <- data.frame(
#'   Source = c(rep(c("A_1","B_1","C_1","D_1"),each=4), rep(c("A_2","B_2","C_2","D_2"),each=4)),
#'   Target = c(rep(c("A_2","B_2","C_2","D_2"),4), rep(c("A_3","B_3","C_3","D_3"),4)),
#'   Value = c(0.4,0.4,0.1,0.1, 0.1,0.8,0.05,0.05, 0.05,0.05,0.8,0.1, 0.05,0.1,0.05,0.8,
#'             0.4,0.4,0.1,0.1, 0.1,0.8,0.05,0.05, 0.05,0.05,0.8,0.1, 0.05,0.1,0.05,0.8)
#' )
#' links$Group <- ""
#' links$Group[which(links$Value > 0.5)] <- "Type1"
#' links$Group[which(links$Value > 0.1 & links$Value <= 0.5)] <- "Type2"
#' links$Group[which(links$Value <= 0.1)] <- "Type3"
#' nodes <- data.frame(
#'   name = c("A_1","B_1","C_1","D_1","A_2","B_2","C_2","D_2","A_3","B_3","C_3","D_3")
#' )
#' links$IDsource <- match(links$Source, nodes$name) - 1
#' links$IDtarget <- match(links$Target, nodes$name) - 1
#' Group.order <- c("Type1", "Type2", "Type3")
#' Group.colour <- c("#6860ff","#e489dc","#d0d5da")
#' Nodes.order <- nodes$name
#' Nodes.colour <- rep(c('#ffda11', '#f68d45', '#26d5ff', '#f05a9e'),3)
#'
#' Bior_SankeyPlot(
#'   Links = links, Nodes = nodes, Source = "IDsource", Target = "IDtarget",
#'   Value = "Value", NodeID = "name", colourScale = colourScale, LinkGroup="Group",
#'   fontSize = 20, iterations=0,
#'   Group.order = Group.order, Group.colour = Group.colour,
#'   Nodes.order = Nodes.order, Nodes.colour = Nodes.colour)
#'
Bior_SankeyPlot <- function(Links, Nodes, Source = "IDsource", Target = "IDtarget",
                            Value = "Value", NodeID = "name", NodeGroup = NodeID,
                            LinkGroup = NULL, units = "",
                            colourScale = JS("d3.scaleOrdinal(d3.schemeCategory20);"), fontSize = 7,
                            fontFamily = NULL, nodeWidth = 15, nodePadding = 10, margin = NULL,
                            height = NULL, width = NULL, iterations = 32, sinksRight = TRUE,
                            Group.order=NULL, Group.colour=NULL,
                            Nodes.order=NULL, Nodes.colour=NULL)
{

  if (is.null(Group.order)){
    Group.order <- sort(unique(Links$Group))
  }
  if (is.null(Nodes.order)){
    Nodes.order <- Nodes$name
  }

  if ((!is.null(Group.order)) & (is.null(Nodes.order))){
    domain <- c(Group.order)
    range <- c(Group.colour)
  }else if ((is.null(Group.order)) & (!is.null(Nodes.order))){
    domain <- c(Nodes.order)
    range <- c(Nodes.colour)
  }else if ((!is.null(Group.order)) & (!is.null(Nodes.order))){
    domain <- c(Group.order, Nodes.order)
    range <- c(Group.colour, Nodes.colour)
  }else{
    domain <- NULL
    range <- NULL
  }

  colourScale <- paste('d3.scaleOrdinal() .domain(["', domain[1], sep = '')
  for (i in 2:length(domain)){
    colourScale <- paste(colourScale, '", "', domain[i], sep = '')
  }
  colourScale <- paste(colourScale, '"]) .range(["', sep = '')
  colourScale <- paste(colourScale, range[1], sep = '')
  for (i in 2:length(range)){
    colourScale <- paste(colourScale,'", "', range[i], sep = '')
  }
  colourScale <- paste(colourScale,'"])', sep = '')

  if (is.null(domain) & is.null(range)){
    colourScale <- "d3.scaleOrdinal(d3.schemeCategory20);"
  }

  p <-
    sankeyNetwork(
      Links = Links, Nodes = Nodes, Source = Source, Target = Target,
      Value = Value, NodeID = NodeID, NodeGroup = NodeID,
      LinkGroup = LinkGroup, units = units,
      colourScale = colourScale, fontSize = fontSize,
      fontFamily = fontFamily, nodeWidth = nodeWidth, nodePadding = nodePadding,
      margin = margin,
      height = height, width = width, iterations = iterations, sinksRight = sinksRight)

  return(p)
}

#%%%%%%%%%%%%%%%%%%%%%%%%%%%%%%%%%%%%%%%%%%%%%%%%%%%%%%%%%%%%%%%%%%%%%%%%%%%%%%%
注:本文为个人学习笔记,仅供大家参考学习,不得用于任何商业目的。如有侵权,请联系作者删除。

本文由 mdnice 多平台发布


![【代码随想录】【算法训练营】【第35天】 [1005]K次取反后最大化的数组和 [134]加油站 [135]分发糖果](https://img-blog.csdnimg.cn/direct/004a8a9e87b64145abca2ec8cbb10848.png)