Title
题目
A visual–language foundation model for pathology image analysis using medical Twitter
利用医学Twitter进行病理图像分析的视觉-语言基础模型
01
文献速递介绍
缺乏公开可用的医学图像标注是计算研究和教育创新的一个重要障碍。同时,许多医生在公共论坛上(如医学Twitter)分享了去标识化的图像和大量知识。在这里,我们利用这些众包平台来策划OpenPath,这是一个包含208,414张病理图像与自然语言描述配对的大型数据集。我们通过开发病理语言-图像预训练(PLIP)来展示这一资源的价值,这是一种多模态人工智能,具有图像和文本理解能力,它是在OpenPath上进行训练的。PLIP在四个外部数据集上对新的病理图像进行分类的性能达到了最先进水平:对于零样本分类,与先前的对比语言-图像预训练模型相比,PLIP的F1分数为0.565–0.832,而先前模型的F1分数为0.030–0.481。在PLIP嵌入之上训练一个简单的监督分类器,相对于使用其他监督模型嵌入,也实现了F1分数的2.5%提高。此外,PLIP使用户能够通过图像或自然语言搜索检索类似案例,极大地促进了知识共享。我们的方法表明,公开分享的医学信息是一种巨大的资源,可以用来开发医学人工智能,以增强诊断、知识共享和教育。
Method
方法
Description of the OpenPath dataset
Release policy.In accordance with the policy and regulation of Twitter and other entities including LAION, all information provided in the datasets is linked to the original source of the data. Specifically, data that have been collected from Twitter are released in the form of Tweet IDs; data that have been collected from LAION are released in the form of URLs to images. Interested users will need to refer to the original sources to understand if their usage is compliant with the policies and regulations.OpenPath
数据集描述
发布政策。根据Twitter和其他实体(包括LAION)的政策和规定,数据集中提供的所有信息都与数据的原始来源相关联。具体来说,从Twitter收集的数据以推文ID的形式发布;从LAION收集的数据以图像的URL形式发布。感兴趣的用户需要参考原始来源,了解其使用是否符合政策和规定。
Results
结果
Creating OpenPath from Twitter and other public sources
The USCAP and the Pathology Hashtag Ontology projects24 recommends 32 Twitter pathology subspecialty-specific hashtags18,19. We used these 32 hashtags to retrieve relevant tweets from 21 March 2006 (the date of the first Twitter post) to 15 November 2022 (Fig. 1a) to establish so far the largest public pathology dataset with natural language descriptions for each image: OpenPath. The detailed definition of each hashtag is presented in Extended Data Table 1. We followed the usage policy and guidelines from Twitter and other entities in retrieving the data. To ensure data quality, OpenPath followed rigorous protocols for cohort inclusion and exclusion, including the removal of retweets, sensitive tweets and non-pathology images, as well as additional text cleaning (Fig. 1a, Extended Data Fig. 1 and Methods). The final OpenPath dataset (Fig. 1b) consists of: (1) tweets: 116,504 image–text pairs from Twitter posts (tweets) across 32 pathology subspecialty-specific hashtags (Fig. 1c); (2) replies: 59,869 image–text pairs from the associated replies that received the highest number of likes in the tweet, if applicable (Fig. 1c); and (3) PathLAION: 32,041 additional image–text pairs scraped from the Internet and the LAION dataset. The captions in OpenPath used a median number of 17 words (Fig. 1d and Supplementary Table 1) to describe the medical conditions in the corresponding images. The detailed dataset extraction and description are elaborated further in the Methods, and the complete dataset of the inclusion–exclusion procedure is demonstrated in Extended Data Fig. 1.
美国病理学会(USCAP)和病理学标签本体论(Pathology Hashtag Ontology)项目推荐了32个Twitter病理学亚专业特定的标签。我们使用这32个标签从2006年3月21日(第一条Twitter帖子的日期)到2022年11月15日检索相关推文,建立迄今为止具有每个图像自然语言描述的最大公共病理学数据集:OpenPath。每个标签的详细定义见扩展数据表1。我们遵循了Twitter和其他实体的使用政策和指南来检索数据。为确保数据质量,OpenPath遵循了严格的入组和排除协议,包括删除转发、敏感推文和非病理学图像,以及进行额外的文本清理。最终的OpenPath数据集包括:(1)推文:来自32个病理学亚专业特定标签的Twitter帖子(推文)的116,504个图像-文本对;(2)回复:来自推文相关回复的59,869个图像-文本对,如果适用,则是获得最多喜欢的回复;(3)PathLAION:从互联网和LAION数据集中获取的32,041个额外的图像-文本对。OpenPath中的标题平均使用17个词来描述相应图像中的医学状况。详细的数据集提取和描述在方法中进一步阐述,包括入组排除过程的完整数据集在扩展数据图1中展示。
Figure
图
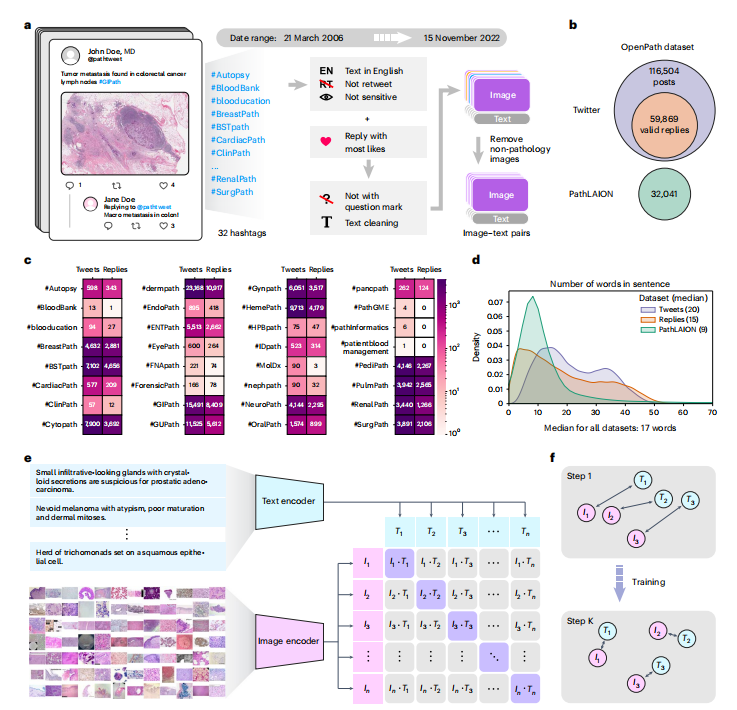
Fig. 1 | Overview of the study. a, Flowchart of data acquisition from medical Twitter. b, Overview of the OpenPath dataset. c, Total number of available image–text pairs from tweets and replies within each Twitter hashtag (sorted in alphabetical order). Replies are those that received the highest number of likes inTwitter posts, if applicable. d, Density plot of the number of words per sentence in the OpenPath dataset. e, The process of training the PLIP model with paired image–text dataset via contrastive learning. f, Graphical demonstration of the contrastive learning training process.
图1 | 研究概览。a,从医学Twitter获取数据的流程图。b,OpenPath数据集概述。c,每个Twitter标签中可用的推文和回复中图像-文本对的总数(按字母顺序排序)。回复是在Twitter帖子中获得最多喜欢的回复,如果适用。d,OpenPath数据集中每个句子的平均词数的密度图。e,使用对比学习通过成对的图像-文本数据集训练PLIP模型的过程。f,对比学习训练过程的图形演示。

Fig. 2 | PLIP predicts new classes via zero-shot transfer learning. a, Graphical illustration of zero-shot classification. The classification output is determined by selecting the candidate text with the highest cosine similarity to the input image. b, Four external validation datasets: Kather colon dataset with nine tissue types; PanNuke dataset (benign and malignant tissues); DigestPath dataset (benign and malignant tissues); and WSSS4LUAD dataset (tumor and normal tissues). c, Zero-shot performances with weighted F1 scores across the four datasets. Note that the performances in the Kather colon dataset are based on a nineclass zero-shot learning evaluation, while the performances for other datasets are based on binary zero-shot learning evaluation. Within each box plot, the center line represents the mean and the error bar indicates the 95% CI. Number of test samples for each dataset: Kather colon (n = 7,180); PanNuke (n = 1,888); DigestPath (n = 18,814); and WSSS4LUAD (n = 3,028). d, Confusion matrix of the Kather colon dataset. The actual and predicted labels are displayed in rows and columns, respectively. e, Zero-shot evaluation of the PanNuke dataset within each organ type.be searched. We compared each target image with all other images via the Recall@10 and Recall@50, which measures the number of images in the top 10 and top 50 retrieved that originate from the same Twitter post. The benchmark comparison was conducted by comparing PLIP with three baseline models: CLIP; MuDiPath; and SISH5 . The results presented in Fig. 5c suggested that all four models were capable of retrieving relevant images, while the PLIP model achieved the best performance with Recall@10 = 0.646 (compared to CLIP at 0.353,
图2 | PLIP通过零样本迁移学习预测新类别。a,零样本分类的图形说明。分类输出是通过选择与输入图像具有最高余弦相似度的候选文本来确定的。b,四个外部验证数据集:Kather结肠数据集(九种组织类型);PanNuke数据集(良性和恶性组织);DigestPath数据集(良性和恶性组织);以及WSSS4LUAD数据集(肿瘤和正常组织)。c,在四个数据集上通过加权F1分数进行的零样本性能评估。请注意,Kather结肠数据集中的性能是基于九类零样本学习评估,而其他数据集的性能则基于二分类零样本学习评估。在每个箱线图中,中心线表示均值,误差条表示95%的置信区间。每个数据集的测试样本数:Kather结肠(n = 7,180);PanNuke(n = 1,888);DigestPath(n = 18,814);和WSSS4LUAD(n = 3,028)。d,Kather结肠数据集的混淆矩阵。实际标签和预测标签分别显示在行和列中。e,在每个器官类型内对PanNuke数据集进行零样本评估。
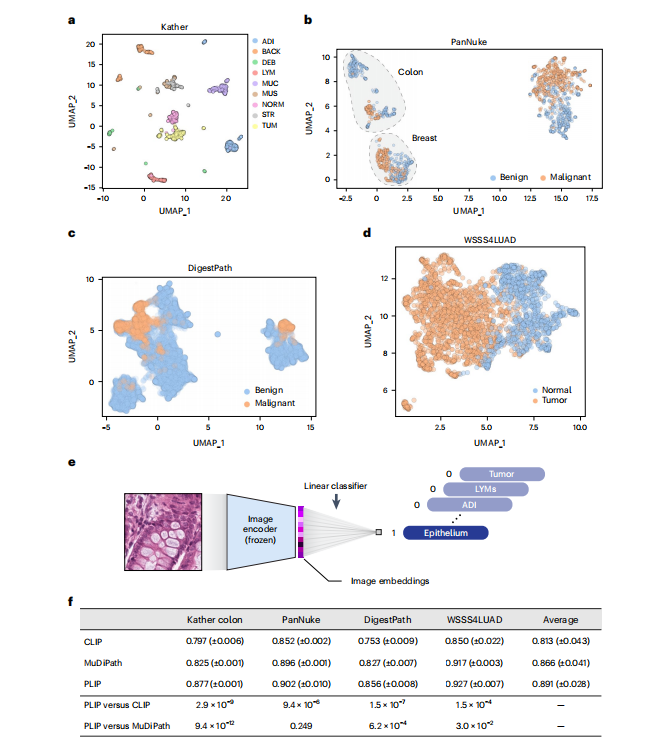
Fig. 3 | Image embedding analysis and linear probing results. a, Image embeddings generated from the PLIP model in the Kather colon dataset. b, Image embeddings generated from the PLIP model in the PanNuke dataset. c, Image embeddings generated from the PLIP model in the DigestPath dataset. *d, Image embeddings generated from the PLIP model in the WSSS4LUAD dataset. e, Graphical illustration of linear probing transfer learning. ‘Frozen’ means that the loss from the linear classifier will not be used to update the parameters of the image encoder. f**, F1 score in testing sets with the mean (± s.d.) from five repeated experiments with different random seeds. The ‘Average’ column shows the averaged performances across the four datasets. P values were calculated using a two-sided Student’s t-test and are presented in the bottom two rows.
图3 | 图像嵌入分析和线性探测结果。a,在Kather结肠数据集中由PLIP模型生成的图像嵌入。b,在PanNuke数据集中由PLIP模型生成的图像嵌入。c,在DigestPath数据集中由PLIP模型生成的图像嵌入。d,在WSSS4LUAD数据集中由PLIP模型生成的图像嵌入。e,线性探测迁移学习的图形说明。'Frozen'表示线性分类器的损失不会用于更新图像编码器的参数。f,在不同随机种子下进行的五次重复实验的测试集F1分数的均值(± 标准差)。'Average'列显示了四个数据集的平均性能。P值是使用双侧学生t检验计算的,并显示在底部两行中。

Fig. 4 | Text-to-image retrieval for pathology images. a, Graphical illustration of pathology image retrieval from text input. b, Density plot of the number of words per sentence across the four validation datasets. c, Description of the Twitter validation dataset and an example text caption. d, Descriptions of the PathPedia, PubMed and Books datasets and example text captions. e, Image retrieval performances across the validation datasets. f, Text-to-image retrieval performances for Recall@10 within each of the pathology subspecialty-specific hashtags. g**, Spearman correlations between the number of candidates and fold changes for Recall@10 when comparing the PLIP model with CLIP and random, respectively. Regression estimates are displayed with the 95% CIs in gray or purple.
图4 | 病理图像的文本到图像检索。a,从文本输入中检索病理图像的图形说明。b,在四个验证数据集中每个句子的平均词数的密度图。c,Twitter验证数据集的描述和一个示例文本标题。d,PathPedia、PubMed和Books数据集的描述以及示例文本标题。e,在验证数据集上的图像检索性能。f,在每个病理学亚专业特定标签内的Recall@10的文本到图像检索性能。g,当将PLIP模型与CLIP和随机模型进行比较时,候选数量和Recall@10的折叠变化之间的Spearman相关性。回归估计值用灰色或紫色显示,并显示95%的置信区间。

Fig. 5 | Image-to-image retrieval for pathology images. a, Graphical illustration of image-to-image retrieval. b, Illustration of image-to-image retrieval analysis on the Twitter validation dataset. c, Image-to-image retrieval performances on the Twitter validation dataset. The values in the boxes represent the Recall@10 and Recall@50 scores and the fold changes compared to random performances. d, Image-to-image retrieval performances on the Kather colon dataset. e, Imageto-image retrieval performances on the PanNuke dataset. f, Image-to-image retrieval performances on the KIMIA Path24C dataset. g, Examples of text-toimage retrieval. h, Examples of image-to-image retrieval (featuring the mitotic figure).
图5 | 病理图像的图像到图像检索。a,图像到图像检索的图形说明。b,在Twitter验证数据集上进行图像到图像检索分析的说明。c,Twitter验证数据集上的图像到图像检索性能。方框中的值表示Recall@10和Recall@50分数,以及与随机性能相比的折叠变化。d,Kather结肠数据集上的图像到图像检索性能。e,PanNuke数据集上的图像到图像检索性能。f,KIMIA Path24C数据集上的图像到图像检索性能。g,文本到图像检索的示例。h,图像到图像检索的示例(包括有丝分裂图)。