Applied Spatial Statistics(三)点模式分析 - 最近邻分析
点模式分析是一种用于识别数据集中的异常或异常模式的统计方法。在点模式分析中,最常用的一种分析方法是最近邻分析(Nearest Neighbor Analysis)。这种方法主要关注数据点之间的距离,通过比较数据点与其最近邻点的距离来识别异常值或异常模式。
最近邻分析的基本原理:
距离度量:首先,需要定义一个距离度量,如欧几里得距离、曼哈顿距离或闵可夫斯基距离等,来衡量数据点之间的距离。
距离计算:计算每个数据点到其他所有点的距离,并找出每个点的最近邻点。
距离分布:统计所有数据点到其最近邻点的距离,并分析这些距离的分布。
异常值识别:如果某个数据点到其最近邻点的距离显著大于其他点的平均距离,那么这个数据点可能被认为是异常的。
最近邻分析的应用:
异常检测:在许多领域,如金融欺诈检测、网络安全和医疗诊断中,最近邻分析被用来识别异常行为或异常事件。
聚类分析:最近邻分析也常用于聚类分析中,通过分析点之间的距离来确定数据点的相似性,从而将相似的数据点聚类在一起。
推荐系统:在推荐系统中,最近邻分析可以用来找到与用户兴趣相似的其他用户,从而提供个性化的推荐。
图像处理:在图像处理中,最近邻分析可以用于图像压缩、图像分割和特征提取等任务。
本笔记本将演示最近邻统计量的抽样分布,以及我们如何使用完全空间随机性来进行假设检验。
我们将使用一个名为“pointpats”的 python 包,它是 Python 空间分析库 (PySAL) 的子模块。
import pointpats
from pointpats import PoissonPointProcess, PoissonClusterPointProcess, Window, poly_from_bbox, PointPattern
import libpysal as ps
import matplotlib.pyplot as plt
import numpy as np
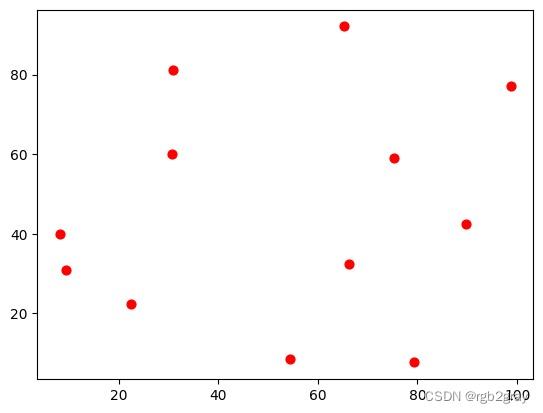
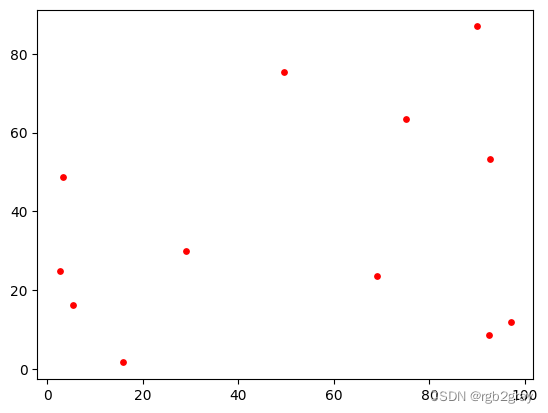
考虑这是我们观察到的事件及其位置。
observed = np.array([[66.22, 32.54], [22.52, 22.39], [31.01, 81.21],
          [9.47, 31.02],  [30.78, 60.10], [75.21, 58.93],
          [79.26,  7.68], [8.23, 39.93],  [98.73, 77.17],
          [89.78, 42.53], [65.19, 92.08], [54.46, 8.48]])
plt.scatter(observed[:,0],observed[:,1],s=40,color='red',)
<matplotlib.collections.PathCollection at 0x177f08450>
在“pointpats”中,您可以非常轻松地计算最近邻距离。 下面的结果与我们在幻灯片上的结果相同。 第一个元素是最近邻索引数组。 请注意,在 python 中,索引从零开始,因此与幻灯片上的索引相比,索引偏移了 1。 第二个元素是每个事件与其最近事件之间距离的数组。
pp = PointPattern(observed)
pp.knn()
(array([[ 9],
        [ 3],
        [ 4],
        [ 7],
        [ 2],
        [ 9],
        [11],
        [ 3],
        [ 5],
        [ 5],
        [ 5],
        [ 6]]),
 array([[25.59050019],
        [15.64542745],
        [21.11125292],
        [ 8.99587128],
        [21.11125292],
        [21.93729473],
        [24.81289987],
        [ 8.99587128],
        [29.76387072],
        [21.93729473],
        [34.63124168],
        [24.81289987]]))
我们可以计算平均最近邻距离:
observed_ann = pp.knn()[1].mean()
observed_ann
21.612139802089246
然后我们尝试模拟一些随机模式作为比较的基线。
首先我们创建一个窗口
ext_square = [(0,0), (0,100), (100,100), (100, 0)]
window_square = Window(ext_square)
然后我们按照泊松点过程生成随机点。
# n is the number of points
# sample is number of random patterns we generate, we just do 1 pattern.
samples = PoissonPointProcess(window_square, n=12, samples=1)

#get the coordinates from the PoissonPointProcess function.
pp_pcp = samples.realizations[0]
plt.scatter(pp_pcp[:,0],pp_pcp[:,1],s=15,color='red')
<matplotlib.collections.PathCollection at 0x291ee9710>
为每个随机模式计算 ANND
pp = PointPattern(pp_pcp)
pp.knn()
(array([[ 9],
        [ 9],
        [ 6],
        [10],
        [ 9],
        [ 6],
        [ 5],
        [ 6],
        [ 3],
        [ 1],
        [ 3],
        [ 1]]),
 array([[26.79532428],
        [ 9.11686077],
        [27.75869435],
        [ 5.62917903],
        [23.94820159],
        [20.25354371],
        [20.25354371],
        [28.34052548],
        [27.80993129],
        [ 9.11686077],
        [ 5.62917903],
        [17.91492018]]))
pp.knn()[1].mean()
18.547230348943653
接下来,还记得我们谈到的排列测试吗? 我们将生成随机模式,作为我们的零采样分布。 在这里,我们只是重复前面的步骤 1,000 次。
ann_list = []
np.random.seed(222)
for i in range(1000):

    samples = PoissonPointProcess(window_square, 12, 1)
    pp_pcp = samples.realizations[0]
    pp = PointPattern(pp_pcp)
    pp.knn()

    ann = pp.knn()[1].mean()
    print(ann)

    ann_list.append(pp.knn()[1].mean())
绘制 CSR 假设下 ANND 的抽样分布。
plt.hist(ann_list)
plt.axvline(observed_ann,color='red')
<matplotlib.lines.Line2D at 0x176cc0250>
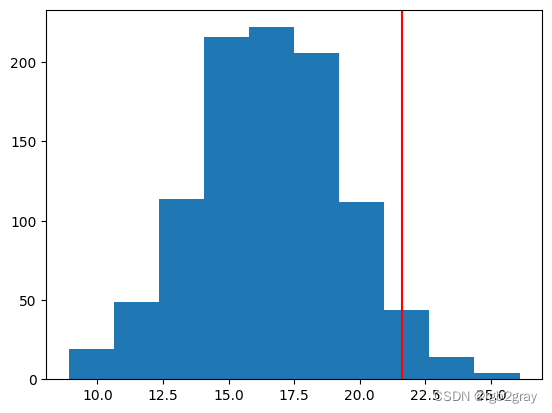
观察到ANND = 21.6,处于垂直线位置。
我们可以计算在 1,000 个随机模式中我们得到比观察到的 ANND 更极端的 ANND 值的次数。
p_sim = np.sum(ann_list >= observed_ann)/1000
p_sim
0.039
39 次,因此我们可以根据排列测试得到 p 值为 0.039。 然后你就可以得出你的结论了。 较大的 ANND 表示规则/分散,而较小的 ANND 表示簇状模式。
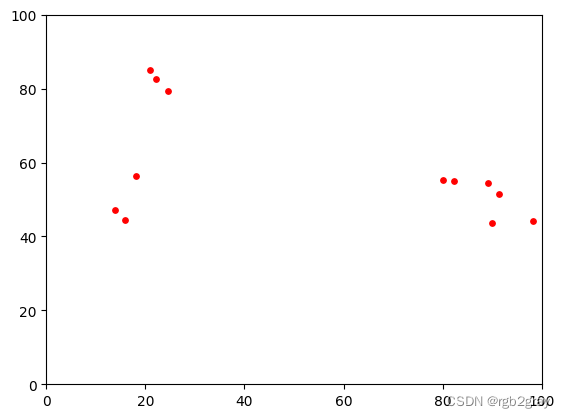
因此,让我们对聚类模式重复此操作。 我们可以使用名为“PoissonClusterPointProcess”的函数来生成一些假的聚类模式。 您可以更改多个参数以允许集群的数量(“parents”)和集群的大小(“radius”)。
help(PoissonClusterPointProcess)
Help on class PoissonClusterPointProcess in module pointpats.process:

class PoissonClusterPointProcess(PointProcess)
 |  PoissonClusterPointProcess(window, n, parents, radius, samples, keep=False, asPP=False, conditioning=False)
 |
 |  Poisson cluster point process (Neyman Scott).
 |  Two stages:
 |  1. parent CSR process: :math:`N`-conditioned or
 |  :math:`\lambda`-conditioned. If parent events follow a
 |  :math:`\lambda`-conditioned CSR process,
 |  the number of parent events varies across realizations.
 |  2. child process: fixed number of points in circle centered
 |  on each parent.
 |
 |  Parameters
 |  ----------
 |  window        : :py:class:`~.window.Window`
 |                  Bounding geometric object to contain point process
 |                  realizations.
 |  n             : int
 |                  Size of each realization.
 |  parents       : int
 |                  Number of parents.
 |  radius        : float
 |                  Radius of the circle centered on each parent.
 |  samples       : list
 |                  Number of realizations.
 |  asPP          : bool
 |                  Control the data type of value in the "realizations"
 |                  dictionary. If True, the data type is point
 |                  pattern as defined in pointpattern.py; if False,
 |                  the data type is an two-dimensional array.
 |  conditioning  : bool
 |                  If True, use the :math:`lambda`-conditioned CSR process
 |                  for parent events, leading to varied number of
 |                  parent events across realizations;
 |                  if False, use the :math:`N`-conditioned CSR process.
 |
 |  Attributes
 |  ----------
 |  children      : int
 |                  Number of childrens centered on each parent. Can
 |                  be considered as local intensity.
 |  num_parents   : dictionary
 |                  The key is the index of each realization. The
 |                  value is the number of parent events for each
 |                  realization.
 |  realizations  : dictionary
 |                  The key is the index of each realization, and the
 |                  value is simulated event points for each
 |                  realization. The data type of the value is
 |                  controlled by the parameter "asPP".
 |  parameters    : dictionary
 |                  Dictionary of a dictionary.
 |                  The key is the index of each realization, and the
 |                  value is a dictionary with the key 'n' and the
 |                  value always equal to the parameter n in the
 |                  case of
 |                  N-conditioned process.
 |                  For example, {0:{'n':100},1:{'n':100},2:{'n':100}}
 |                  2. randomly generated from a Possion process in
 |                  the case of lambda-conditioned process.
 |                  For example, {0:{'n':97},1:{'n':100},2:{'n':98}}
 |
 |  Examples
 |  --------
 |  >>> import libpysal as ps
 |  >>> import numpy as np
 |  >>> from pointpats import Window
 |  >>> from libpysal.cg import shapely_ext
 |
 |  Open the virginia polygon shapefile
 |
 |  >>> va = ps.io.open(ps.examples.get_path("virginia.shp"))
 |
 |  Create the exterior polygons for VA from the union of the county shapes
 |
 |  >>> polys = [shp for shp in va]
 |  >>> state = shapely_ext.cascaded_union(polys)
 |
 |  Create window from virginia state boundary
 |
 |  >>> window = Window(state.parts)
 |
 |  1. Simulate a Poisson cluster process of size 200 with 10 parents
 |  and 20 children within 0.5 units of each parent
 |  (parent events:  :math:`N`-conditioned CSR)
 |
 |  >>> np.random.seed(10)
 |  >>> samples1 = PoissonClusterPointProcess(window, 200, 10, 0.5, 1, asPP=True, conditioning=False)
 |  >>> samples1.parameters # number of events for the realization
 |  {0: {'n': 200}}
 |  >>> samples1.num_parents #number of parent events for each realization
 |  {0: 10}
 |  >>> samples1.children # number of children events centered on each parent event
 |  20
 |
 |  2. Simulate a Poisson cluster process of size 200 with 10 parents
 |  and 20 children within 0.5 units of each parent
 |  (parent events:  :math:`\lambda`-conditioned CSR)
 |
 |  >>> np.random.seed(10)
 |  >>> samples2 = PoissonClusterPointProcess(window, 200, 10, 0.5, 1, asPP=True, conditioning=True)
 |  >>> samples2.parameters # number of events for the realization might not be equal to 200
 |  {0: {'n': 260}}
 |  >>> samples2.num_parents #number of parent events for each realization
 |  {0: 13}
 |  >>> samples2.children # number of children events centered on each parent event
 |  20
 |
 |  Method resolution order:
 |      PoissonClusterPointProcess
 |      PointProcess
 |      builtins.object
 |
 |  Methods defined here:
 |
 |  __init__(self, window, n, parents, radius, samples, keep=False, asPP=False, conditioning=False)
 |      Initialize self.  See help(type(self)) for accurate signature.
 |
 |  realize(self, n)
 |      Generate n points which are distributed in a clustered
 |      fashion in the minimum bounding box of "window".
 |
 |      Parameters
 |      ----------
 |      n             : int
 |                      Number of point events.
 |
 |      Returns
 |      -------
 |      res           : array
 |                      (n,2), n point coordinates.
 |
 |  setup(self)
 |      Generate the number of events for each realization. If
 |      "conditioning" is False, all the event numbers are the same;
 |      if it is True, the number of parents is a random variable
 |      following a Poisson distribution, resulting in varied number
 |      of events.
 |
 |  ----------------------------------------------------------------------
 |  Methods inherited from PointProcess:
 |
 |  draw(self, parameter)
 |      Generate a series of point coordinates within the given window.
 |
 |      Parameters
 |      ----------
 |      parameter  : dictionary
 |                   Key: 'n'.
 |                   Value: size of the realization.
 |
 |      Returns
 |      -------
 |                 : array
 |                   A series of point coordinates.
 |
 |  ----------------------------------------------------------------------
 |  Data descriptors inherited from PointProcess:
 |
 |  __dict__
 |      dictionary for instance variables (if defined)
 |
 |  __weakref__
 |      list of weak references to the object (if defined)
np.random.seed(5)

cluster_samples = PoissonClusterPointProcess(window_square, n=12, parents=4, radius=10, samples=1)
cluster_pp_pcp = cluster_samples.realizations[0]
plt.scatter(cluster_pp_pcp[:,0],cluster_pp_pcp[:,1],s=15,color='red')

plt.xlim(0,100)
plt.ylim(0,100)
(0.0, 100.0)
cluster_pp = PointPattern(cluster_pp_pcp)
cluster_pp.knn()
plt.hist(ann_list)
plt.axvline(observed_ann,color='red')
<matplotlib.lines.Line2D at 0x292f3f350>
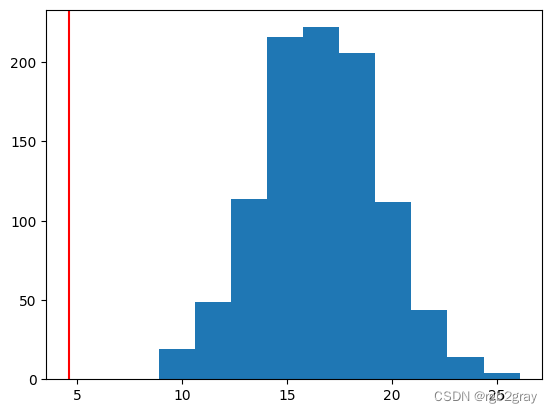
p_sim = np.sum(ann_list <= observed_ann)/1000
p_sim
0.0
在这种情况下,我们实际上有一个非常小的 p 值,我们观察到的 ANND 太小,以至于没有比我们的模拟中更极端的情况。