一,条形图
安装包
install.packages("vcd")绘制简单的条形图
barplot(c(1,2,4,5,6,3))
水平条形图
barplot(c(1,2,4,5,6,3),horiz = TRUE)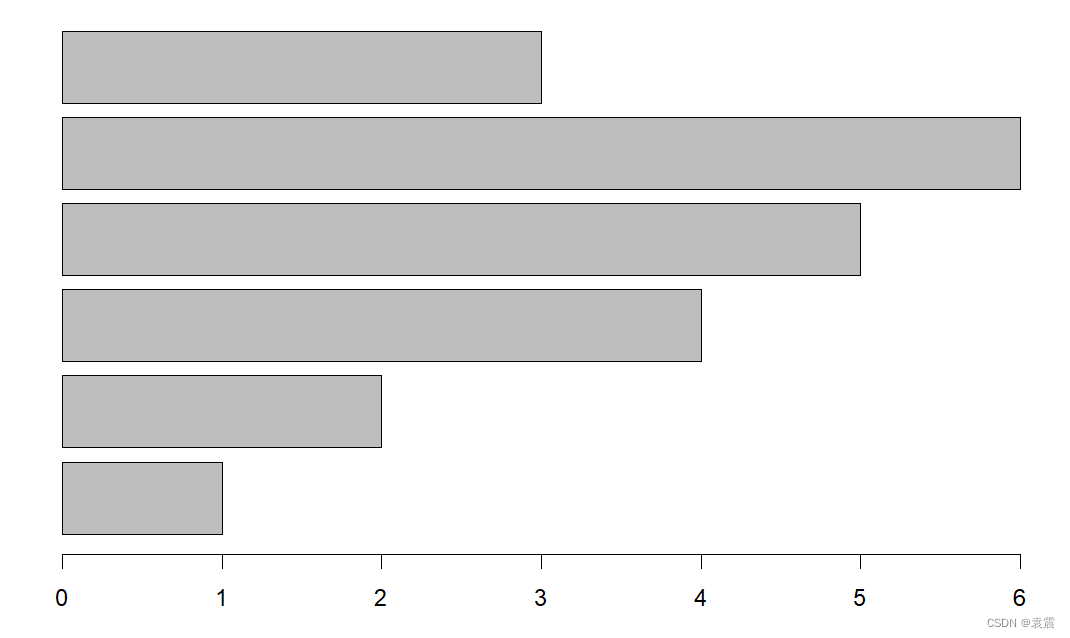
堆砌条形图
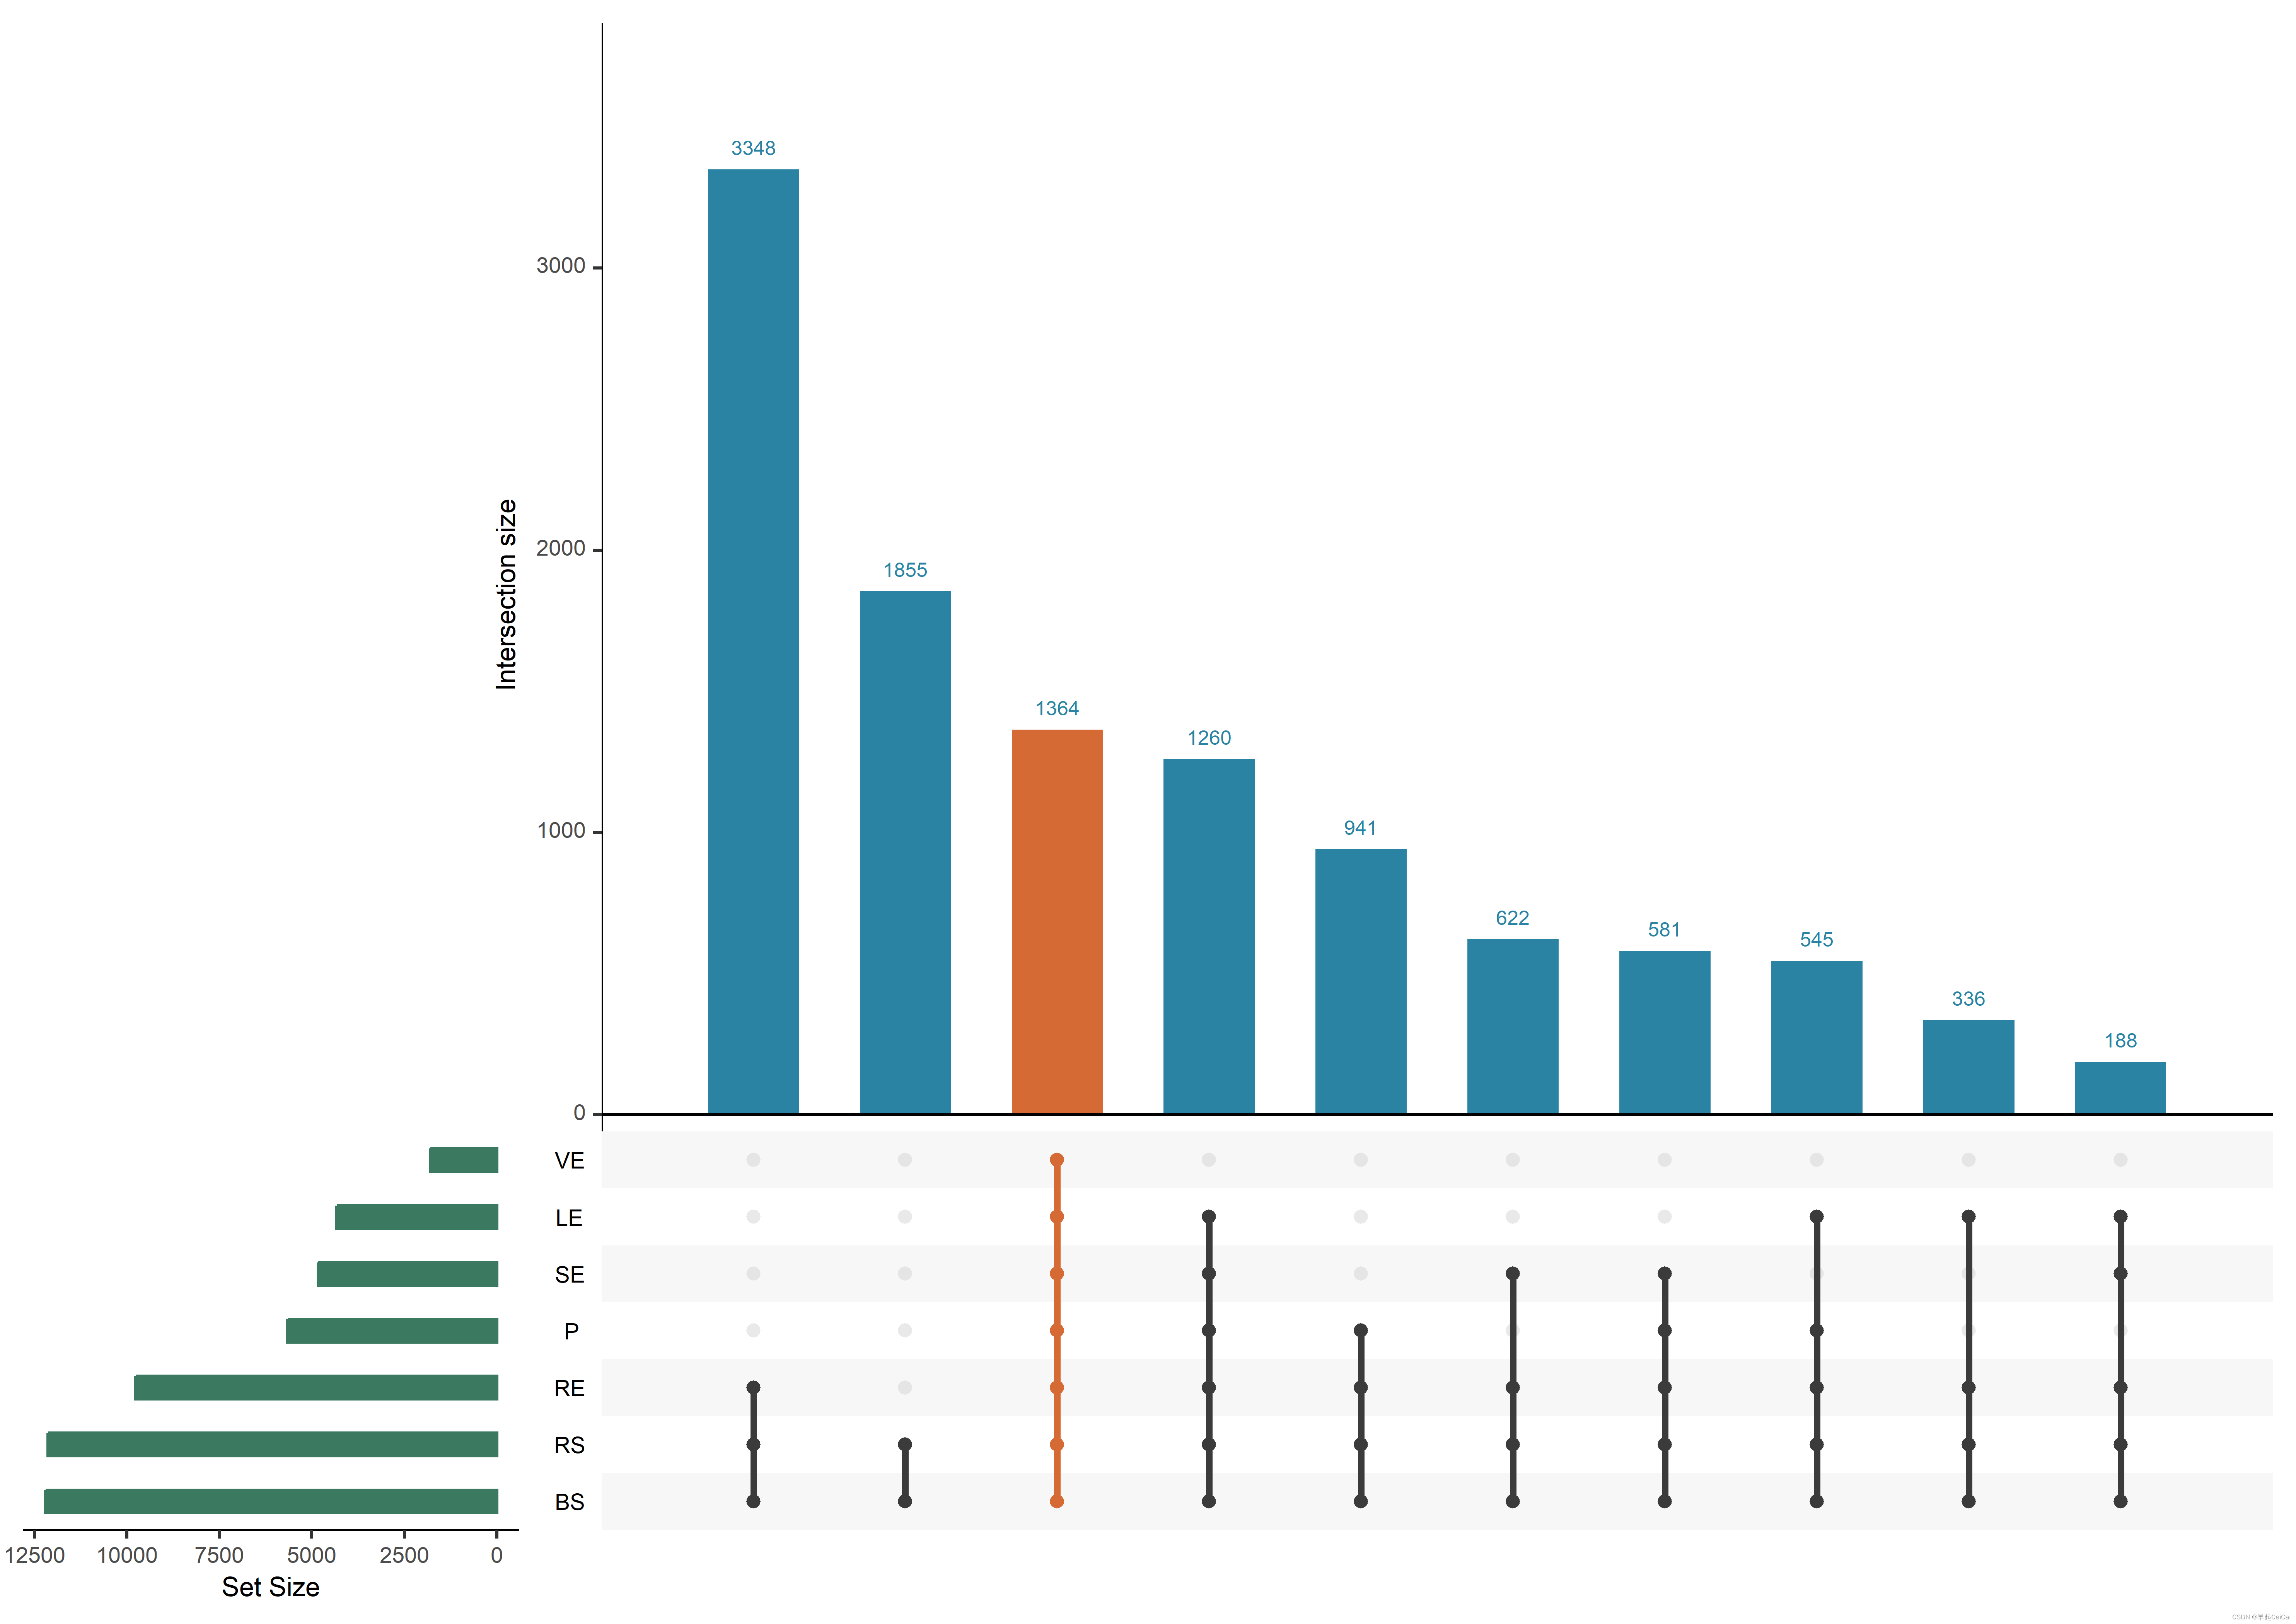
> d1<-c("Placebo","Treated")
> d2<-c("None","Some","Marked")

> c<-c(29,13,7,7,7,21)

> a<-matrix(c,nrow=3,ncol = 2,byrow = TRUE,dimnames = list(d2,d1))
> a
       Placebo Treated
None        29      13
Some         7       7
Marked       7      21
> barplot(a)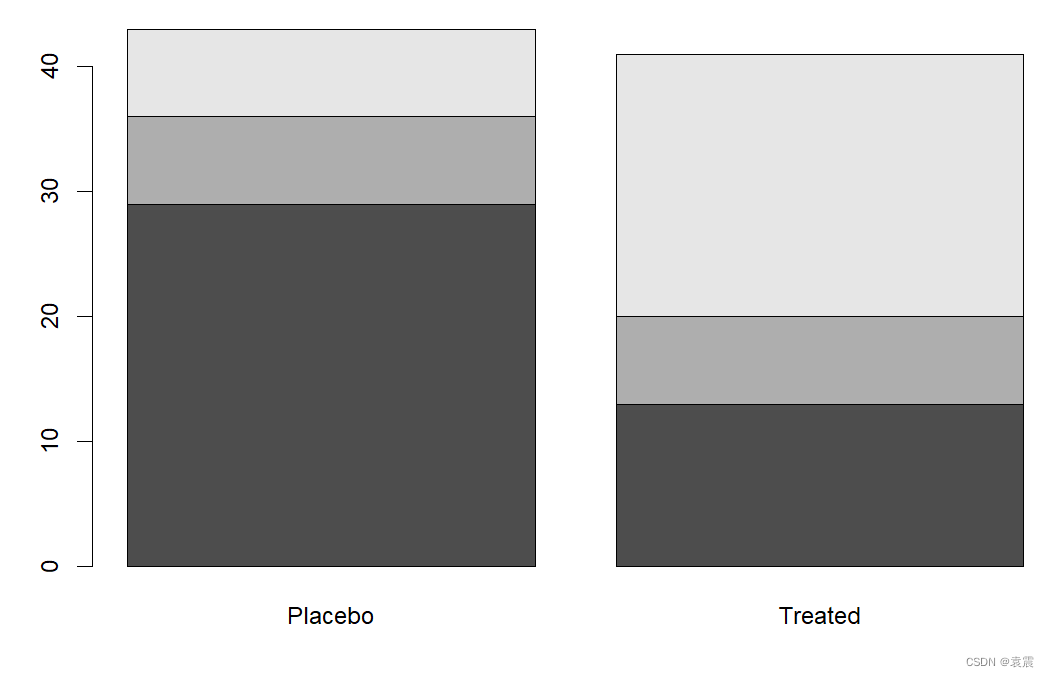
分组
barplot(a,beside = TRUE)
均值
> state.region
 [1] South         West          West          South         West          West          Northeast
 [8] South         South         South         West          West          North Central North Central
[15] North Central North Central South         South         Northeast     South         Northeast
[22] North Central North Central South         North Central West          North Central West
[29] Northeast     Northeast     West          Northeast     South         North Central North Central
[36] South         West          Northeast     Northeast     South         North Central South
[43] South         West          Northeast     South         West          South         North Central
[50] West
Levels: Northeast South North Central West
> state.x77
               Population Income Illiteracy Life Exp Murder HS Grad Frost   Area
Alabama              3615   3624        2.1    69.05   15.1    41.3    20  50708
Alaska                365   6315        1.5    69.31   11.3    66.7   152 566432
Arizona              2212   4530        1.8    70.55    7.8    58.1    15 113417
Arkansas             2110   3378        1.9    70.66   10.1    39.9    65  51945
California          21198   5114        1.1    71.71   10.3    62.6    20 156361
Colorado             2541   4884        0.7    72.06    6.8    63.9   166 103766
Connecticut          3100   5348        1.1    72.48    3.1    56.0   139   4862
Delaware              579   4809        0.9    70.06    6.2    54.6   103   1982
Florida              8277   4815        1.3    70.66   10.7    52.6    11  54090
Georgia              4931   4091        2.0    68.54   13.9    40.6    60  58073
Hawaii                868   4963        1.9    73.60    6.2    61.9     0   6425
Idaho                 813   4119        0.6    71.87    5.3    59.5   126  82677
Illinois            11197   5107        0.9    70.14   10.3    52.6   127  55748
Indiana              5313   4458        0.7    70.88    7.1    52.9   122  36097
Iowa                 2861   4628        0.5    72.56    2.3    59.0   140  55941
Kansas               2280   4669        0.6    72.58    4.5    59.9   114  81787
Kentucky             3387   3712        1.6    70.10   10.6    38.5    95  39650
Louisiana            3806   3545        2.8    68.76   13.2    42.2    12  44930
Maine                1058   3694        0.7    70.39    2.7    54.7   161  30920
Maryland             4122   5299        0.9    70.22    8.5    52.3   101   9891
Massachusetts        5814   4755        1.1    71.83    3.3    58.5   103   7826
Michigan             9111   4751        0.9    70.63   11.1    52.8   125  56817
Minnesota            3921   4675        0.6    72.96    2.3    57.6   160  79289
Mississippi          2341   3098        2.4    68.09   12.5    41.0    50  47296
Missouri             4767   4254        0.8    70.69    9.3    48.8   108  68995
Montana               746   4347        0.6    70.56    5.0    59.2   155 145587
Nebraska             1544   4508        0.6    72.60    2.9    59.3   139  76483
Nevada                590   5149        0.5    69.03   11.5    65.2   188 109889
New Hampshire         812   4281        0.7    71.23    3.3    57.6   174   9027
New Jersey           7333   5237        1.1    70.93    5.2    52.5   115   7521
New Mexico           1144   3601        2.2    70.32    9.7    55.2   120 121412
New York            18076   4903        1.4    70.55   10.9    52.7    82  47831
North Carolina       5441   3875        1.8    69.21   11.1    38.5    80  48798
North Dakota          637   5087        0.8    72.78    1.4    50.3   186  69273
Ohio                10735   4561        0.8    70.82    7.4    53.2   124  40975
Oklahoma             2715   3983        1.1    71.42    6.4    51.6    82  68782
Oregon               2284   4660        0.6    72.13    4.2    60.0    44  96184
Pennsylvania        11860   4449        1.0    70.43    6.1    50.2   126  44966
Rhode Island          931   4558        1.3    71.90    2.4    46.4   127   1049
South Carolina       2816   3635        2.3    67.96   11.6    37.8    65  30225
South Dakota          681   4167        0.5    72.08    1.7    53.3   172  75955
Tennessee            4173   3821        1.7    70.11   11.0    41.8    70  41328
Texas               12237   4188        2.2    70.90   12.2    47.4    35 262134
Utah                 1203   4022        0.6    72.90    4.5    67.3   137  82096
Vermont               472   3907        0.6    71.64    5.5    57.1   168   9267
Virginia             4981   4701        1.4    70.08    9.5    47.8    85  39780
Washington           3559   4864        0.6    71.72    4.3    63.5    32  66570
West Virginia        1799   3617        1.4    69.48    6.7    41.6   100  24070
Wisconsin            4589   4468        0.7    72.48    3.0    54.5   149  54464
Wyoming               376   4566        0.6    70.29    6.9    62.9   173  97203
> states<-data.frame(state.region,state.x77)
> states
                state.region Population Income Illiteracy Life.Exp Murder HS.Grad Frost   Area
Alabama                South       3615   3624        2.1    69.05   15.1    41.3    20  50708
Alaska                  West        365   6315        1.5    69.31   11.3    66.7   152 566432
Arizona                 West       2212   4530        1.8    70.55    7.8    58.1    15 113417
Arkansas               South       2110   3378        1.9    70.66   10.1    39.9    65  51945
California              West      21198   5114        1.1    71.71   10.3    62.6    20 156361
Colorado                West       2541   4884        0.7    72.06    6.8    63.9   166 103766
Connecticut        Northeast       3100   5348        1.1    72.48    3.1    56.0   139   4862
Delaware               South        579   4809        0.9    70.06    6.2    54.6   103   1982
Florida                South       8277   4815        1.3    70.66   10.7    52.6    11  54090
Georgia                South       4931   4091        2.0    68.54   13.9    40.6    60  58073
Hawaii                  West        868   4963        1.9    73.60    6.2    61.9     0   6425
Idaho                   West        813   4119        0.6    71.87    5.3    59.5   126  82677
Illinois       North Central      11197   5107        0.9    70.14   10.3    52.6   127  55748
Indiana        North Central       5313   4458        0.7    70.88    7.1    52.9   122  36097
Iowa           North Central       2861   4628        0.5    72.56    2.3    59.0   140  55941
Kansas         North Central       2280   4669        0.6    72.58    4.5    59.9   114  81787
Kentucky               South       3387   3712        1.6    70.10   10.6    38.5    95  39650
Louisiana              South       3806   3545        2.8    68.76   13.2    42.2    12  44930
Maine              Northeast       1058   3694        0.7    70.39    2.7    54.7   161  30920
Maryland               South       4122   5299        0.9    70.22    8.5    52.3   101   9891
Massachusetts      Northeast       5814   4755        1.1    71.83    3.3    58.5   103   7826
Michigan       North Central       9111   4751        0.9    70.63   11.1    52.8   125  56817
Minnesota      North Central       3921   4675        0.6    72.96    2.3    57.6   160  79289
Mississippi            South       2341   3098        2.4    68.09   12.5    41.0    50  47296
Missouri       North Central       4767   4254        0.8    70.69    9.3    48.8   108  68995
Montana                 West        746   4347        0.6    70.56    5.0    59.2   155 145587
Nebraska       North Central       1544   4508        0.6    72.60    2.9    59.3   139  76483
Nevada                  West        590   5149        0.5    69.03   11.5    65.2   188 109889
New Hampshire      Northeast        812   4281        0.7    71.23    3.3    57.6   174   9027
New Jersey         Northeast       7333   5237        1.1    70.93    5.2    52.5   115   7521
New Mexico              West       1144   3601        2.2    70.32    9.7    55.2   120 121412
New York           Northeast      18076   4903        1.4    70.55   10.9    52.7    82  47831
North Carolina         South       5441   3875        1.8    69.21   11.1    38.5    80  48798
North Dakota   North Central        637   5087        0.8    72.78    1.4    50.3   186  69273
Ohio           North Central      10735   4561        0.8    70.82    7.4    53.2   124  40975
Oklahoma               South       2715   3983        1.1    71.42    6.4    51.6    82  68782
Oregon                  West       2284   4660        0.6    72.13    4.2    60.0    44  96184
Pennsylvania       Northeast      11860   4449        1.0    70.43    6.1    50.2   126  44966
Rhode Island       Northeast        931   4558        1.3    71.90    2.4    46.4   127   1049
South Carolina         South       2816   3635        2.3    67.96   11.6    37.8    65  30225
South Dakota   North Central        681   4167        0.5    72.08    1.7    53.3   172  75955
Tennessee              South       4173   3821        1.7    70.11   11.0    41.8    70  41328
Texas                  South      12237   4188        2.2    70.90   12.2    47.4    35 262134
Utah                    West       1203   4022        0.6    72.90    4.5    67.3   137  82096
Vermont            Northeast        472   3907        0.6    71.64    5.5    57.1   168   9267
Virginia               South       4981   4701        1.4    70.08    9.5    47.8    85  39780
Washington              West       3559   4864        0.6    71.72    4.3    63.5    32  66570
West Virginia          South       1799   3617        1.4    69.48    6.7    41.6   100  24070
Wisconsin      North Central       4589   4468        0.7    72.48    3.0    54.5   149  54464
Wyoming                 West        376   4566        0.6    70.29    6.9    62.9   173  97203
> x<-aggregate(states$Illiteracy,by=list(state.region),FUN=mean)
> x
        Group.1        x
1     Northeast 1.000000
2         South 1.737500
3 North Central 0.700000
4          West 1.023077
> barplot(x$x,names.arg = x$Group.1)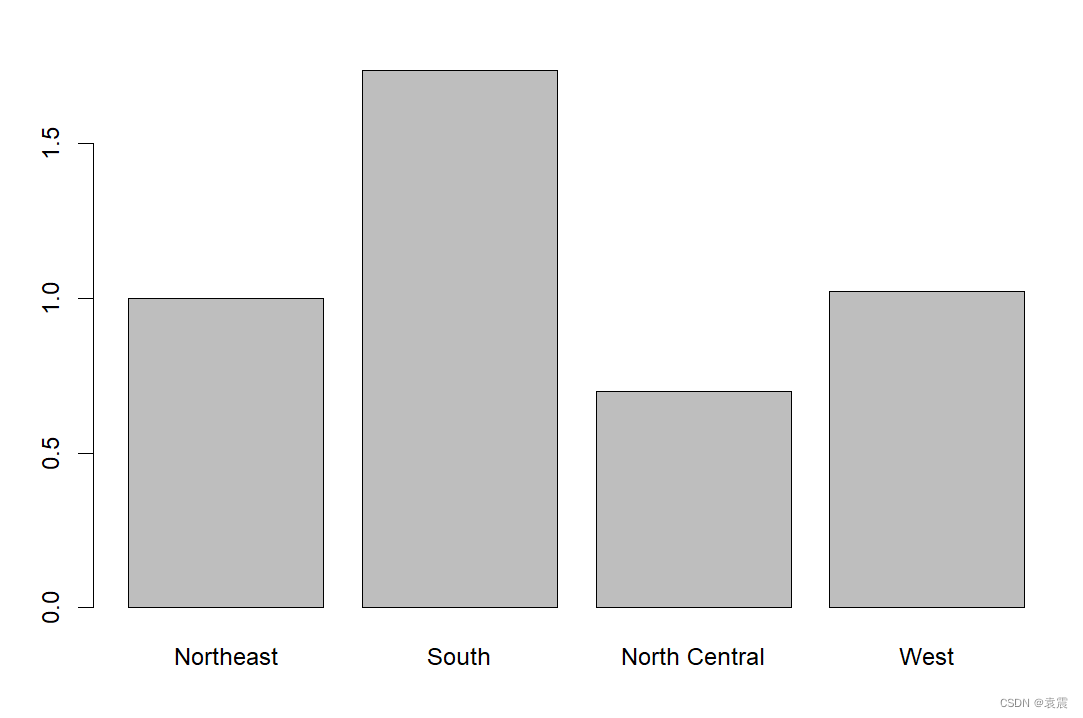
条形图的微调
 par(mar=c(5,8,4,2))

> a
       Placebo Treated
None        29      13
Some         7       7
Marked       7      21

> barplot(a,horiz = TRUE,cex.names = 0.8,names.arg = c("Noimproved","someimproved"))
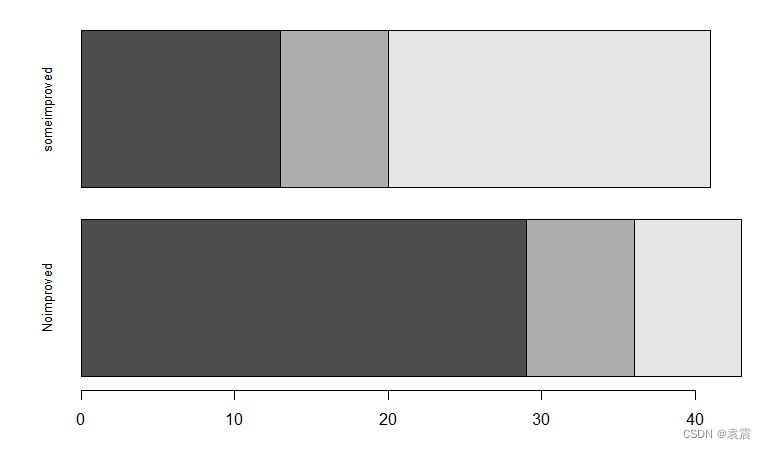
标签水平
> par(las=2)
> barplot(a,horiz = TRUE,cex.names = 0.8,names.arg = c("Noimproved","someimproved"))
二,饼图
绘制简单的饼图
> par(mfrow=c(2,2))
> x<-c(10,12,4,16,8)
> lab<-c("US","UK","AUS","GMY","FRC")
> pie(x,lab,main="袁震")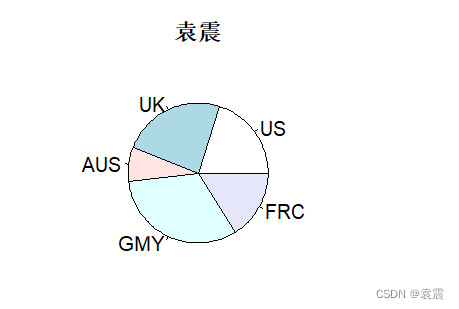
有百分比的饼图
> pct<-round(x/sum(x)*100)


> pct
[1] 18 22  7 29 15

> lab1<-paste(lab," ",pct,"%",seq=" ")
> lab1
[1] "US   18 %  "  "UK   22 %  "  "AUS   7 %  "  "GMY   29 %  " "FRC   15 %  "
> pie(x,lab1,col=rainbow(length(lab1)),main = "袁震2")
3D饼图
> library(plotrix)
> pie3D(x,explode = 0.1,main="袁震3")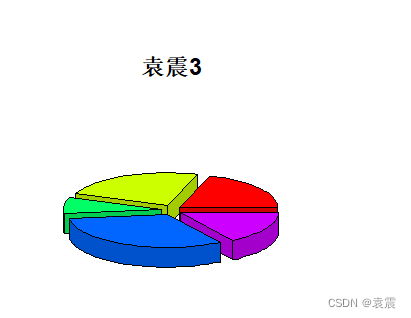
扇形
> fan.plot(x,labels = lab,main = "袁震4")
三,直方图
> x<-mtcars$mpg
> x
 [1] 21.0 21.0 22.8 21.4 18.7 18.1 14.3 24.4 22.8 19.2 17.8 16.4 17.3 15.2 10.4 10.4 14.7 32.4 30.4 33.9
[21] 21.5 15.5 15.2 13.3 19.2 27.3 26.0 30.4 15.8 19.7 15.0 21.4
> hist(x)
> hist(x)
> hist(x,breaks = 12,col = "red",xlab = "袁震") 
> hist(x,freq = FALSE,breaks = 12,col="green",xlab = "袁震")
> rug(jitter(x))
> lines(density(x),col="red",lwd=2)
四,核密度图
> x<-density(mtcars$mpg)
> mtcars$mpg
 [1] 21.0 21.0 22.8 21.4 18.7 18.1 14.3 24.4 22.8 19.2 17.8 16.4 17.3 15.2 10.4 10.4 14.7 32.4 30.4 33.9
[21] 21.5 15.5 15.2 13.3 19.2 27.3 26.0 30.4 15.8 19.7 15.0 21.4
> x

Call:
	density.default(x = mtcars$mpg)

Data: mtcars$mpg (32 obs.);	Bandwidth 'bw' = 2.477

       x               y
 Min.   : 2.97   Min.   :6.481e-05
 1st Qu.:12.56   1st Qu.:5.461e-03
 Median :22.15   Median :1.926e-02
 Mean   :22.15   Mean   :2.604e-02
 3rd Qu.:31.74   3rd Qu.:4.530e-02
 Max.   :41.33   Max.   :6.795e-02
> plot(x)
> library(sm)
Package 'sm', version 2.2-6.0: type help(sm) for summary information
> mpg
 [1] 21.0 21.0 22.8 21.4 18.7 18.1 14.3 24.4 22.8 19.2 17.8 16.4 17.3 15.2 10.4 10.4 14.7 32.4 30.4 33.9
[21] 21.5 15.5 15.2 13.3 19.2 27.3 26.0 30.4 15.8 19.7 15.0 21.4
> cyl
 [1] 6 6 4 6 8 6 8 4 4 6 6 8 8 8 8 8 8 4 4 4 4 8 8 8 8 4 4 4 8 6 8 4
> sm.density.compare(mpg,cyl,xlab="袁震")
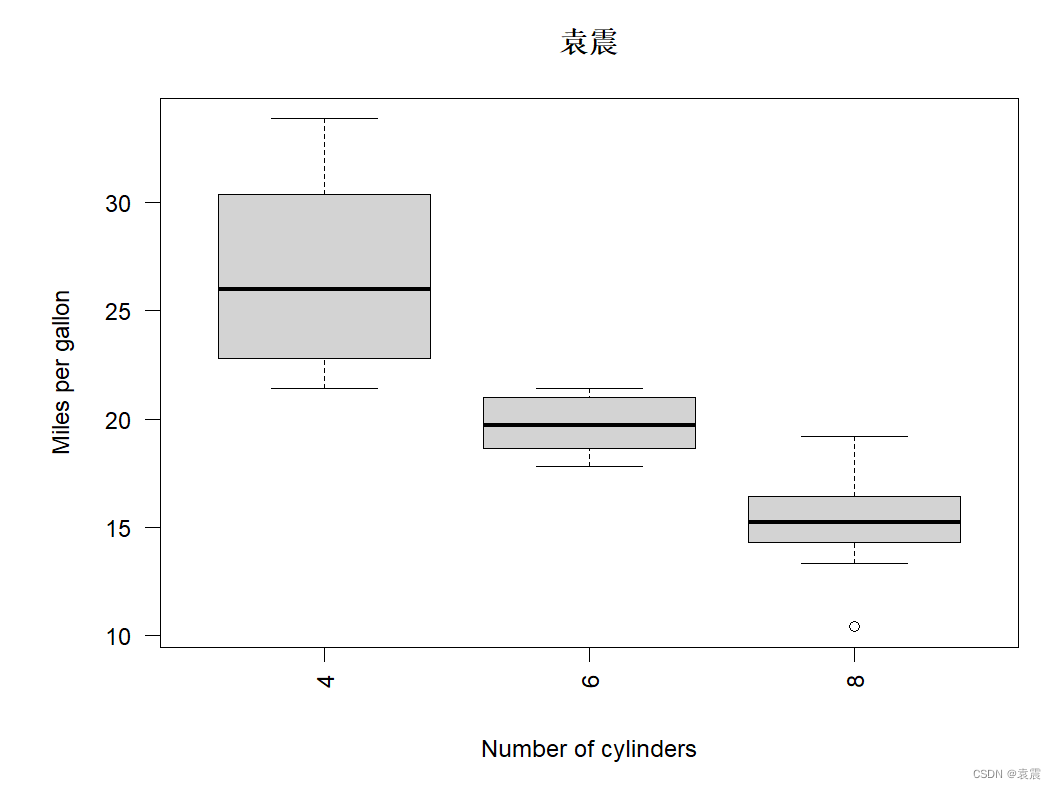
五,箱线图
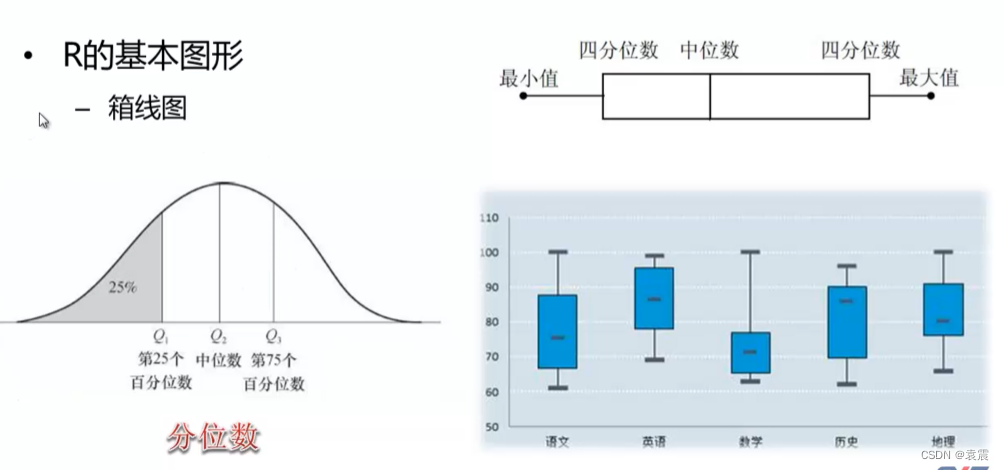
> boxplot(mtcars$mpg,main="袁震",ylab="Miles per gallon")
boxplot(mpg~cyl,data = mtcars,main="袁震",xlab = "Number of cylinders",ylab = "Miles per gallon")