一、渲染到页面的准备
1、设置渲染节点(这里使用了ref)
<div class="index" ref="lineStyle"></div>
2、寻找到节点并初始化
let ref = this.$refs.lineStyle;
this.myChart1 = echarts.init(ref);
3、尝试渲染
this.myChart1.setOption(option);
//option为渲染的柱状图的样式等设置
二、在option对象中设置具体渐变操作
const option = {
        // 颜色
        color: colorList, //存储颜色
}
1、设置一个数组存储渐变色(由深色到浅色渐变)并做相应操作
// 渐变色从深色到浅色
      let colors = [
        { color1: "#0F949B", color2: "#1bf3fe" },
        { color1: "#3279cd", color2: "#79b2f8" },
        { color1: "#4ab074", color2: "#90f9bb" }
      ];
      let colorList = []; //存储渐变完成后的颜色
      colors.forEach(item => {
        colorList.push(
          new echarts.graphic.LinearGradient(0, 0, 1, 0, [
            { offset: 0, color: item.color1 },
            { offset: 1, color: item.color2 }
          ])
        );
      });
2、渲染在页面上
this.obj.barData.forEach(item => {
        this.serData.push({
          name: item.name,
          type: "bar",
          stack: "all",
          color: item.color, //柱状图颜色
          barWidth: 20,
          data: item.data,
          showBackground: true,
          backgroundStyle: {
            color: "#134579"
          }
        });
      });
三、完整页面代码
<template>
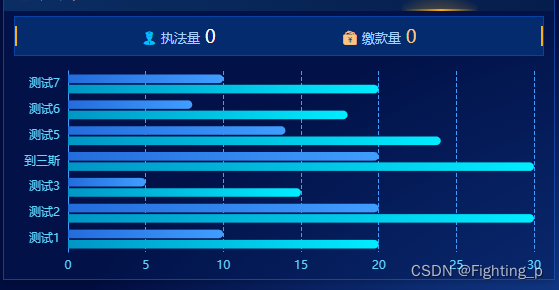
<!-- 不同房型收入对比 -->
<div class="index" ref="lineStyle"></div>
</template>
<script>
export default {
name: "index",
components: {},
props: {},
data() {
return {
obj: {
ydata: ["第一天", "第二天", "第三天"],
legend: ["双床房", "大床房", "商务房"],
barData: [
{
name: "双床房",
data: [7, 3, 9]
},
{
name: "大床房",
data: [4, 8, 6]
},
{
name: "商务房",
data: [5, 2, 2]
}
]
},
serData: [],
myChart1: ""
};
},
computed: {},
watch: {
data: {
handler() {
this.$nextTick(() => {
this.init();
});
},
deep: true
}
},
created() {},
mounted() {
this.init();
},
beforeDestroy() {},
methods: {
init() {
if (this.myChart1) this.myChart1.dispose();
let ref = this.$refs.lineStyle;
this.myChart1 = echarts.init(ref);
this.obj.barData.forEach(item => {
this.serData.push({
name: item.name,
type: "bar",
stack: "all",
color: item.color, //柱状图颜色
barWidth: 20,
data: item.data,
showBackground: true,
backgroundStyle: {
color: "#134579"
}
});
});
// 渐变色从深色到浅色
let colors = [
{ color1: "#0F949B", color2: "#1bf3fe" },
{ color1: "#3279cd", color2: "#79b2f8" },
{ color1: "#4ab074", color2: "#90f9bb" }
];
let colorList = []; //存储渐变完成后的颜色
colors.forEach(item => {
colorList.push(
new echarts.graphic.LinearGradient(0, 0, 1, 0, [
{ offset: 0, color: item.color1 },
{ offset: 1, color: item.color2 }
])
);
});
const option = {
// 颜色
color: colorList, //存储颜色
//图表选择栏
legend: {
icon: "circle",
top: "5%",
left: "center",
orient: "horizontal", //图例方向【horizontal/vertical】
itemHeight: 18, //修改icon图形大小
itemWidth: 18, //修改icon图形大小
selectedMode: false, //不允许点击图例
itemGap: 30,
textStyle: {
fontSize: 16,
color: "#fff"
},
data: this.obj.legend
},
//图标离容器的距离
grid: {
left: "10%",
right: "3%",
bottom: "10%",
top: "20%",
//是否包含坐标轴
containLabel: true
},
//x坐标轴
xAxis: [
{
type: "value",
axisTick: {
show: false
},
splitLine: {
show: true,
lineStyle: {
color: "rgba(255,255,255,.3"
}
},
boundaryGap: true,
axisLine: {
show: true,
lineStyle: {
// 属性lineStyle控制线条样式
color: "#5d85a0",
width: 1,
type: "solid"
}
},
axisLabel: {
color: "#fff",
fontSize: 16
}
}
],
//y坐标轴
yAxis: [
{
type: "category",
name: "",
data: this.obj.ydata,
splitLine: {
// show: false
},
inverse: true,
axisTick: {
show: false
},
axisLine: {
// show: true,
lineStyle: {
// 属性lineStyle控制线条样式
color: "#5d85a0",
width: 1,
type: "solid"
}
},
axisLabel: {
textStyle: {
color: "#fff",
fontSize: 16
}
}
}
],
// 数据展示区域
series: this.serData
};
console.log(option);
this.myChart1.setOption(option);
}
}
};
</script>
<style lang="less" scoped>
.index {
width: 467px;
height: 300px;
// background-color: #79b2f8;
}
</style>


![[Windows] Wireshark v3.6.1 【网络抓包工具】](https://img-blog.csdnimg.cn/img_convert/2a2ab0a1aa95527c01da1c4e71c0a0e4.png)