目录
一、实验
1.环境
(1)主机
表1 主机
| 系统 | 架构 | 版本 | IP | 备注 |
| Linux | openEuler | 22.03 LTS SP2 | 192.168.204.145(动态) 192.168.204.141(静态) 192.168.204.142(静态) |
|
| docker | 25.0.3 | |||
| cpolar (客户端) | 3.12 | 服务器端 3.22 |
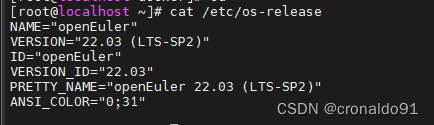
(2)查看系统版本
[root@localhost ~]# cat /etc/os-release
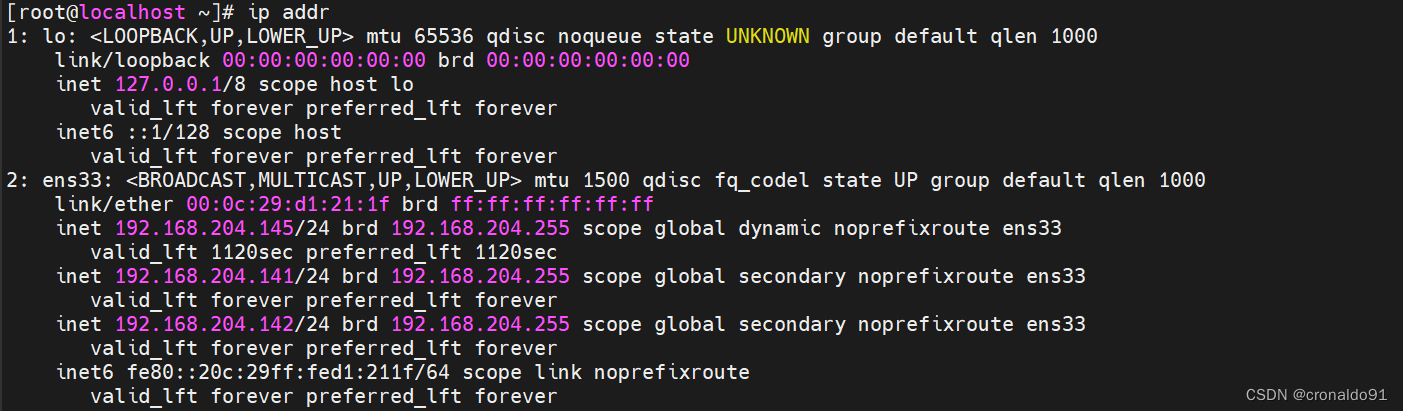
(3) 查看网络ip
[root@localhost ~]# ip addr
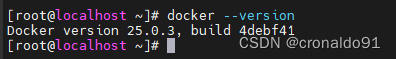
(4) 查看docker版本
[root@localhost ~]# docker --version
2.OpenEuler 部署 Prometheus
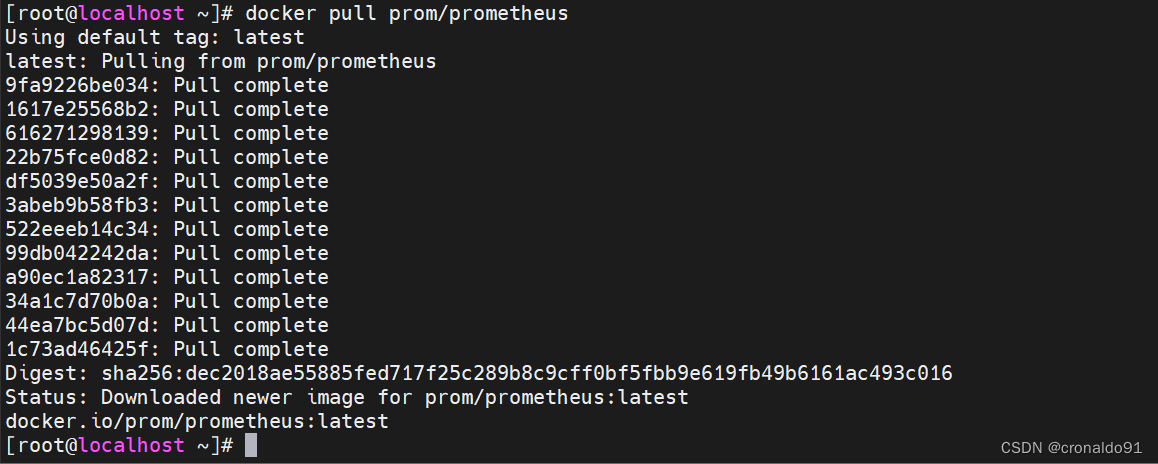
(1) 拉取Prometheus镜像
[root@localhost ~]# docker pull prom/prometheus
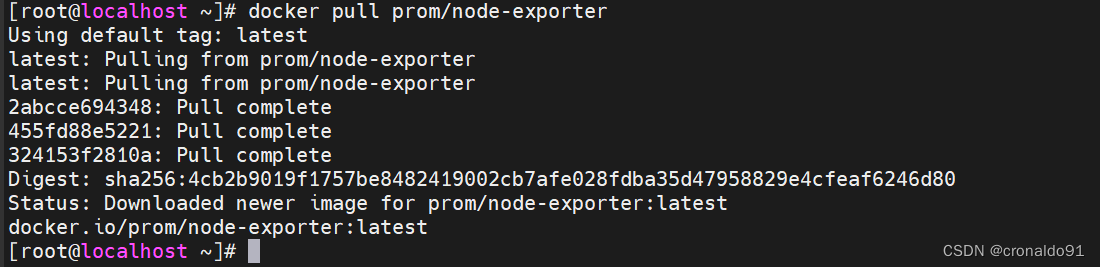
(2)拉取数据收集镜像
用于机器系统数据收集
[root@localhost ~]# docker pull prom/node-exporter
用于收集宿主机上的docker容器数据
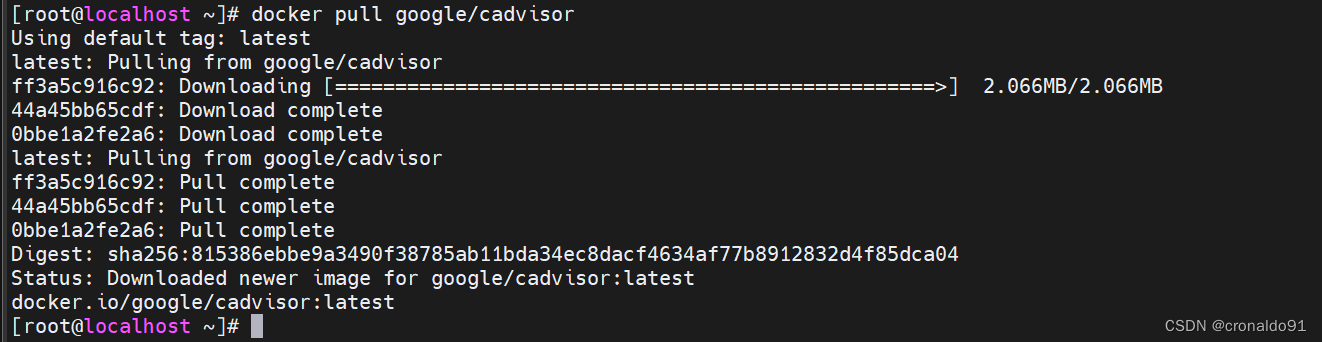
[root@localhost ~]# docker pull google/cadvisor
(3)创建node-exporter容器
[root@localhost ~]# docker run -d --name node-exporter --restart=always -p 9100:9100 -v "/proc:/host/proc:ro" -v "/sys:/host/sys:ro" -v "/:/rootfs:ro" prom/node-exporter

(4)监听端口
[root@localhost ~]# netstat -antlp | grep 9100

(5)访问
http://192.168.204.141:9100/metrics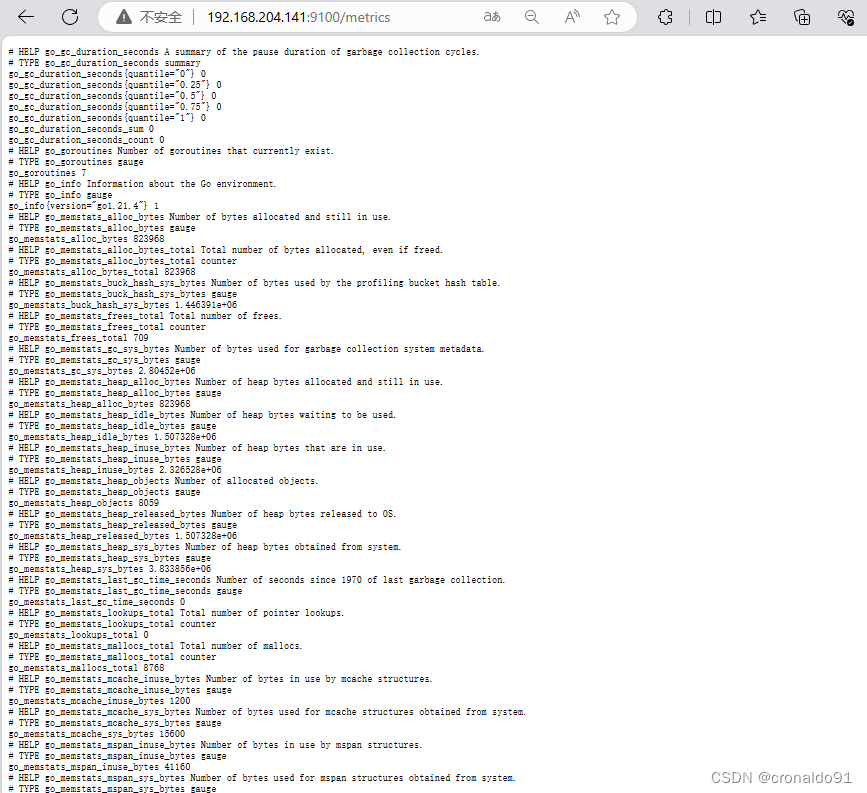
(6)创建cadvisor容器
[root@localhost ~]# docker run -v /:/rootfs:ro -v /var/run:/var/run:rw -v /sys:/sys:ro -v /var/lib/docker/:/var/lib/docker:ro -v /dev/disk/:/dev/disk:ro -p 8080:8080 -d --name=cadvisor --restart=always google/cadvisor:latest

(7) 监听端口
[root@localhost ~]# netstat -antlp | grep 8080

(8)访问
http://192.168.204.141:8080/metrics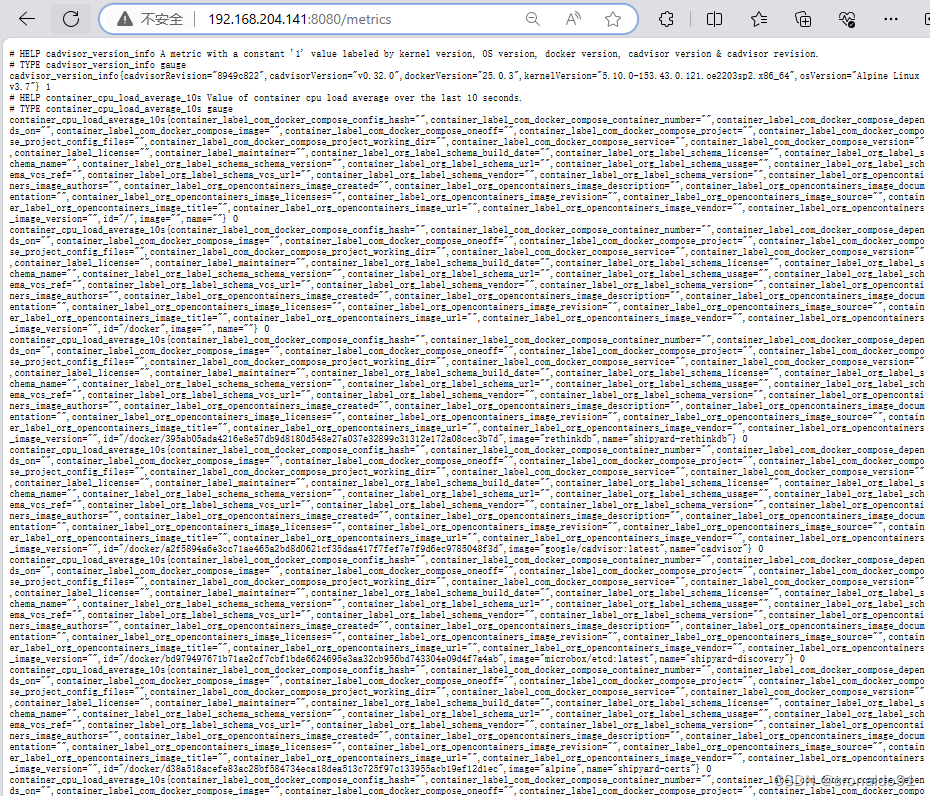
(9)创建配置文件
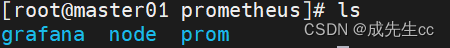
[root@localhost ~]# mkdir /opt/prometheus
[root@localhost ~]# cd /opt/prometheus/
[root@localhost prometheus]# vim prometheus.yml
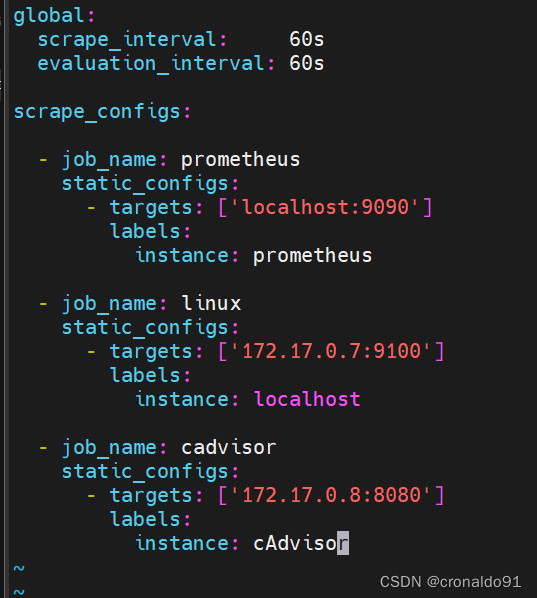
第一种方式:(容器地址)
global:
  scrape_interval:     60s
  evaluation_interval: 60s

scrape_configs:

  - job_name: prometheus
    static_configs:
      - targets: ['localhost:9090']
        labels:
          instance: prometheus

  - job_name: linux
    static_configs:
      - targets: ['172.17.0.7:9100']
        labels:
          instance: localhost

  - job_name: cadvisor
    static_configs:
      - targets: ['172.17.0.8:8080']
        labels:
          instance: cAdvisor
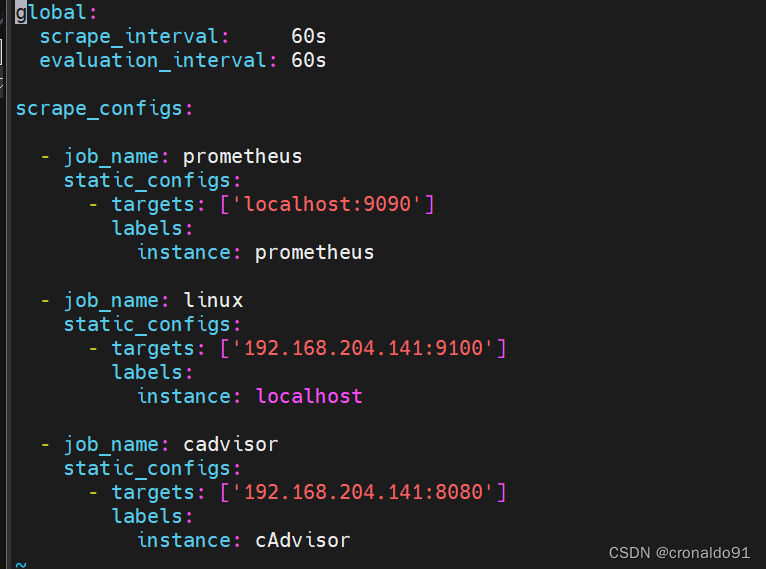
第二种方式:(宿主机地址)
global:
  scrape_interval:     60s
  evaluation_interval: 60s

scrape_configs:

  - job_name: prometheus
    static_configs:
      - targets: ['localhost:9090']
        labels:
          instance: prometheus

  - job_name: linux
    static_configs:
      - targets: ['192.168.204.141:9100']
        labels:
          instance: localhost

  - job_name: cadvisor
    static_configs:
      - targets: ['192.168.204.141:8080']
        labels:
          instance: cAdvisor
(10) 创建Prometheus容器
[root@localhost prometheus]# docker run -d --name prometheus --restart=always -p 9090:9090 -v /opt/prometheus/prometheus.yml:/etc/prometheus/prometheus.yml prom/prometheus

(11)监听端口
[root@localhost prometheus]# netstat -antlp | grep 9090

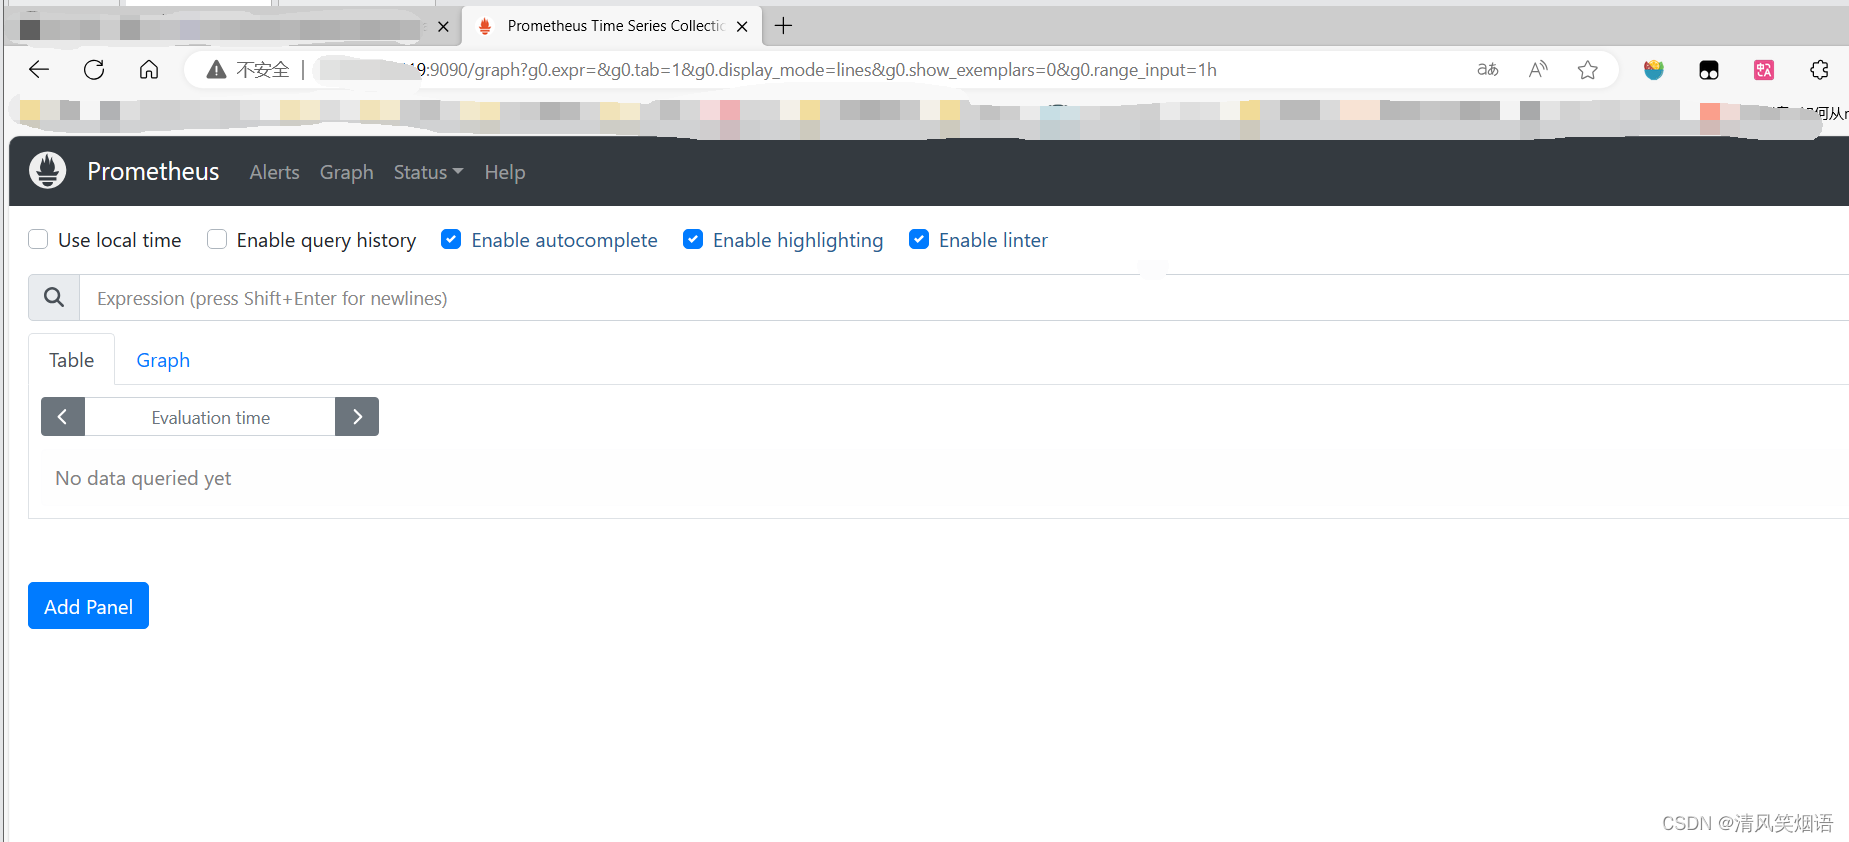
(12)访问
http://192.168.204.141:9090/graph
访问targets(第一种方式的宿主机地址)
http://192.168.204.141:9090/targets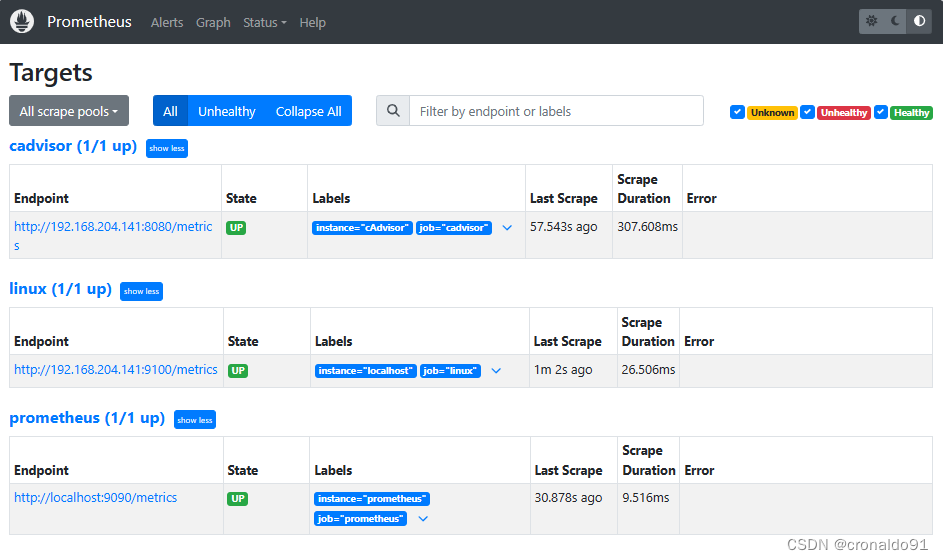
访问targets(第二种方式的容器地址)
http://192.168.204.141:9090/targets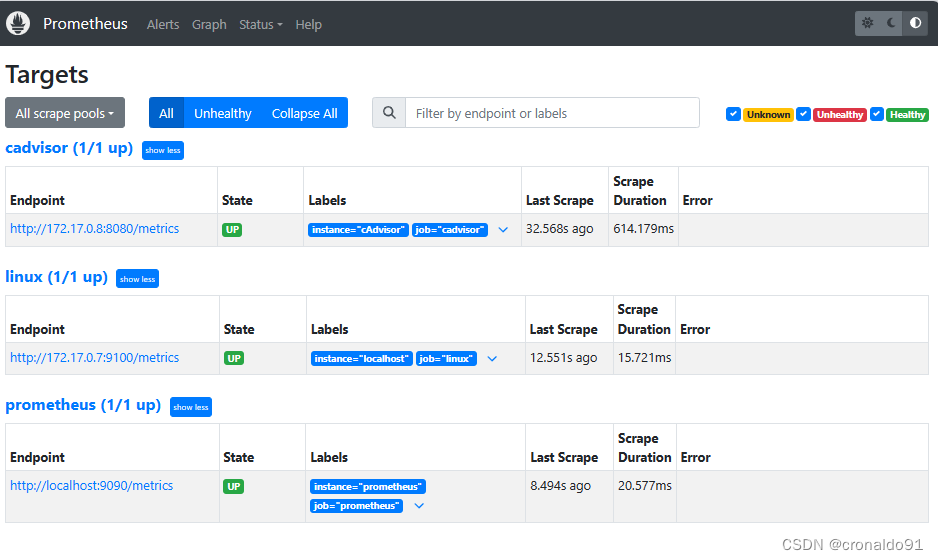
3.OpenEuler 部署 Grafana
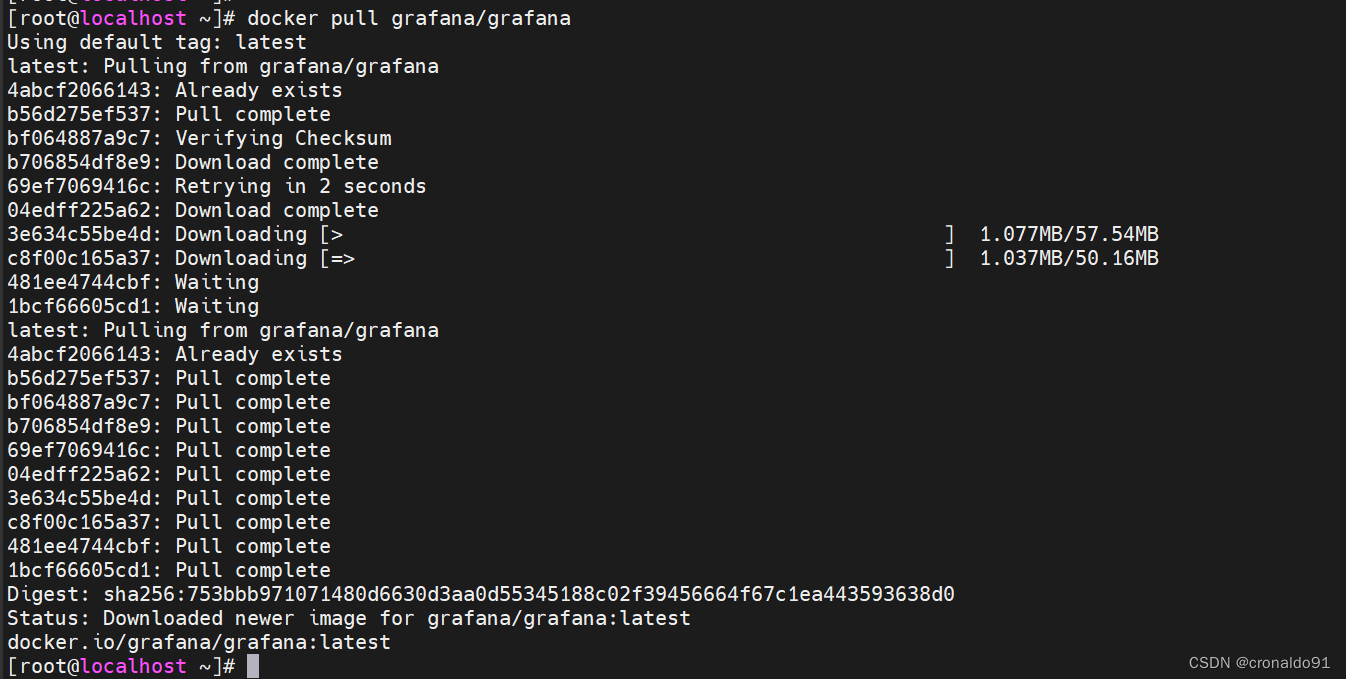
(1)拉取Grafana镜像
[root@localhost ~]# docker pull grafana/grafana
(2)创建目录
授权
[root@localhost ~]# mkdir /opt/grafana-storage
[root@localhost ~]# chmod 777 -R /opt/grafana-storage
(3)创建Grafana容器
[root@localhost ~]# docker run -d --name grafana --restart=always -p 3000:3000 --name=grafana -v /opt/grafana-storage:/var/lib/grafana grafana/grafana

(4)监听端口
[root@localhost ~]# netstat -antlp | grep 3000

(5)访问
http://192.168.204.141:3000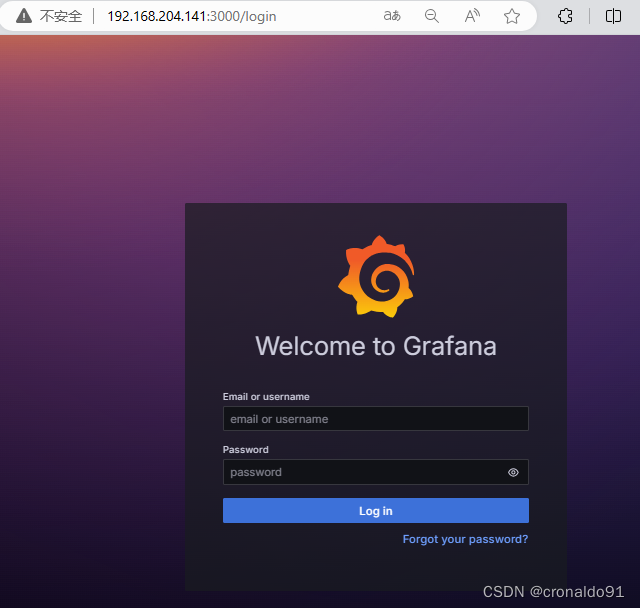
(6)登录
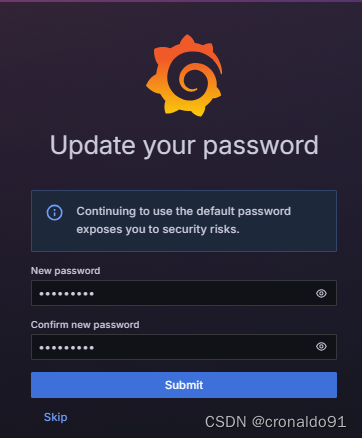
默认的用户名和密码都是admin

设置新密码
跳转首页
(7)添加数据源

弹出页面
 选择Prometheus
输入URL

保存并测试


(8)查看Grafana监控模板的官网
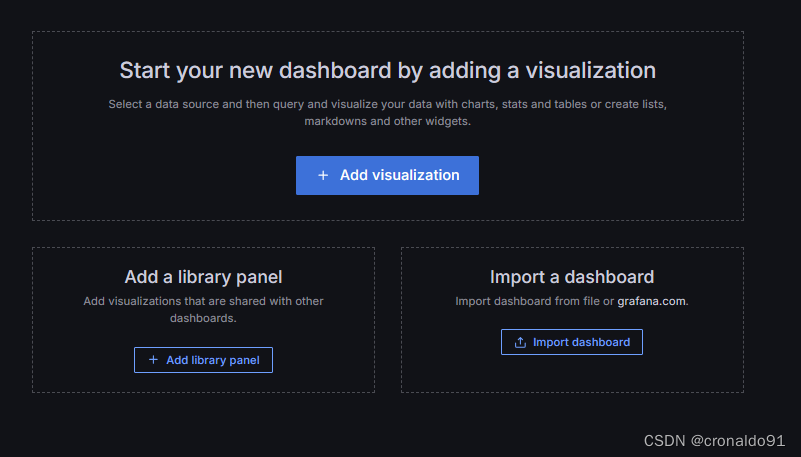
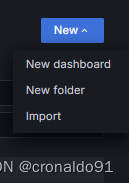
https://grafana.com/grafana/dashboards/(9)导入Grafana监控模板(主机)
选择

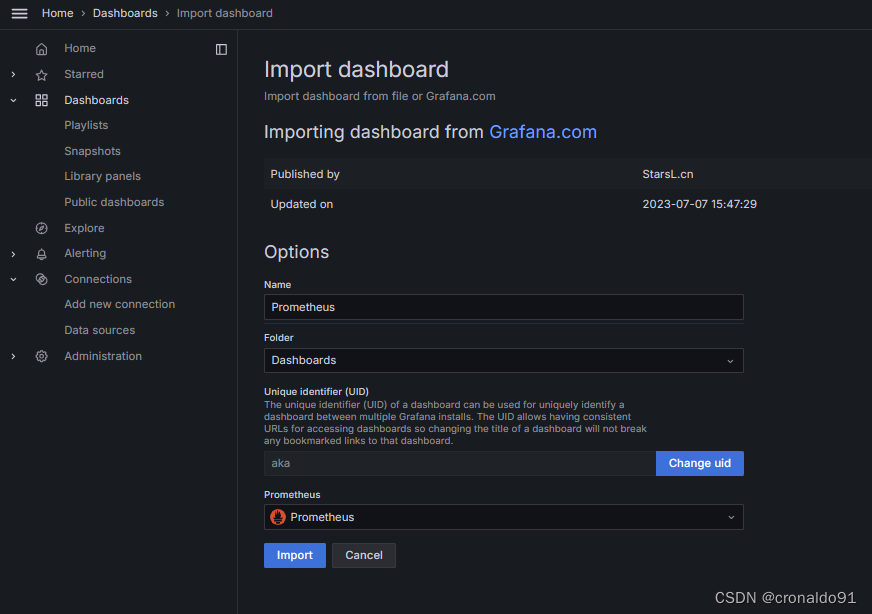
弹出页面
导入
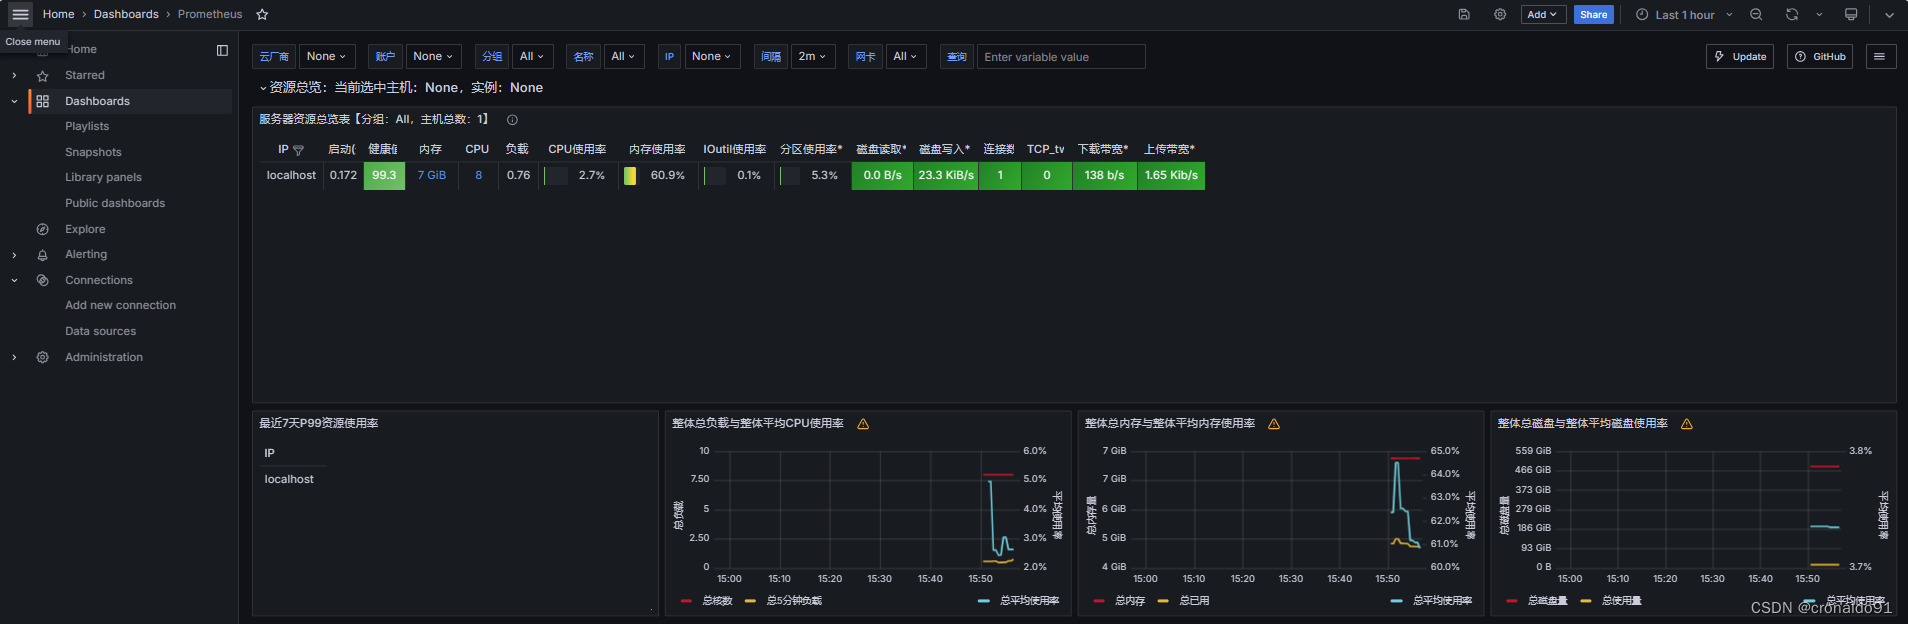
导入主机的监控模板,模板id为8919

修改
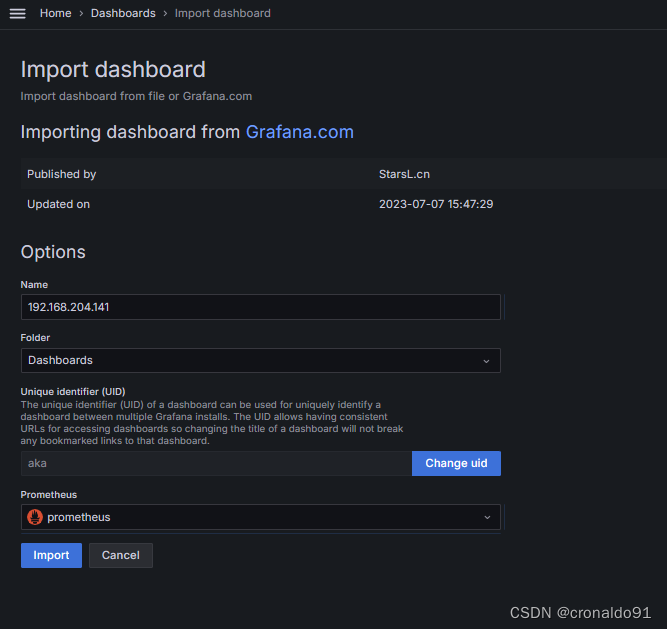
完成

4.使用cpolar内网穿透
(1)固定二级子域名地址
登录cpolar官网,点击左侧的预留,找到保留二级子域名,为远程服务器连接保留一个固定二级子域名地址
https://dashboard.cpolar.com/get-started
(2)创建隧道
域名类型:选择二级子域名

预留的http地址:复制粘贴官网保留成功的地址,Prometheus

地区选择:China VIP
(3) 查看隧道列表

(4)查看在线隧道列表
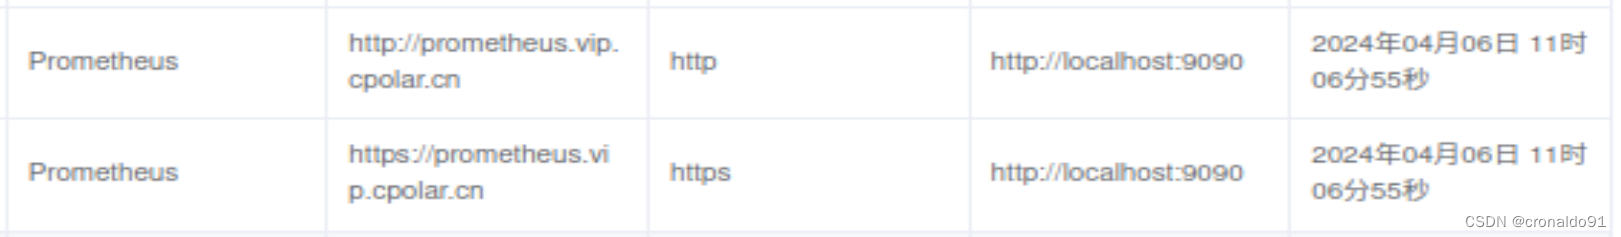
(5)二级子域名地址访问
http://prometheus.vip.cpolar.cn/graph
http://prometheus.vip.cpolar.cn/targets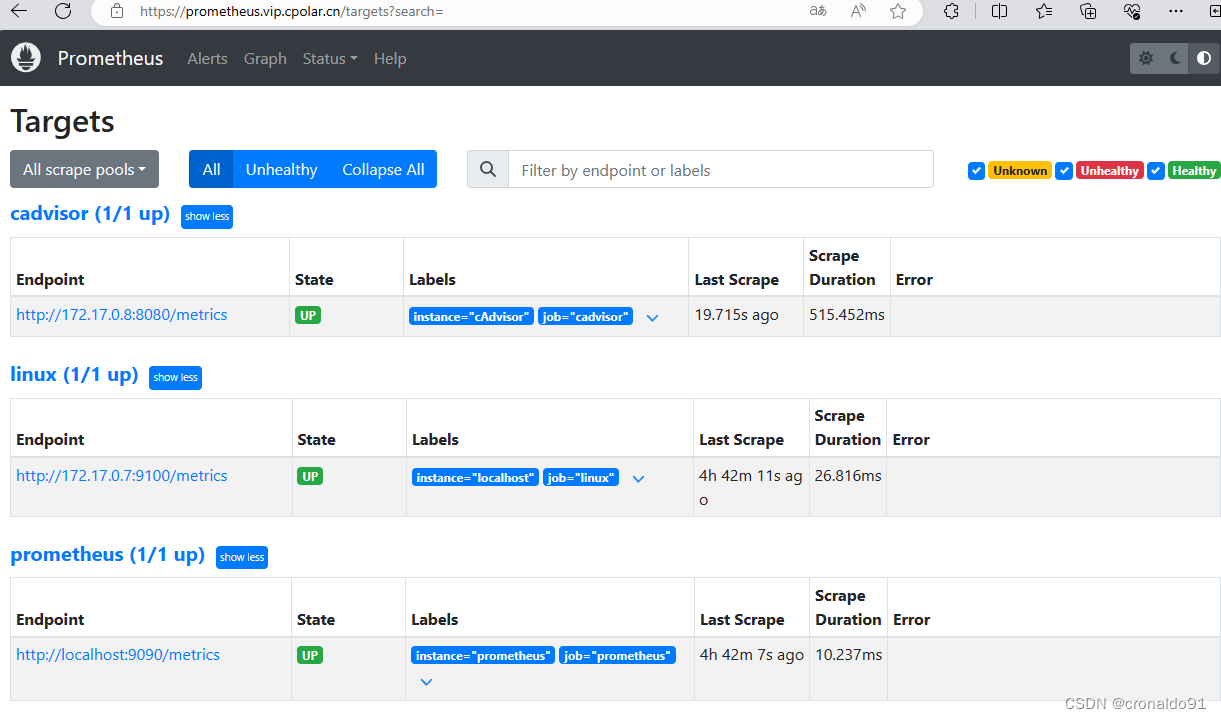
(6) Grafana添加数据源
http://prometheus.vip.cpolar.cn
保存并测试


导入
(7)导入主机的监控模板
模板id为8919
完成
二、问题
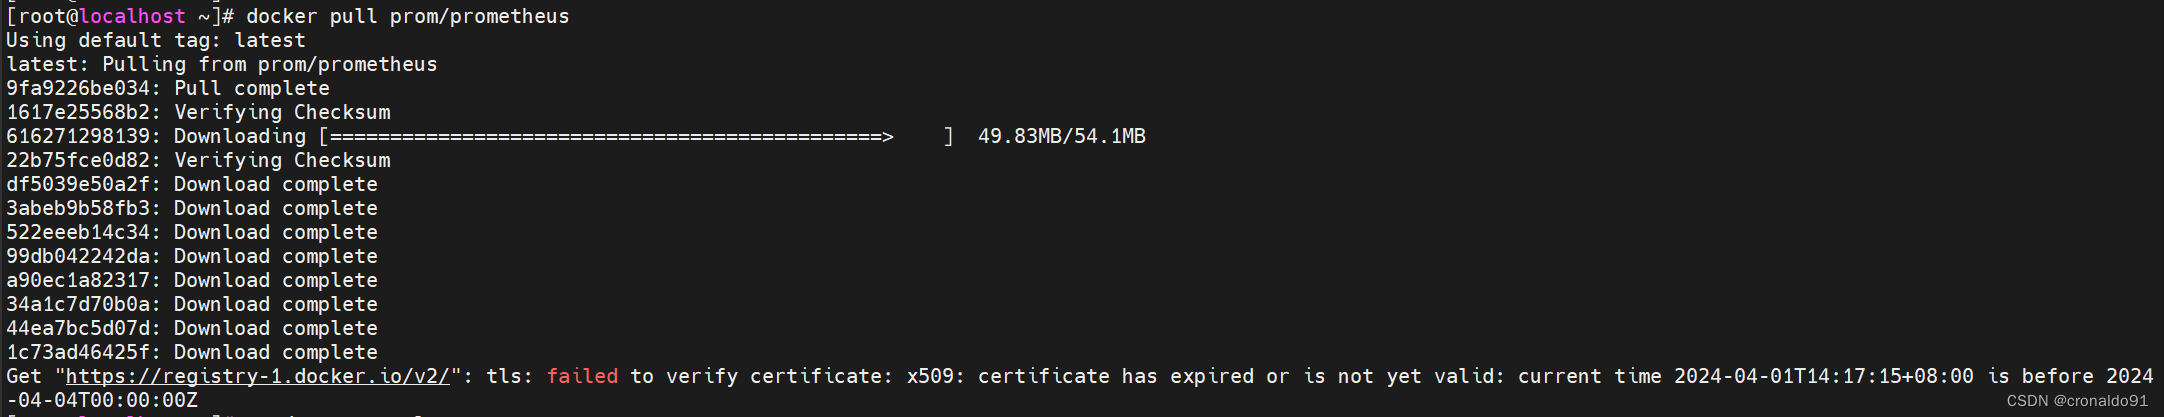
1.拉取镜像失败
(1)报错
Get "https://registry-1.docker.io/v2/": tls: failed to verify certificate: x509: certificate has expired or is not yet valid: current time 2024-04-01T14:17:15+08:00 is before 2024-04-04T00:00:00Z
(2)原因分析
时间未同步。
(3)解决方法
同步时间:
[root@localhost ~]# ntpdate cn.pool.ntp.org

成功:

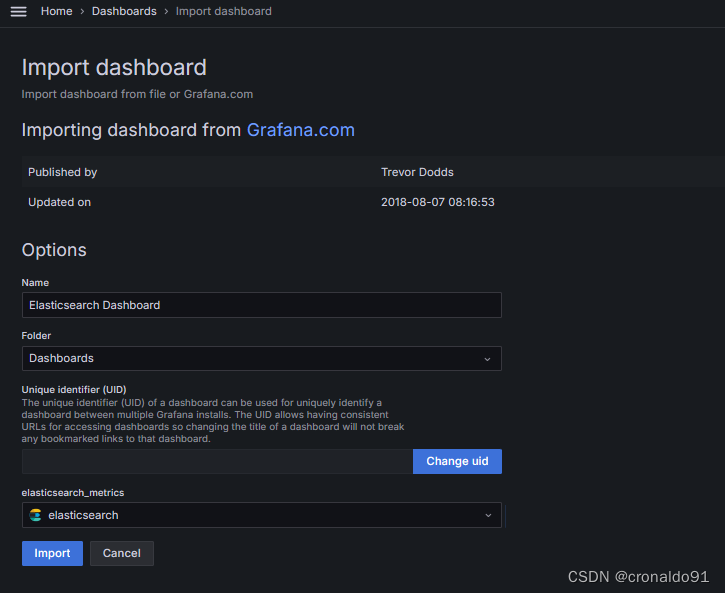
2.如何导入Grafana监控模板(ES)
添加数据源

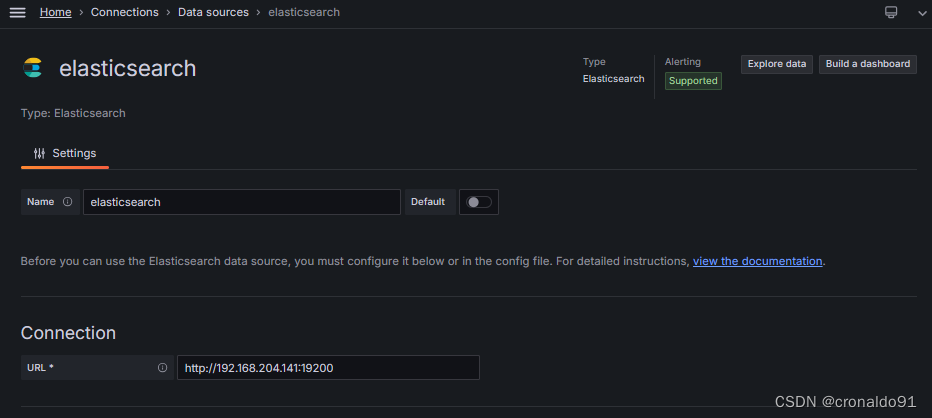
保存并测试


导入

导入ES的监控模板,模板id为878

修改