需要集中的日志系统的原因
目前现状,每个服务生产上有三台,定位生产问题,需要连上一台机器,然后使用 cd / tail / less / grep / sed / awk 等 linux命令去日志里查找故障原因。如果在这台机器没搜索到线索,就去另外两台机器上查日志。
但在分布式系统中,众多服务分散部署在数十台甚至上百台不同的服务器上,想要快速方便的实现查找、分析和归档等功能,使用Linux命令等传统的方式查询到想要的日志就费事费力,更不要说对日志进行分析与归纳了。
为解决大量日志归档,文件搜索慢,如何多维度查询就得需要集中化日志管理,将所有服务器上的日志收集汇总,常见的解决思路就是建立集中式日志收集系统。
LPG
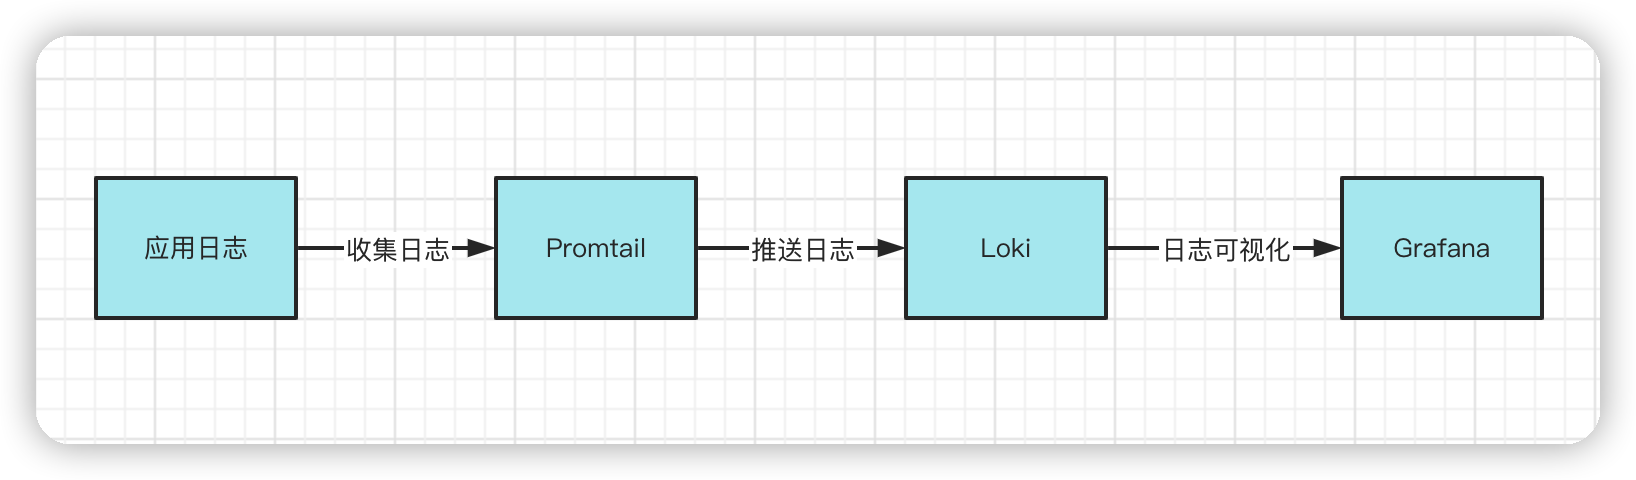
Loki + Promtail + GRafana
- Loki:聚合并存储日志数据,可以作为Grafana的数据源,为Grafana提供可视化数据
- Promtail:日志收集器,有点像Filebeat,可以手机日志文件中的日志,并把收集到的数据推送到Loki。
- Grafana:从Loki中获取日志信息,进行可视化展示
Loki是 Grafana Labs 团队最新的开源项目,是一个水平可扩展,高可用,多租户的日志聚合系统。它的设计非常经济高效且易于操作,因为它不会为日志内容编制索引,而是为每个日志流编制一组标签,专门为 Prometheus和Kubernetes用户做了相关优化。
该项目受Prometheus启发,官方的介绍就是:Like Prometheus,But For Logs。类似Prometheus的日志系统。
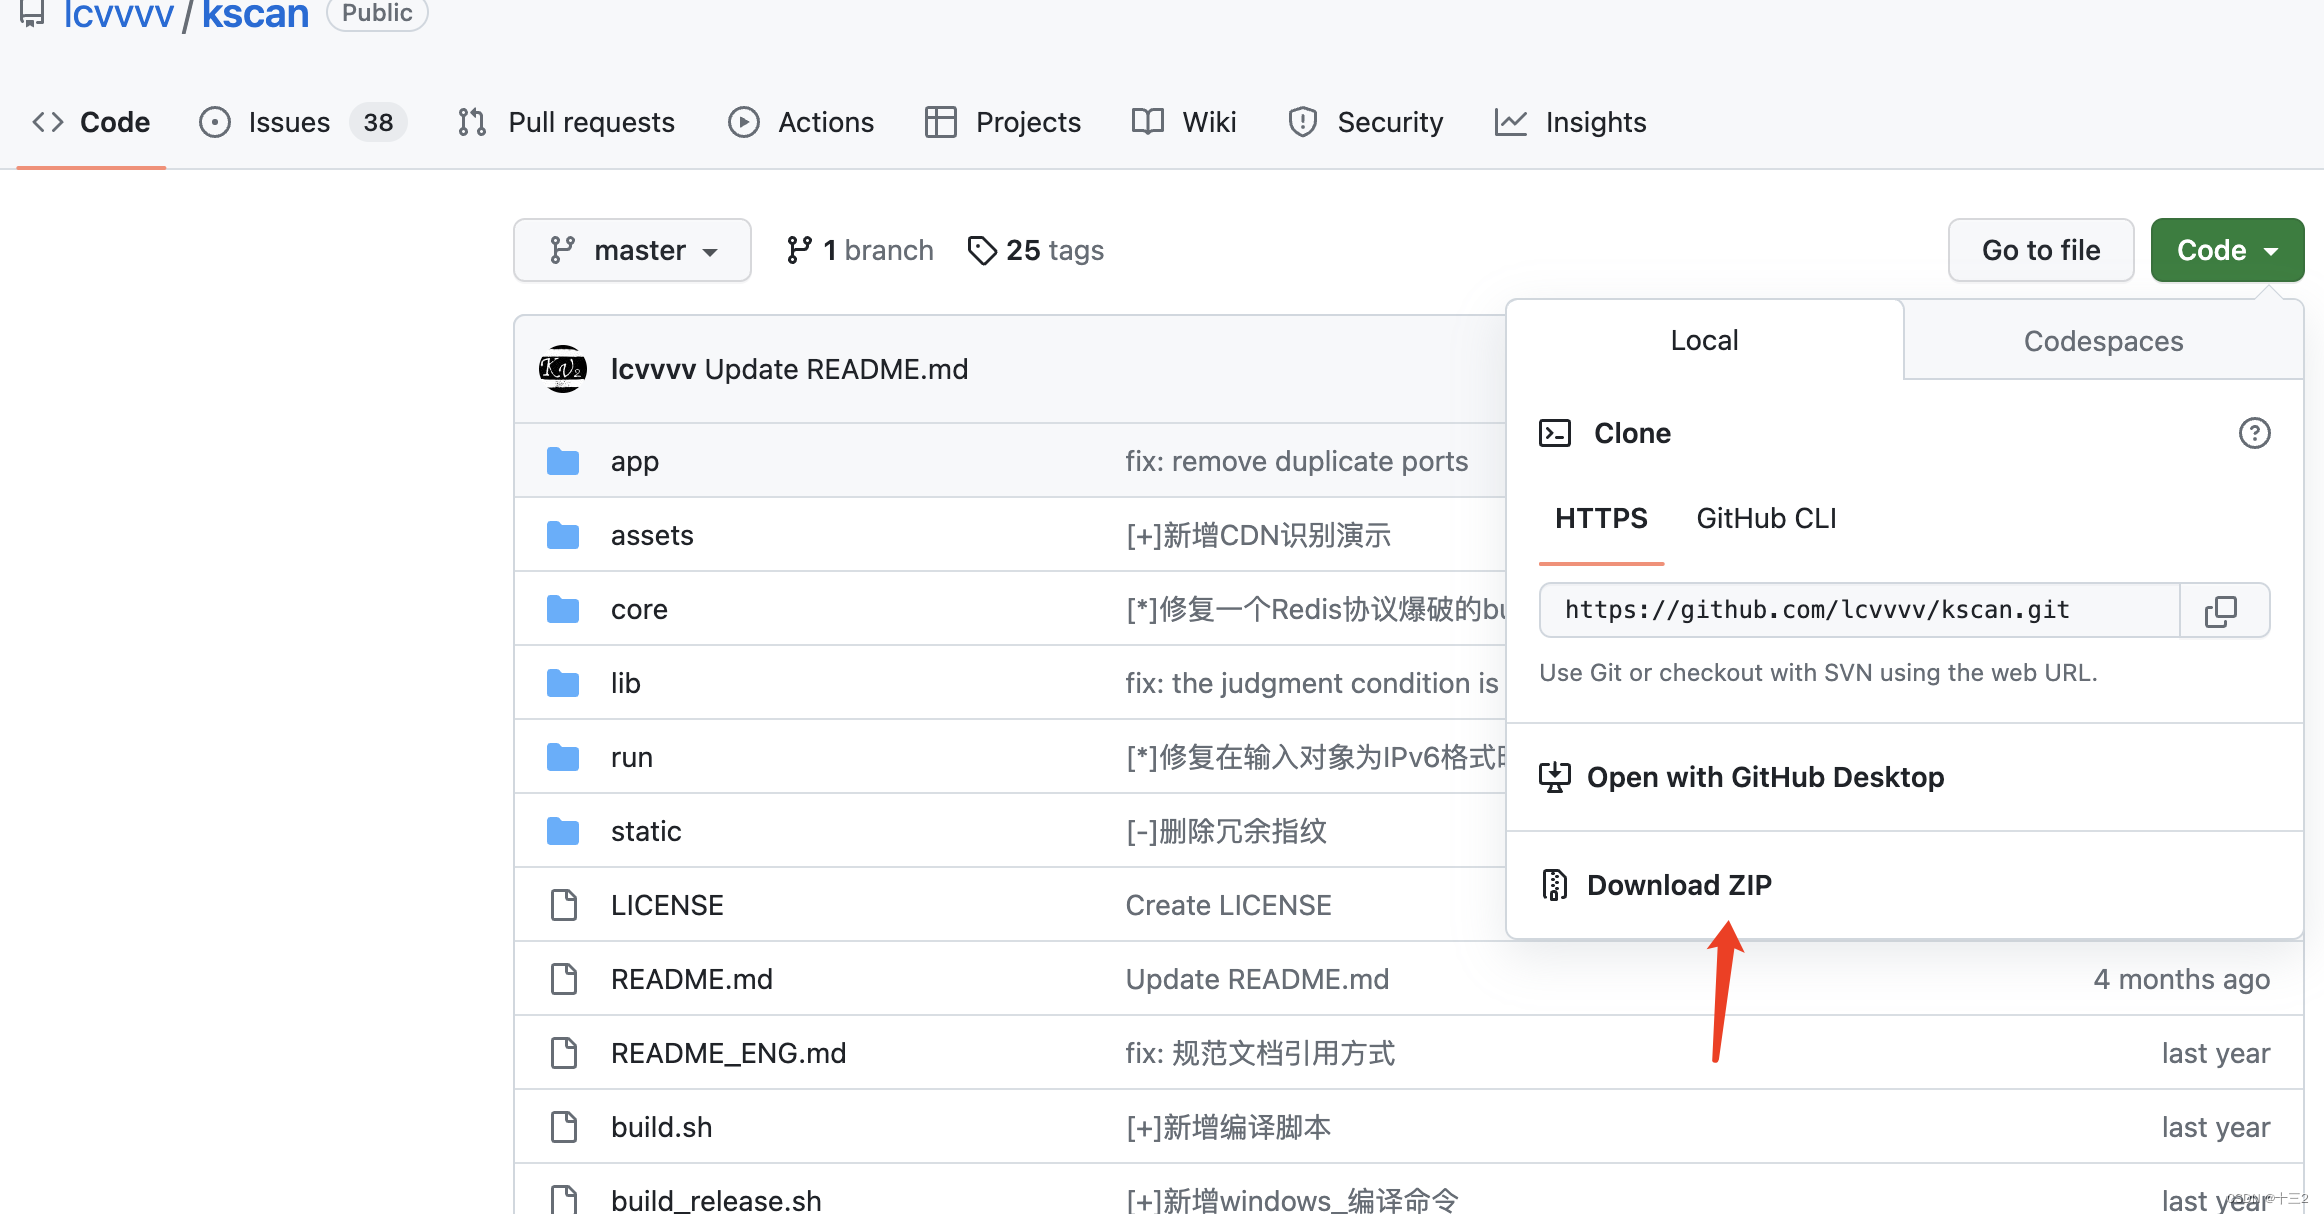
项目地址:
https://github.com/grafana/loki/
与其他日志聚合系统相比,Loki具有以下特性:
- 不对日志进行全文索引。通过存储压缩非结构化日志和仅索引元数据,Loki操作起来会更简单,更省成本
- 通过使用与Prometheus相同的标签记录流对日志进行索引和分组,这使得日志的扩展和操作效率更高,能对接 alertmanager
- 特别适合存储Kubernetes Pod日志;诸如Pod标签之类的元数据会被自动删除和编入索引
- 受Grafana原生支持,避免Kibana和grafana来回切换
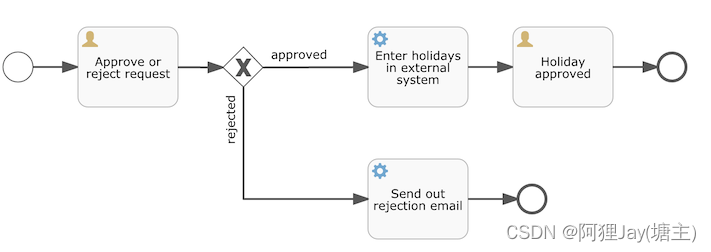
日志收集流程图
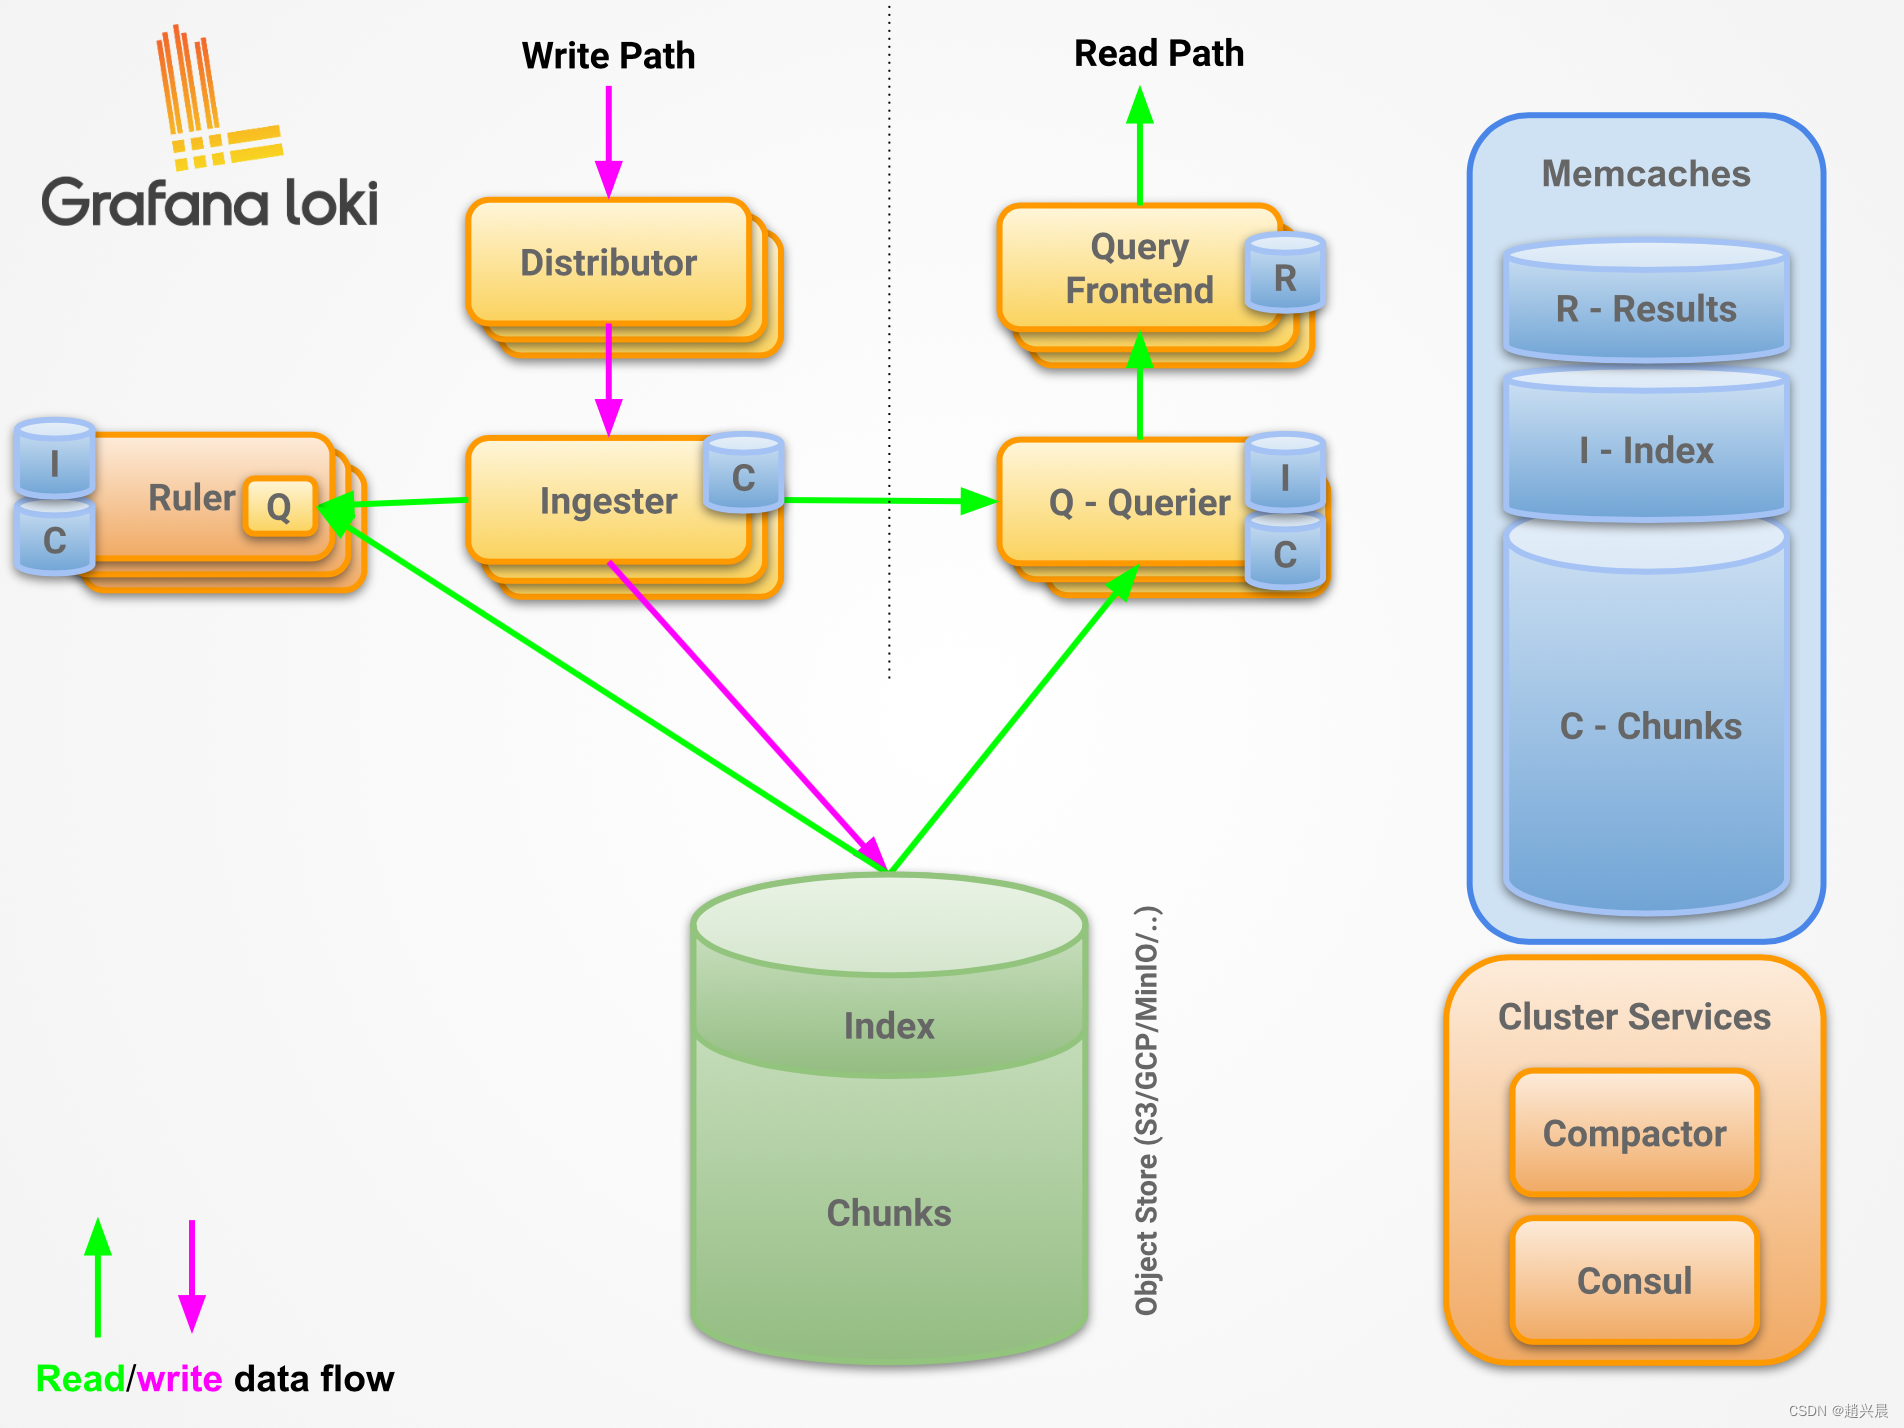
架构说明
部署
安装 docker
# 安装依赖
sudo yum install -y yum-utils device-mapper-persistent-data lvm2

# 添加源
sudo yum-config-manager --add-repo http://mirrors.aliyun.com/docker-ce/linux/centos/docker-ce.repo

# 更新
sudo yum makecache fast

# 安装docker-ce
sudo yum -y install docker-ce

# 创建配置文件目录
sudo mkdir -p /etc/docker

# 创建配置文件
touch /etc/docker/daemon.json

# 新增配置文件内容 /mitr/middleware/docker目录已创建
cat <<EOF | sudo tee /etc/docker/daemon.json
{
"registry-mirrors":["https://docker.mirrors.ustc.edu.cn"],
"data-root": "/mitr/middleware/docker"
}
EOF

# 加载启动并设置开机自启
systemctl daemon-reload && systemctl enable docker && systemctl start docker
安装grafana
# 拉取镜像
docker pull grafana/grafana

# 创建镜像并启动grafana 初始密码 admin/admin
docker run --name=grafana -id -p 3000:3000 grafana/grafana
安装Promtail
# 拉取镜像
docker pull grafana/promtail

# 创建配置文件目录
mkdir -p /etc/promtail

cat <<EOF |sudo tee /etc/promtail/promtail-config.yaml
server:
  http_listen_port: 9080
  grpc_listen_port: 0

positions:
  filename: /tmp/positions.yaml

clients:
  - url: http://10.0.0.58:3100/loki/api/v1/push

scrape_configs:
- job_name: system
  static_configs:
  - targets:
      - localhost
    labels:
      job: varlogs
      host: localhost
      __path__: /var/log/*
EOF
# 创建并启动容器
docker run -di --name=promtail -v /etc/promtail/promtail-config.yaml:/etc/promtail/config.yml -v /var/log:/var/log -p 9080:9080 grafana/promtail
安装Loki
# 拉取镜像
docker pull grafana/loki

# 创建配置文件目录
mkdir -p /etc/loki

cat <<EOF |sudo tee /etc/loki/local-config.yaml
# 认证配置
# 通过X-Scope-OrgID头启用身份验证,该头必须存在
# 如果情况属实。如果为假,则OrgID将始终设置为"fake"
auth_enabled: false

# 端口配置
server:
  http_listen_port: 3100

ingester:
  # WAL(Write Ahead Log)记录传入的日志,并将他们存储在本地文件系统,在进程雪崩的情况下,保证已确认数据的持久性。
  wal:
    enabled: true
    dir: /loki/wal

  # 生命周期配置
  lifecycler:
    address: 127.0.0.1
    ring:
      kvstore:
        # Backend storage to use for the ring. Supported values are: consul, etcd,
        # inmemory, memberlist
        # CLI flag: -ring.store
        store: inmemory

      # The number of ingesters to write to and read from
      # default = 3
      replication_factor: 1
    # 在退出以确保指标被抓取之前休眠的持续时间 default = 30s
    final_sleep: 0s
  chunk_idle_period: 1h       # Any chunk not receiving new logs in this time will be flushed
  max_chunk_age: 1h           # All chunks will be flushed when they hit this age, default is 1h
  chunk_target_size: 1048576  # Loki will attempt to build chunks up to 1.5MB, flushing first if chunk_idle_period or max_chunk_age is reached first
  chunk_retain_period: 30s    # Must be greater than index read cache TTL if using an index cache (Default index read cache TTL is 5m)
  max_transfer_retries: 0     # Chunk transfers disabled

schema_config:
  configs:
    - from: 2020-10-24
      store: boltdb-shipper
      object_store: filesystem
      schema: v11
      index:
        prefix: index_
        period: 24h

# 配置Loki存储数据的位置
storage_config:
  boltdb_shipper:
    active_index_directory: /loki/boltdb-shipper-active
    cache_location: /loki/boltdb-shipper-cache
    cache_ttl: 24h         # Can be increased for faster performance over longer query periods, uses more disk space
    shared_store: filesystem
  filesystem:
    directory: /loki/chunks

# 压缩块配置压缩器组件,该组件压缩索引碎片以提高性能
compactor:
  working_directory: /loki/boltdb-shipper-compactor
  shared_store: filesystem

limits_config:
  reject_old_samples: true
  # Maximum accepted sample age before rejecting
  reject_old_samples_max_age: 168h

chunk_store_config:
  # 向后查找日志行所需的最大时间。仅适用于即时日志查询 default = 30s
  max_look_back_period: 0s

table_manager:
  retention_deletes_enabled: true
  retention_period: 360h

# ruler:
#   storage:
#     type: local
#     local:
#       directory: /loki/rules
#   rule_path: /loki/rules-temp
#   alertmanager_url: http://localhost:9093
#   ring:
#     kvstore:
#       store: inmemory
#   enable_api: true
EOF

# 创建并启动容器
docker run -di --name=loki -v loki-data:/loki -v /etc/loki/local-config.yaml:/etc/loki/local-config.yaml -p 3100:3100 grafana/loki
使用
Grafana配置Loki数据源
如下图:

源地址配置 http://10.0.0.74:3100 即可 保存

保存之后,切换到grafana左侧区域的Explore,即可进入到Loki页面

然后点击Log browser 就可以把当前系统采集的日志标签显示出来,再根据这些标签进行日志的过滤查询即可,比如这里选择 /var/log/message,10.0.0.74,就会把该文件下面的日志过滤展示出来
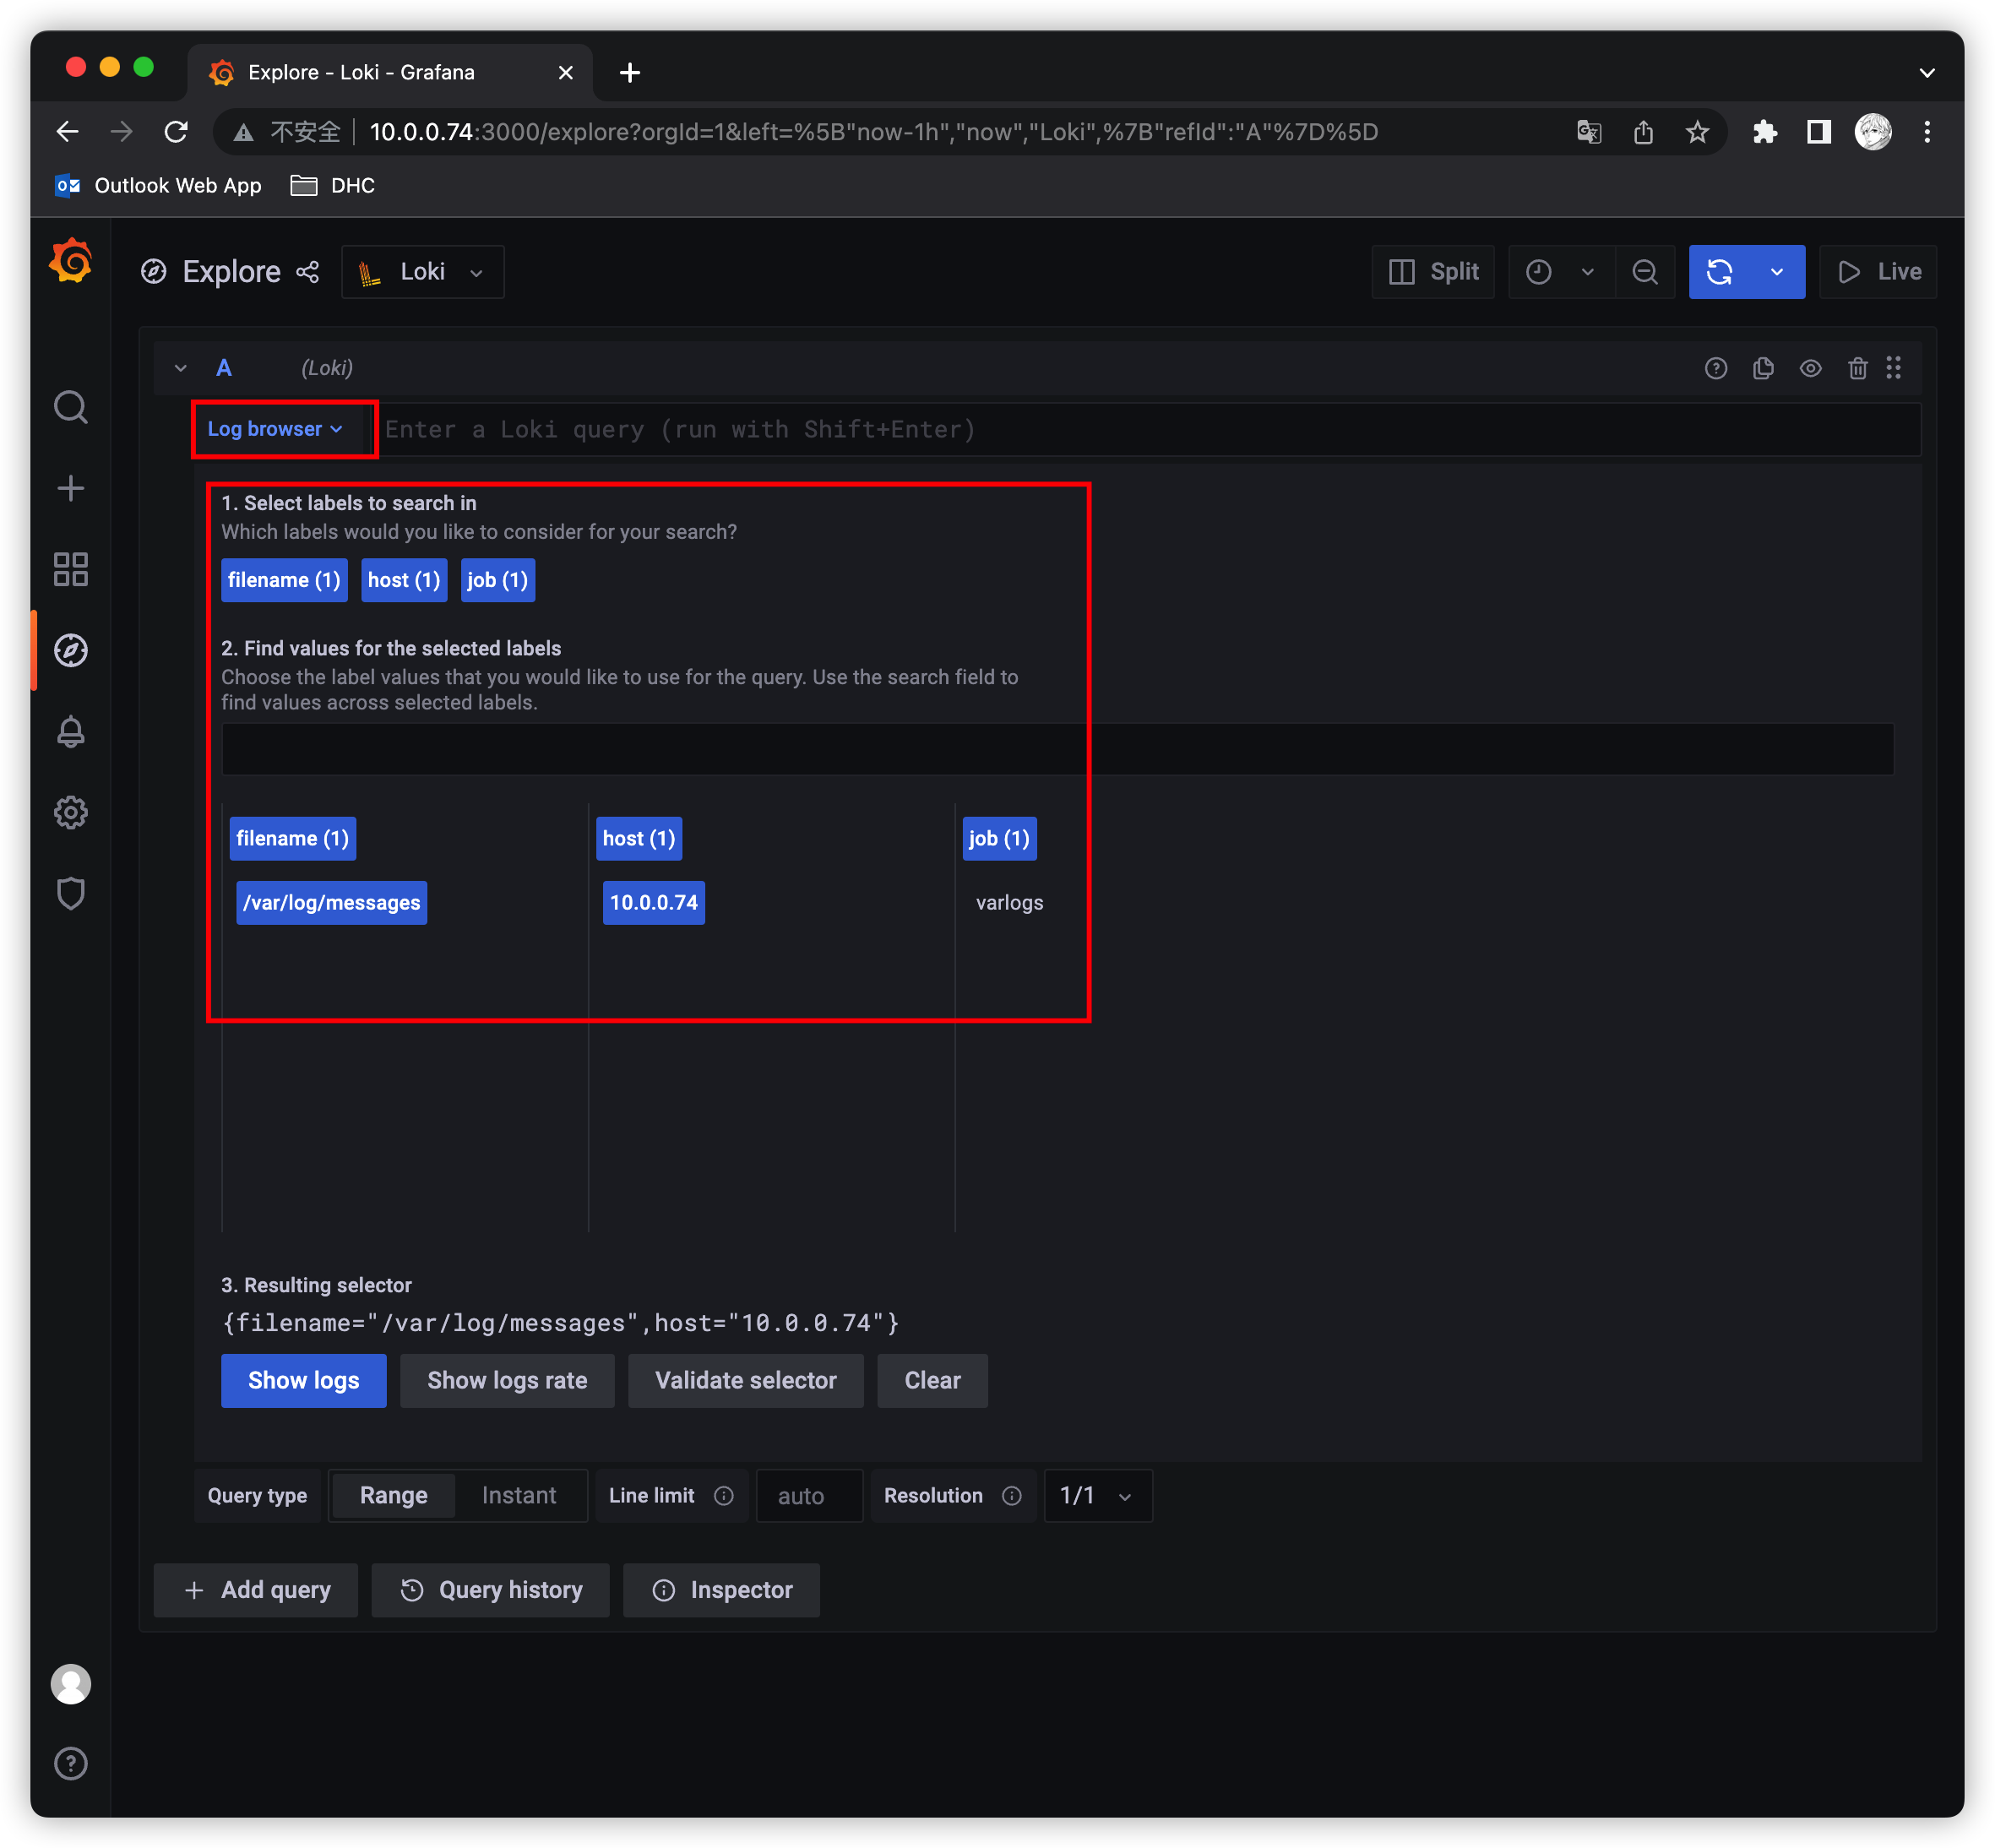

这里展示的是Promtail容器里面的 /var/log 目录中的日志
Promtail容器 /etc/promtail/config.yml
shellserver:
  http_listen_port: 9080
  grpc_listen_port: 0

positions:
  filename: /tmp/positions.yaml

clients:
  - url: http://loki:3100/loki/api/v1/push

scrape_configs:
- job_name: system
  static_configs:
  - targets:
      - localhost
    labels:
      job: varlogs
      __path__: /var/log/*log
这里的 job 就是varlog,文件路径就是 /var/log/*log
只索引标签:之前多次看到Loki和ES最大的不同是Loki只对标签进行索引而不对内容索引。
静态标签匹配模式
以简单的Promtail配置举例
scrape_configs:
 - job_name: system
   pipeline_stages:
   static_configs:
   - targets:
      - localhost
     labels:
      job: message
      __path__: /var/log/messages
解读:
- 上面这段配置代表启动一个日志采集任务
- 这个任务有一个固定标签 job: message
- 采集日志路径为 /var/log/messages,会以一个名为filename的固定标签
- 在Promtail的web页面上可以看到类似Promtail的target信息页面
可以和使用Prometheus一样的标签匹配语句进行查询 {job=“message”}
scrape_configs:
 - job_name: system
   pipeline_stages:
   static_configs:
   - targets:
      - localhost
     labels:
      job: syslog
      __path__: /var/log/syslog
 - job_name: system
   pipeline_stages:
   static_configs:
   - targets:
      - localhost
     labels:
      job: apache
      __path__: /var/log/apache.log
如果我们配置了两个job,则可以使用 {job=~“message|varlogs”} 进行多job匹配;同时也支持正则匹配
标签匹配模式特点
- 和Prometheus一致,相同标签对应的是一个流Prometheus处理series的模式
- Prometheus中标签一致对应的同一个hash值和refid(正整数递增的id),也就是同一个series
- 时序数据不断的append追加到这个memseries中
- 当有人以标签发生变化时会产生新的hash值和refid,对应新的series
Loki处理日志的模式和Prometheus一致,loki一组标签值会生成一个stream。日志随着时间的递增会追加到这个stream中,最后压缩为chunk。当有人以标签发生变化时会产生新的hash值,对应新的stream
查询过程:
- loki现根据标签算出hash值在倒排索引中找到对应的chunk
- 然后再根据查询语句中的关键词等进行过滤,这样可以提速
- 因为这种根据标签算哈希在倒排中查找id,对应找到存储的块在Prometheus中已经被验证过了
- 属于第开销 速度快
动态标签和高基数
- 动态标签:标签的value不固定
- 高基数标签:标签的value可能性太多了,达到10万,100万甚至更多
比如Apache的access日志
11.11.11.11 - frank [25/Jan/2000:14:00:01 -0500] “GET /1986.js HTTP/1.1” 200 932 “-” “Mozilla/5.0 (Windows; U; Windows NT 5.1; de; rv:1.9.1.7) Gecko/20091221 Firefox/3.5.7 GTB6”
在Promtail中使用regex想要匹配action和status_code两个标签:
scrape_configs:
 - job_name: system
   pipeline_stages:
   static_configs:
   - targets:
      - localhost
     labels:
      job: syslog
      __path__: /var/log/syslog
 - job_name: system
   pipeline_stages:
   static_configs:
   - targets:
      - localhost
     labels:
      job: apache
      __path__: /var/log/apache.log

  - job_name: system
    pipeline_stages:
       - regex:
         expression: "^(?P<ip>\\S+) (?P<identd>\\S+) (?P<user>\\S+) \\[(?P<timestamp>[\\w:/]+\\s[+\\-]\\d{4})\\] \"(?P<action>\\S+)\\s?(?P<path>\\S+)?\\s?(?P<protocol>\\S+)?\" (?P<status_code>\\d{3}|-) (?P<size>\\d+|-)\\s?\"?(?P<referer>[^\"]*)\"?\\s?\"?(?P<useragent>[^\"]*)?\"?$"
     - labels:
         action:
         status_code:
    static_configs:
    - targets:
       - localhost
      labels:
       job: apache
       env: dev
       __path__: /var/log/apache.log
那么对应action=get/post 和 status_code=200/400 则对应4个流:
11.11.11.11 - frank [25/Jan/2000:14:00:01 -0500] "GET /1986.js HTTP/1.1" 200 932 "-" "Mozilla/5.0 (Windows; U; Windows NT 5.1; de; rv:1.9.1.7) Gecko/20091221 Firefox/3.5.7 GTB6"
11.11.11.12 - frank [25/Jan/2000:14:00:02 -0500] "POST /1986.js HTTP/1.1" 200 932 "-" "Mozilla/5.0 (Windows; U; Windows NT 5.1; de; rv:1.9.1.7) Gecko/20091221 Firefox/3.5.7 GTB6"
11.11.11.13 - frank [25/Jan/2000:14:00:03 -0500] "GET /1986.js HTTP/1.1" 400 932 "-" "Mozilla/5.0 (Windows; U; Windows NT 5.1; de; rv:1.9.1.7) Gecko/20091221 Firefox/3.5.7 GTB6"
11.11.11.14 - frank [25/Jan/2000:14:00:04 -0500] "POST /1986.js HTTP/1.1" 400 932 "-" "Mozilla/5.0 (Windows; U; Windows NT 5.1; de; rv:1.9.1.7) Gecko/20091221 Firefox/3.5.7 GTB6"
那四个日志行将变成4个单独的流,并开始填充4个单独的块,如果出现另一个独特的标签组合(如 status_code=500),则会创建另一个新流。
高基数问题:就像上面,如果给ip设置一个标签,来自用户的每个不同的ip请求不仅成为唯一的流。可以快速生成成千上万的流,这是高基数,这样可以杀死Loki
如果字段没有被当做标签被索引,会不会查询很慢,Loki的能力是将查询分解为小块并行分发,以便可以在短时间内查询大量日志数据
全文索引问题
大索引既复杂又昂贵。通常日志数据的全文索引的大小等于或大于日志数据本身的大小。
要查询日志数据,需要加载此索引,并且为了提高性能,它可能在内存中。这很难扩展,并随着日志增多,索引会迅速变大。
Loki的索引通常比摄取的日志量小一个数量级,索引的增长非常缓慢。
加速查询没标签字段:以👆提到的ip字段为例,使用过滤器表达式查询
{job=“apache”}|=“11.11.11.11”
loki查询时的分片(按时间范围分段 grep)
- Loki把查询分解成较小的分片,并且与标签匹配的流打开每个区块,并开始寻找IP地址
- 这些分片的大小和并行化的数量是可以配置的,并取决于提供的资源
- 如果需要,可以将分片间隔配置文件5min,部署20个查询器,并在几秒钟内处理千兆字节的日志
- 或者,可以设置200个查询器并处理TB的日志
两种索引模式对比
- es的大索引,不管你查不查询,它都必须时刻存在。比如长时间占用过多的内存
- loki的逻辑是查询时在启动多个分段并行查询
日志量少时少加标签
- 因为每多加载一个chunk就有额外的开销
- 举例,如果查询是 {app=“loki”,level!=“bug”}
- 在没加level标签的情况下只需要加载一个chunk 即app=“loki”的标签
- 如果加了level的情况,则需要把level=info,warn,error,critical 5个chunk都加载再查询
需要标签是再去添加
- 当chunk_target_size=1M时 以1M的压缩大小来切割块
- 对应原始日志大小在5M—10M,如果日志在max_chunk_age时间内能达到10M,考虑添加标签
日志应当按时间递增
- 这个问题和tsdb中处理旧数据是一样的道理
- 目前loki为了性能考虑直接拒绝掉旧数据
对接Prometheus监控
修改 prometheus.yml
scrape_configs:
    - job_name: 'Loki'
      static_configs:
        - targets: ["10.0.0.74:3100"]
然后加载Prometheus即可
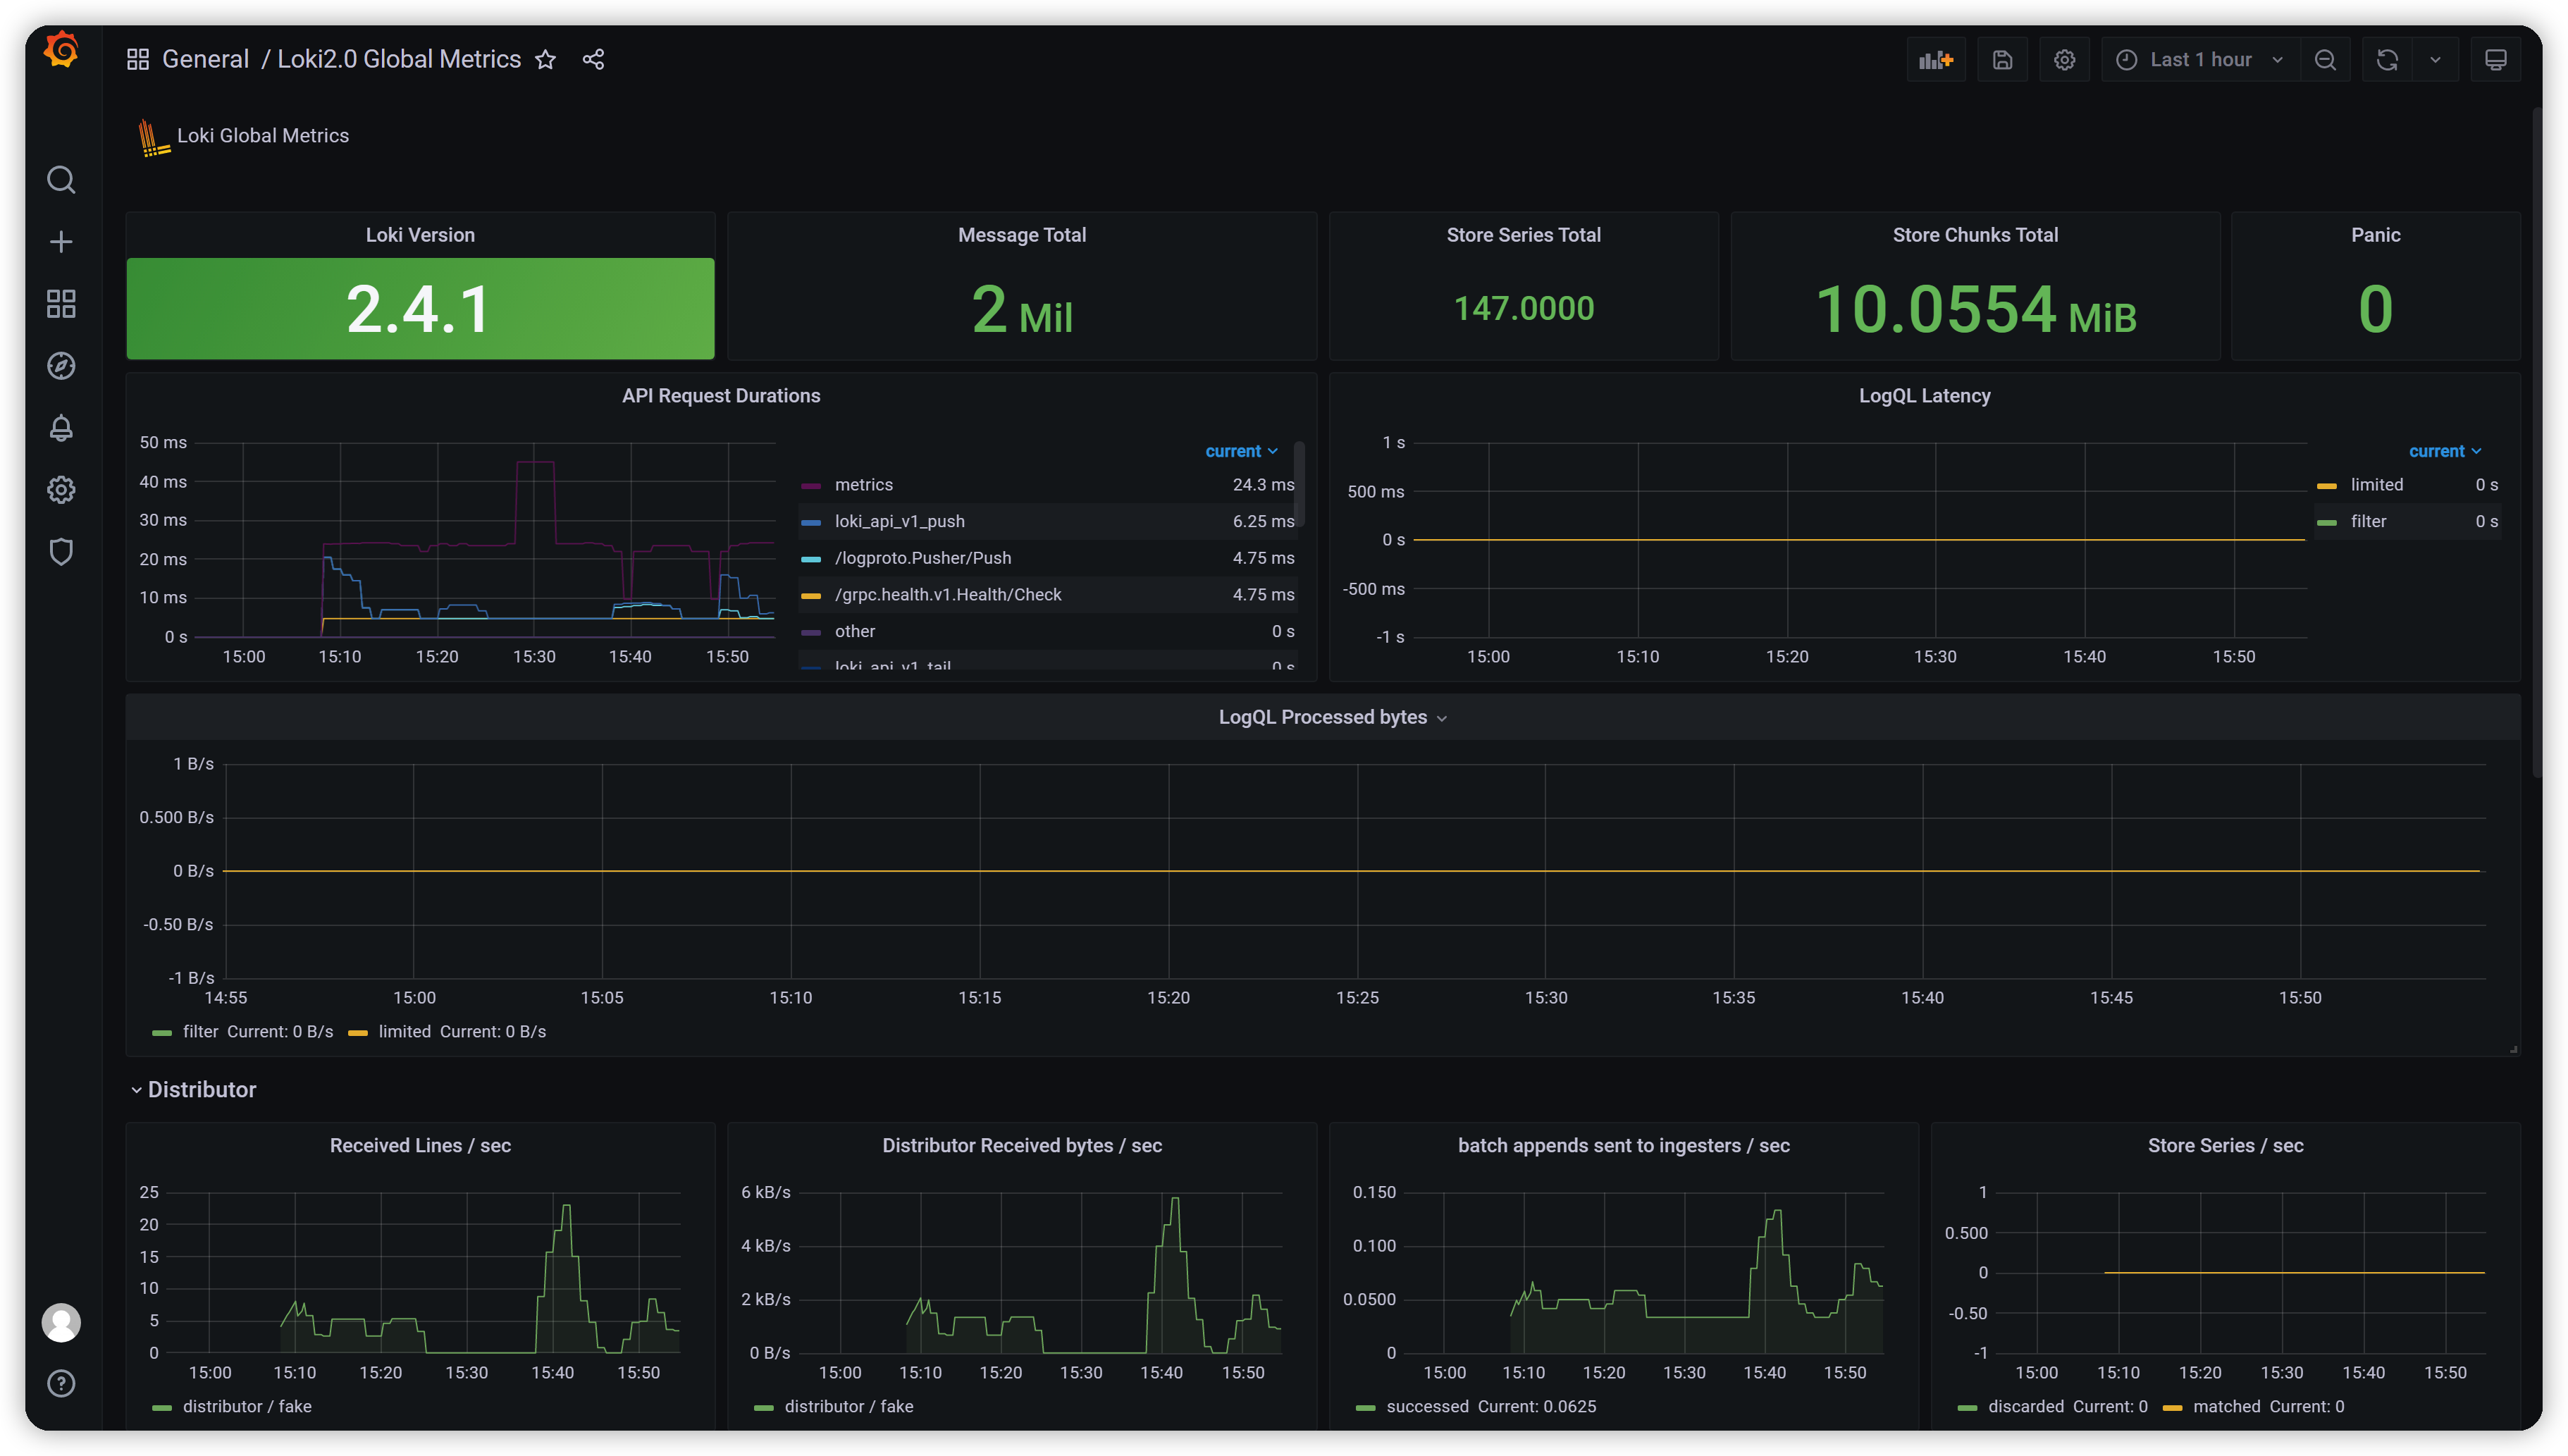
Grafana dashboard
安装插件
grafana-cli plugins install grafana-piechart-panel
dashboard效果图
import Dashboard Json
{

  "annotations": {

    "list": [
      {

        "$$hashKey": "object:7",
        "builtIn": 1,
        "datasource": "-- Grafana --",
        "enable": true,
        "hide": true,
        "iconColor": "rgba(0, 211, 255, 1)",
        "name": "Annotations & Alerts",
        "target": {

          "limit": 100,
          "matchAny": false,
          "tags": [],
          "type": "dashboard"
        },
        "type": "dashboard"
      }
    ]
  },
  "description": "Loki metrics via 2.0",
  "editable": true,
  "gnetId": 13407,
  "graphTooltip": 0,
  "id": 28,
  "links": [],
  "panels": [
    {

      "datasource": "Prometheus",
      "description": "",
      "gridPos": {

        "h": 2,
        "w": 24,
        "x": 0,
        "y": 0
      },
      "id": 21,
      "interval": "",
      "options": {

        "content": "<div class=\"left dashboard-header\">\n   <img src=\"https://marketplace-assets.digitalocean.com/logos/loki-logo.svg\" style=\"height:29px;\"/>\n  <span>Loki Global Metrics</span>\n</div>",
        "mode": "html"
      },
      "pluginVersion": "8.1.3",
      "targets": [
        {

          "expr": "loki_build_info",
          "format": "table",
          "instant": false,
          "interval": "",
          "legendFormat": "",
          "refId": "A"
        }
      ],
      "timeFrom": null,
      "timeShift": null,
      "transparent": true,
      "type": "text"
    },
    {

      "datasource": "Prometheus",
      "fieldConfig": {

        "defaults": {

          "decimals": 4,
          "links": [],
          "mappings": [],
          "thresholds": {

            "mode": "absolute",
            "steps": [
              {

                "color": "green",
                "value": null
              }
            ]
          },
          "unit": "short"
        },
        "overrides": []
      },
      "gridPos": {

        "h": 3,
        "w": 6,
        "x": 0,
        "y": 2
      },
      "id": 59,
      "interval": "",
      "options": {

        "colorMode": "background",
        "graphMode": "none",
        "justifyMode": "center",
        "orientation": "auto",
        "reduceOptions": {

          "calcs": [
            "last"
          ],
          "fields": "/^version$/",
          "values": false
        },
        "text": {
   },
        "textMode": "auto"
      },
      "pluginVersion": "8.1.3",
      "targets": [
        {

          "expr": "loki_build_info",
          "format": "table",
          "instant": false,
          "interval": "",
          "legendFormat": "",
          "refId": "A"
        }
      ],
      "timeFrom": null,
      "timeShift": null,
      "title": "Loki Version",
      "type": "stat"
    },
    {

      "datasource": "Prometheus",
      "fieldConfig": {

        "defaults": {

          "decimals": 0,
          "links": [],
          "mappings": [],
          "thresholds": {

            "mode": "absolute",
            "steps": [
              {

                "color": "green",
                "value": null
              }
            ]
          },
          "unit": "short"
        },
        "overrides": []
      },
      "gridPos": {

        "h": 3,
        "w": 6,
        "x": 6,
        "y": 2
      },
      "id": 10,
      "interval": "",
      "options": {

        "colorMode": "value",
        "graphMode": "none",
        "justifyMode": "center",
        "orientation": "auto",
        "reduceOptions": {

          "calcs": [
            "last"
          ],
          "fields": "",
          "values": false
        },
        "text": {
   },
        "textMode": "auto"
      },
      "pluginVersion": "8.1.3",
      "targets": [
        {

          "expr": "sum(log_messages_total)",
          "instant": false,
          "interval": "",
          "legendFormat": "",
          "refId": "A"
        }
      ],
      "timeFrom": null,
      "timeShift": null,
      "title": "Message Total",
      "type": "stat"
    },
    {

      "datasource": "Prometheus",
      "fieldConfig": {

        "defaults": {

          "decimals": 4,
          "links": [],
          "mappings": [],
          "thresholds": {

            "mode": "absolute",
            "steps": [
              {

                "color": "green",
                "value": null
              }
            ]
          },
          "unit": "short"
        },
        "overrides": []
      },
      "gridPos": {

        "h": 3,
        "w": 4,
        "x": 12,
        "y": 2
      },
      "id": 23,
      "interval": "",
      "options": {

        "colorMode": "value",
        "graphMode": "area",
        "justifyMode": "auto",
        "orientation": "auto",
        "reduceOptions": {

          "calcs": [
            "mean"
          ],
          "fields": "",
          "values": false
        },
        "text": {
   },
        "textMode": "auto"
      },
      "pluginVersion": "8.1.3",
      "targets": [
        {

          "expr": "sum(loki_store_series_total)",
          "instant": false,
          "interval": "",
          "legendFormat": "",
          "refId": "A"
        }
      ],
      "timeFrom": null,
      "timeShift": null,
      "title": "Store Series Total",
      "type": "stat"
    },
    {

      "datasource": "Prometheus",
      "fieldConfig": {

        "defaults": {

          "decimals": 4,
          "links": [],
          "mappings": [],
          "thresholds": {

            "mode": "absolute",
            "steps": [
              {

                "color": "green",
                "value": null
              }
            ]
          },
          "unit": "bytes"
        },
        "overrides": []
      },
      "gridPos": {

        "h": 3,
        "w": 5,
        "x": 16,
        "y": 2
      },
      "id": 41,
      "interval": "",
      "options": {

        "colorMode": "value",
        "graphMode": "none",
        "justifyMode": "auto",
        "orientation": "auto",
        "reduceOptions": {

          "calcs": [
            "mean"
          ],
          "fields": "",
          "values": false
        },
        "text": {
   },
        "textMode": "auto"
      },
      "pluginVersion": "8.1.3",
      "targets": [
        {

          "expr": "sum(loki_ingester_chunk_stored_bytes_total)",
          "instant": true,
          "interval": "",
          "legendFormat": "",
          "refId": "A"
        }
      ],
      "timeFrom": null,
      "timeShift": null,
      "title": "Store Chunks Total",
      "type": "stat"
    },
    {

      "datasource": "Prometheus",
      "fieldConfig": {

        "defaults": {

          "decimals": 4,
          "links": [],
          "mappings": [],
          "thresholds": {

            "mode": "absolute",
            "steps": [
              {

                "color": "green",
                "value": null
              }
            ]
          },
          "unit": "short"
        },
        "overrides": []
      },
      "gridPos": {

        "h": 3,
        "w": 3,
        "x": 21,
        "y": 2
      },
      "id": 24,
      "interval": "",
      "options": {

        "colorMode": "value",
        "graphMode": "none",
        "justifyMode": "center",
        "orientation": "auto",
        "reduceOptions": {

          "calcs": [
            "last"
          ],
          "fields": "",
          "values": false
        },
        "text": {
   },
        "textMode": "auto"
      },
      "pluginVersion": "8.1.3",
      "targets": [
        {

          "expr": "loki_panic_total",
          "instant": false,
          "interval": "",
          "legendFormat":</