多表显示subplot(),subplots()
# 使用 pyplot 中的 subplot() 和 subplots() 方法来绘制多个子图
# 导入库,和调用中文
import matplotlib.pyplot as plt
import numpy as np
# 作用:解决坐标轴为负时 负号显示为方框的问题
# axes:坐标轴
# Unicode:编码标准
# minus:负号,减号
plt.rcParams['axes.unicode_minus'] = False
# 解决图上汉字显示为方框的问题 在图上显示汉字
plt.rcParams['font.family'] = ['SimHei']
# subplot()函数使用
# subplot(numRows,numCols,plotNum)
# numRows = 1,numCols = 2,
# 就是将图表绘制成 1x2 的图片区域, 对应的坐标为:
# (1, 1), (1, 2)
# plotNum = 1, 表示的坐标为(1, 1), 即第一行第一列的子图。
# plotNum = 2, 表示的坐标为(1, 2), 即第一行第二列的子图。
#
#
# 准备数据
# plot 1:
xpoints = np.array([0, 6])
ypoints = np.array([0, 100])
# plot 2:
x = np.array([1, 2, 3, 4])
y = np.array([1, 4, 9, 16])
# 准备画布
plt.subplot(2,2,1)
# 绘图
plt.plot(xpoints,ypoints)
plt.title('图一')
plt.subplot(2,2,3)
plt.plot(x,y)
plt.title("图二")
# 总的大标题
plt.suptitle("多张图绘制")
# matplotlib.pyplot.subplots(
# nrows=1, //默认为1,设置图表的的行数
# ncols=1, //默认为1,设置图标列数
# *,
# sharex=False, //设置x轴是否共享,默认不共享
# 可设置为 'none'、'all'、'row' 或 'col'。
# sharey=False, //设置y轴是否共享,默认不共享。
# False 或 none 每个子图的 x 轴或 y 轴都是独立的,
# True 或 'all':所有子图共享 x 轴或 y 轴,
# 'row' 设置每个子图行共享一个 x 或 y 轴,
# 'col':设置每个子图列共享一个 x 或 y 轴。
# squeeze=True,
# subplot_kw=None, //可选,字典类型。
# 把字典的关键字传递给 add_subplot() 来创建每个子图。
# gridspec_kw=None, //可选,字典类型。
# 把字典的关键字传递给 GridSpec 构造函数
# 创建子图放在网格里(grid)。
# **fig_kw) /把详细的关键字参数传给 figure() 函数
#
# 准备数据2
np.linspace(start = 0, stop = 100, num = 5) # 平均分布着的数据
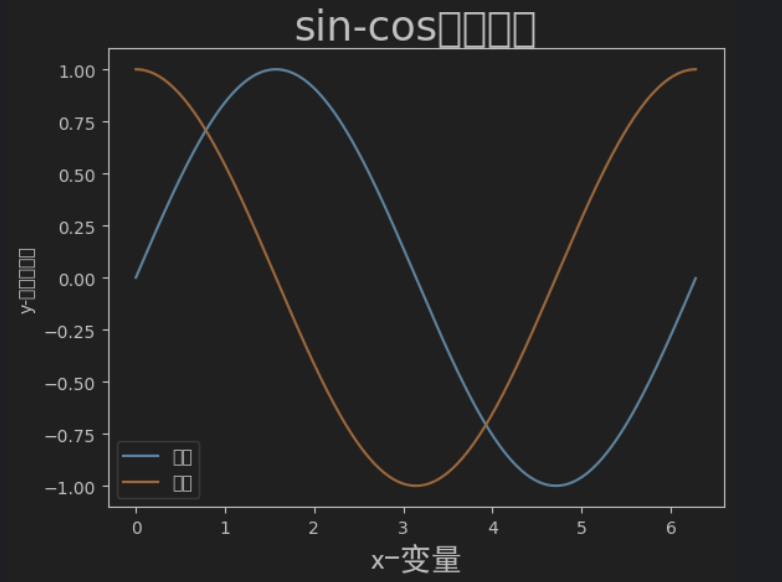
x = np.linspace(0,2*np.pi,50)
y = np.sin(x)
# 原图
plt.figure()
plt.plot(x,y)
yticks = range(-2,2,1)
plt.yticks(yticks)
plt.xlabel('x轴')
plt.ylabel('y轴')
plt.grid(linestyle='--',alpha=0.5)
plt.title('原图')
# 创建一个画像和一个子图
figure1,plot1 = plt.subplots()
plot1.plot(x,y)
plot1.set_title('一个画像和一个子图')
# 创建一个画像,两个子图,并共享y轴
figure2,(plot1,plot2) = plt.subplots(1,2,sharey=True)
plot1.plot(x,y) # 折线图
plot1.set_title('子图1') # 子图1的标题
plot1.grid(linestyle='-',alpha = 0.5) # 网格线
plot2.scatter(x,y) # 散点图
plot2.set_title('子图2') # 子图1的标题
plot2.grid(linestyle='-',alpha = 0.5) # 网格线
plt.suptitle('2个子图') # 总标题
# 在调用subplot()创建子图时通过设置projection='polar',
# 便可创建一个极坐标子图,
# 然后调用plot()在极坐标子图中绘图。
fig=plt.figure()
ax1 = plt.subplot(1,2,1, projection='polar') # 极坐标轴
ax2 = plt.subplot(122) # 数据类型相同时,可以省略
fig.subplots_adjust(wspace=0.4) # 设置子图间的间距,为子图宽度的40%
theta=np.arange(0,2*np.pi,0.02)
ax1.plot(theta,theta/6,'-.',lw=2)
ax2.plot(theta,theta/6,'-.',lw=2)
# 创建四个子图
fig, axs = plt.subplots(2, 2, subplot_kw=dict(projection="polar"))
axs[0, 0].plot(x, y)
axs[1, 1].scatter(x, y)
# 共享 x 轴
fig,axs = plt.subplots(2, 2, sharex='col')
axs[0, 0].plot(x, y)
axs[1, 1].scatter(x, y)
# 共享 y 轴
fig2,axs2 = plt.subplots(2, 2, sharey='row')
axs2[0, 0].plot(x, y)
axs2[1, 1].scatter(x, y)
# 共享 x 轴和 y 轴
fig3,axs3 = plt.subplots(2, 2, sharex='all', sharey='all')
axs3[0, 0].plot(x, y)
axs3[1, 1].scatter(x, y)
# 这个也是共享 x 轴和 y 轴
fig4,ax = plt.subplots(2, 2, num=10,sharex=True, sharey=True)
# 创建标识为 10 的图,已经存在的则删除
fig5, axs= plt.subplots(2,2,num=10, clear=True)
# 展示
plt.show(block=True)
Python之数据可视化
2024-03-31 18:42:01 33 阅读


![[linux] AttributeError: module ‘transformer_engine‘ has no attribute ‘pytorch‘](https://img-blog.csdnimg.cn/direct/fc90b4653bd548d8acc13fe003d4768f.png)