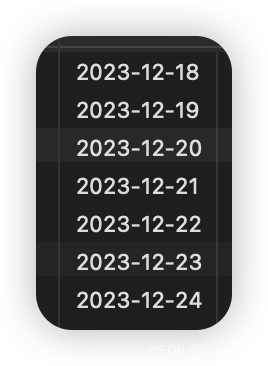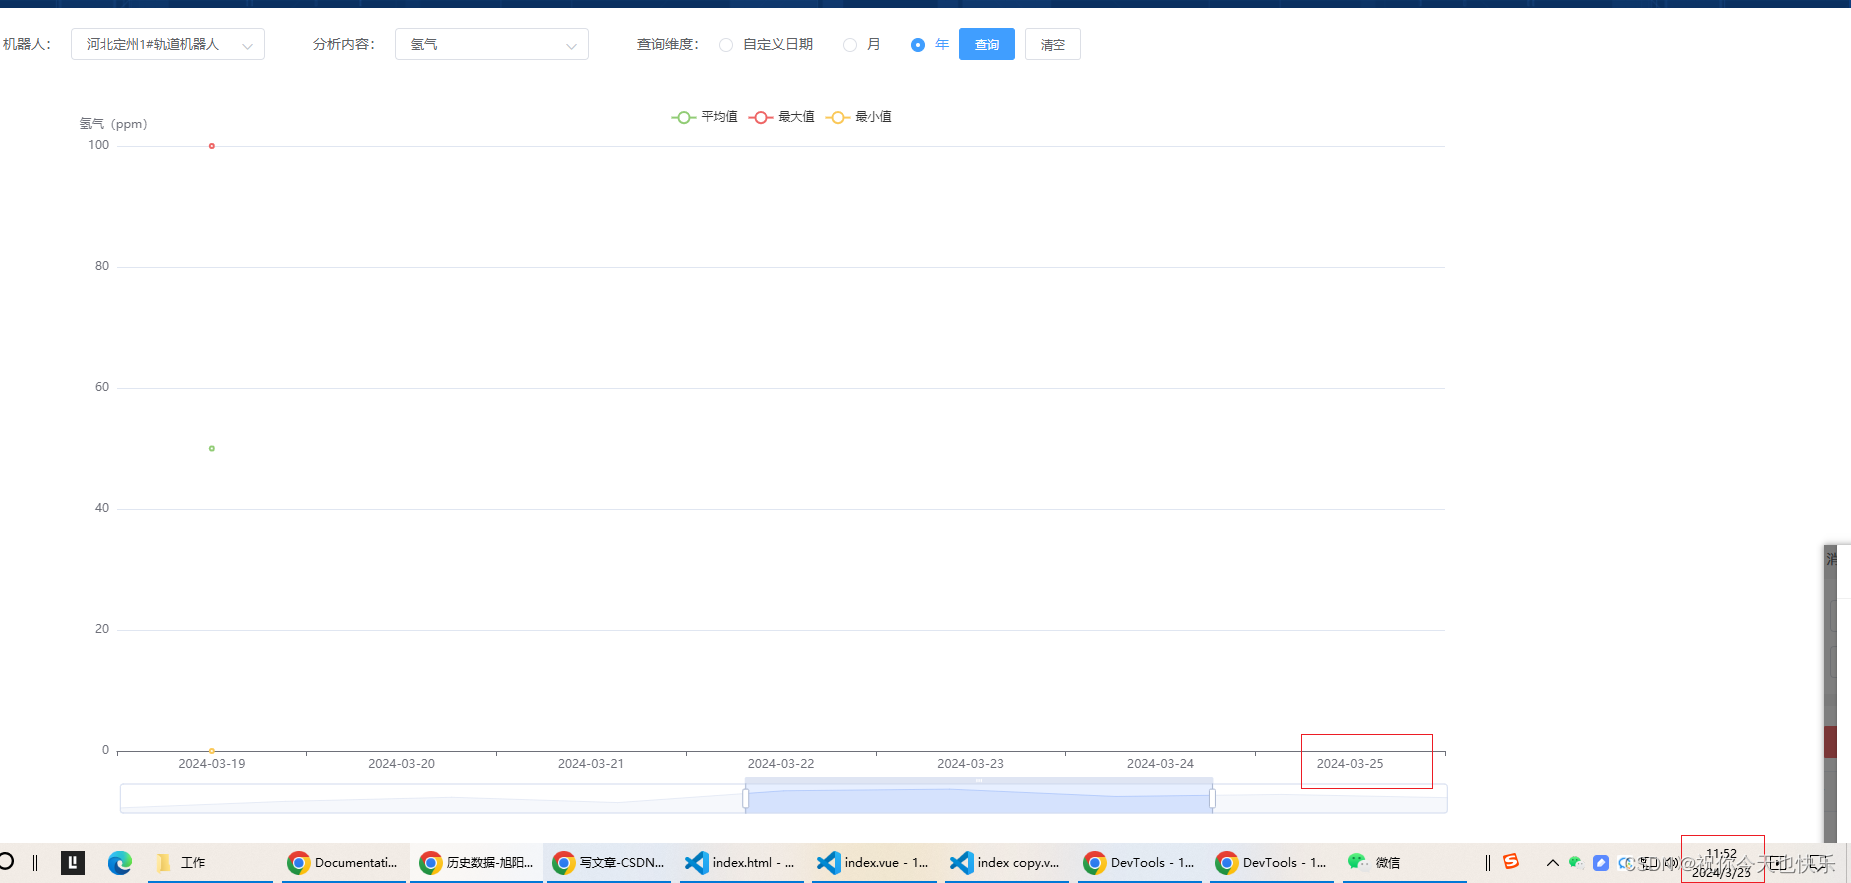
如果返回的数据有包含今天的就显示近7天的
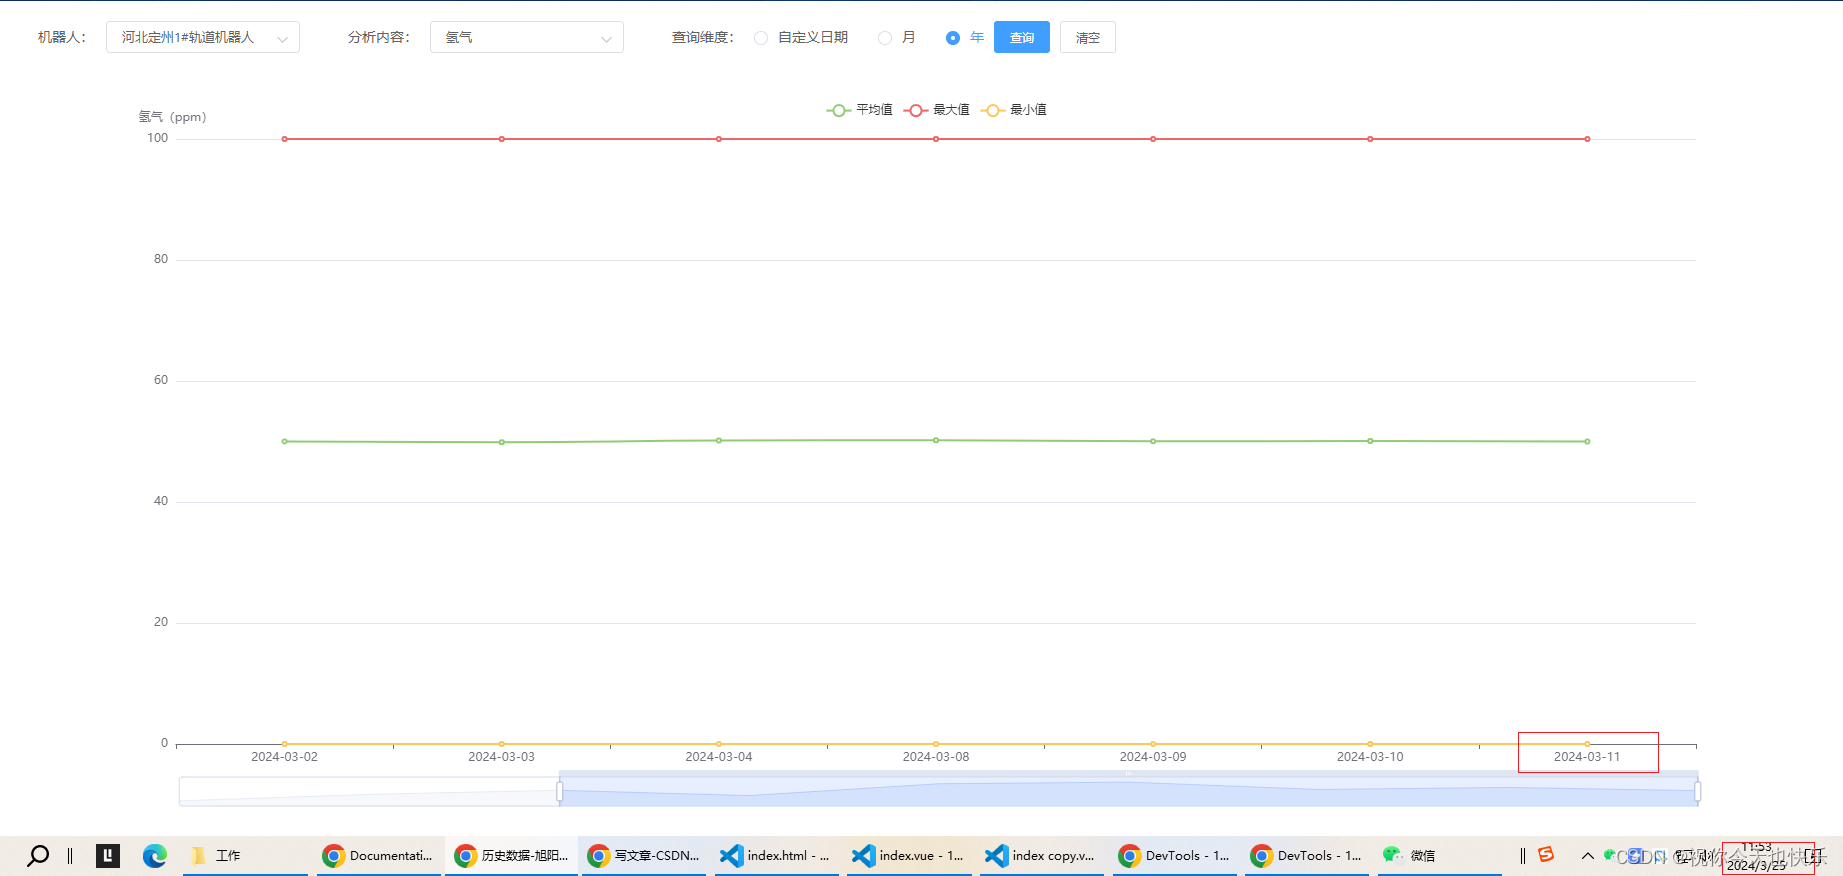
如果返回的日期不包含今天就显示数组最后一个往前7天的数据
// 初始化曲线图
getDetailInfoList() {
let that = this
//==============================判断横坐标
let dataZoomStart = 0
let dataZoomEnd = 0
for (let index = 0; index < this.xData.length; index++) {
const element = this.xData[index];
console.log(this.$moment(element).format('YYYY-MM-DD'), this.$moment(new Date()).format('YYYY-MM-DD'));
console.log(this.xData.includes(this.$moment(new Date()).format('YYYY-MM-DD')));
if (this.xData.includes(this.$moment(new Date()).format('YYYY-MM-DD')) && (this.$moment(element).format('YYYY-MM-DD') == this.$moment(new Date()).format('YYYY-MM-DD'))) {
dataZoomEnd = index
if (index - 6 > 0 || index - 6 == 0) {
dataZoomStart = index - 6
}
}
if (!this.xData.includes(this.$moment(new Date()).format('YYYY-MM-DD'))) {
dataZoomEnd = this.xData.length - 1
if (this.xData.length - 7 > 0 || this.xData.length - 7 == 0) {
dataZoomStart = this.xData.length - 7
}
}
}
//==============判断横坐标
let option = {
tooltip: {
trigger: "axis",
},
legend: {
data: ["平均值", "最大值", "最小值"],
top: 20,
},
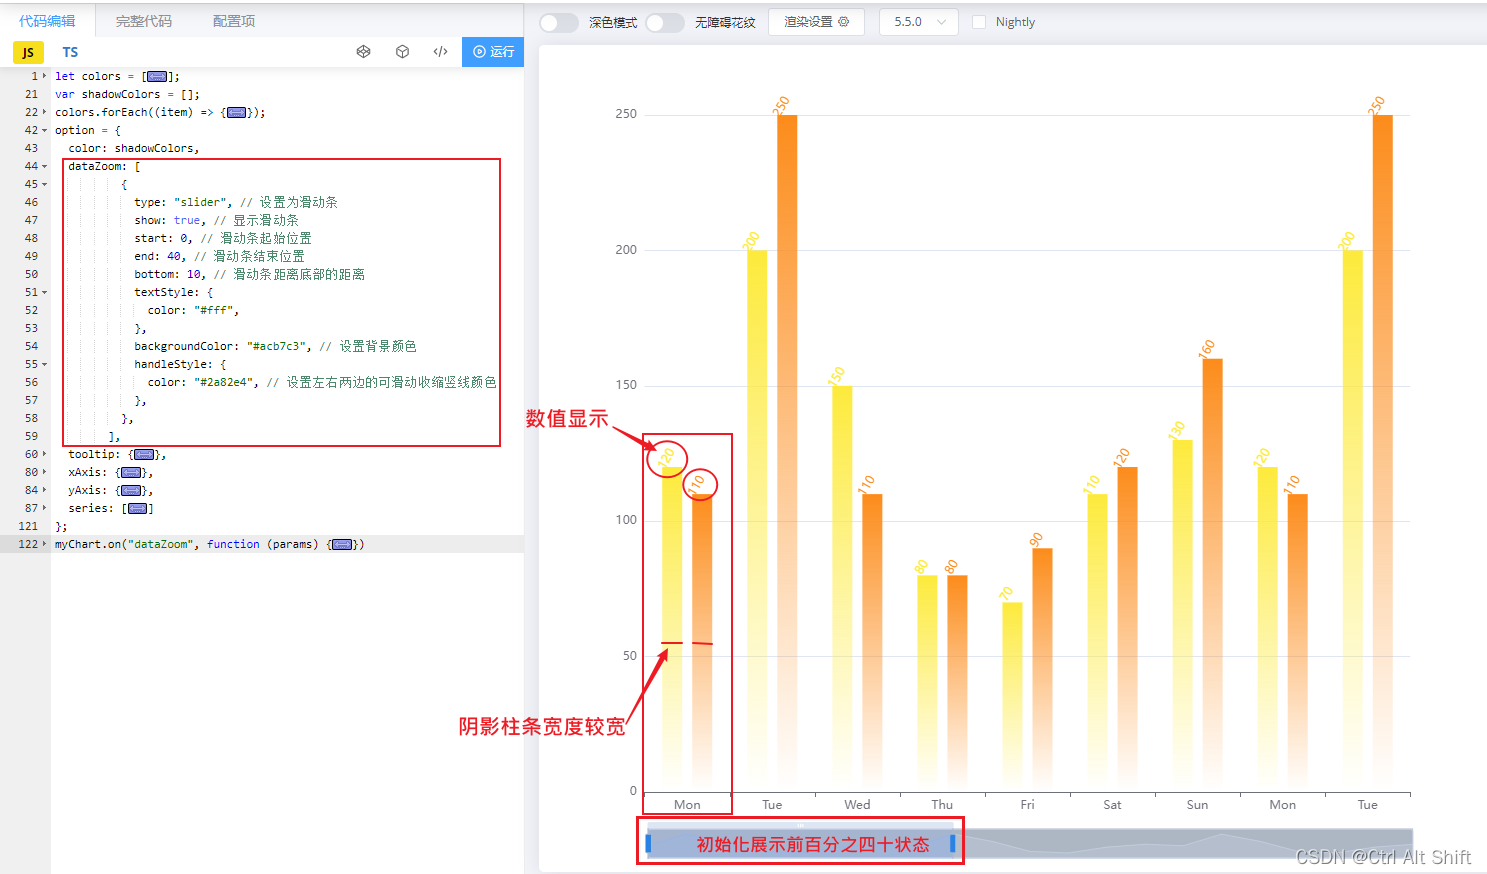
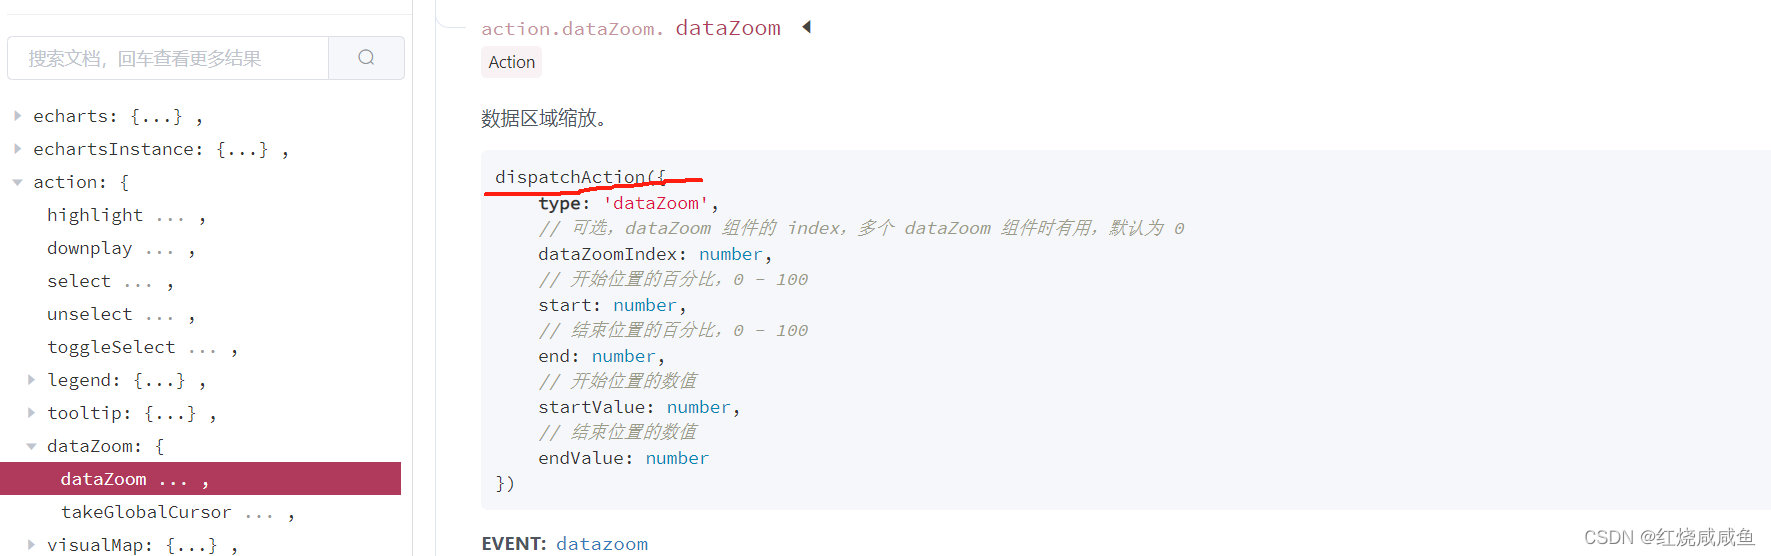
//==============滚动条赋值
dataZoom: [
{
type: 'slider',
startValue: dataZoomStart,
endValue: dataZoomEnd
},
// {
// start: 0,
// end: dataZoomEnd
// }
],
//==============滚动条赋值
description: {
visible: true,
text: "",
},
xAxis: [
{
type: "category",
data: this.xData,
splitLine: {
//不显示分割线
show: false,
},
axisLabel: {
interval: 0,
},
},
],
yAxis: [
{
type: "value",
name: this.yName,
splitLine: {
//显示分割线
show: true,
},
},
],
series: [
{
name: "平均值",
type: "line",
data: this.avgData,
smooth: true,
emphasis: {
focus: "series",
},
itemStyle: {
normal: {
color: "#91cc75",
},
},
markLine: {
silent: true,
symbol: ["none", "arrow"],
itemStyle: {
normal: {
lineStyle: {
color: "#ff0000",
},
},
},
label: {
position: "end",
color: "#8c8c8c",
formatter: "{b}:{c}",
},
data: this.yaxisVOList
},
tooltip: {
valueFormatter: function (value) {
return value + that.yUnit
}
},
},
{
name: "最大值",
type: "line",
data: this.maxData,
smooth: true,
emphasis: {
focus: "series",
},
itemStyle: {
normal: {
color: "#ee6666",
},
},
tooltip: {
valueFormatter: function (value) {
return value + that.yUnit
}
},
// markLine: {
// silent: true,
// symbol: ["none", "arrow"],
// itemStyle: {
// normal: {
// lineStyle: {
// color: "#ff0000",
// },
// },
// },
// label: {
// position: "end",
// color: "#8c8c8c",
// formatter: "{b}:{c}",
// },
// data: [
// {
// name: "最大警戒值",
// yAxis: 4,
// },
// {
// name: "最小警戒值",
// yAxis: 1,
// },
// ],
// },
},
{
name: "最小值",
type: "line",
data: this.minData,
smooth: true,
emphasis: {
focus: "series",
},
itemStyle: {
normal: {
color: "#fac858",
},
},
tooltip: {
valueFormatter: function (value) {
return value + that.yUnit
}
},
// markLine: {
// silent: true,
// symbol: ["none", "arrow"],
// itemStyle: {
// normal: {
// lineStyle: {
// color: "#ff0000",
// },
// },
// },
// label: {
// position: "end",
// color: "#8c8c8c",
// formatter: "{b}:{c}",
// },
// data: [
// {
// name: "最大警戒值",
// yAxis: 4,
// },
// {
// name: "最小警戒值",
// yAxis: 1,
// },
// ],
// },
},
],
}
this.lineCharts.setOption(option);
this.lineCharts.off('click')
this.lineCharts.on("click", 'series.line', function (data) {
// 根据值获取点对应的列表数据
if (data) {
if (that.form.gas_data) {
let dataObject = {
gas_data: that.form.gas_data,
sn: that.form.uniqueid,
day: data.name,
peak: data.value
}
getDetail(dataObject).then(res => {
that.data = res.data.data
that.dialogVisible = true
})
} else {
that.$confirm("请先选择“分析内容”后再点击查询详情!", {
confirmButtonText: "确定",
cancelButtonText: "取消",
type: "warning"
})
.then(() => {
})
.then(() => {
});
}
}
});
},