1、前言
前一篇博客介绍了如何在OpenLayers中使用WebGLPoints加载海量数据点的方法,这篇博客就来介绍一下WebGLPoints图层的样式设置问题。
2、样式运算符
在VectorLayer图层中,我们只需要创建一个ol.style.Style对象即可,WebGLPoints则不同,它并不是基于Canvas进行绘制,因此其样式渲染不能直接使用ol.style.Style,取而代之的是使用样式运算符进行渲染。
2.1、读取运算符
1、['get', 'attributeName']
2、['var', 'varName']
3、['time']
4、['zoom']
5、['resolution']
2.2、数学运算符
1、['*', value1, value2]
2、['/', value1, value2]
3、['+', value1, value2]
4、['-', value1, value2]
5、['clamp', value, low, high]
6、['%', value1, value2]
7、['^', value1, value2]
2.3、变换运算符
1、['case', condition1, output1, ...conditionN, outputN, fallback]
2、['match', input, match1, output1, ...matchN, outputN, fallback]
3、['interpolate', interpolation, input, stop1, output1, ...stopN, outputN]
2.4、逻辑运算符
1、['<', value1, value2]
2、['<=', value1, value2]
3、['>', value1, value2]
4、['>=', value1, value2]
5、['==', value1, value2]
6、['!=', value1, value2]
7、['!', value1]
8、['between', value1, value2, value3]
2.5、转换运算符
1、['array', value1, ...valueN]
2、['color', red, green, blue, alpha]
3、样式渲染实例
上面列举了这么多的运算符,大家可能还是不清楚怎么使用它们。下面贴几个实例帮助大家理解。我这里准备了一份测试用的GeoJSON数据,就用它来说明。代码如下:
{
    "type": "FeatureCollection",
    "features": [
        {
            "type": "Feature",
            "geometry": {
                "type": "Point",
                "coordinates": [120.0, 30.0]
            },
            "properties": {
                "type": "学校",
                "dbm": 1
            }
        },
        {
            "type": "Feature",
            "geometry": {
                "type": "Point",
                "coordinates": [120.0, 30.1]
            },
            "properties": {
                "type": "学校",
                "dbm": 2
            }
        },
        {
            "type": "Feature",
            "geometry": {
                "type": "Point",
                "coordinates": [120.1, 30.0]
            },
            "properties": {
                "type": "超市",
                "dbm": 3
            }
        },
        {
            "type": "Feature",
            "geometry": {
                "type": "Point",
                "coordinates": [120.1, 30.1]
            },
            "properties": {
                "type": "超市",
                "dbm": 4
            }
        },
        {
            "type": "Feature",
            "geometry": {
                "type": "Point",
                "coordinates": [120.2, 30.0]
            },
            "properties": {
                "type": "医院",
                "dbm": 5
            }
        },
        {
            "type": "Feature",
            "geometry": {
                "type": "Point",
                "coordinates": [120.2, 30.1]
            },
            "properties": {
                "type": "医院",
                "dbm": 6
            }
        }
    ]
}
3.1、简单颜色渲染
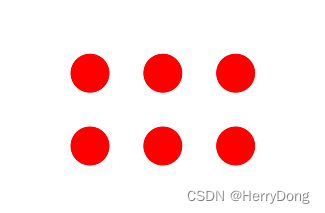
简单颜色渲染很简单,只需要使用['color', R, G, B, O]即可,第一个参数'color'是固定值,后面的参数依次为红、绿、蓝、透明度,代码如下:
<!DOCTYPE html>
<html lang="en">
<head>
    <meta charset="UTF-8">
    <meta name="viewport" content="width=device-width, initial-scale=1.0">
    <title>OpenLayers</title>
    <style>
        html,
        body,
        #map {
            width: 100%;
            height: 100%;
            margin: 0;
            padding: 0;
        }
    </style>
    <link rel="stylesheet" href="libs/ol/ol.css" />
    <script src="libs/ol/ol.js"></script>
</head>
<body>
    <div id="map"></div>
    <script>
        // 创建图层
        var layer = new ol.layer.WebGLPoints({
            source: new ol.source.Vector({
                url: 'data/point.json',
                format: new ol.format.GeoJSON(),
                wrapX: false
            }),
            style: {
                symbol:{
                    symbolType: 'circle',
                    size: 40,
                    color: ['color', 255, 0, 0, 1]
                }
            }
        });

        // 创建地图
        var map = new ol.Map({
            target: 'map',
            layers: [
                layer
            ],
            view: new ol.View({
                projection: 'EPSG:4326',
                center: [120, 30],
                zoom: 10
            })
        });
    </script>
</body>
</html>
运行结果如下图所示:
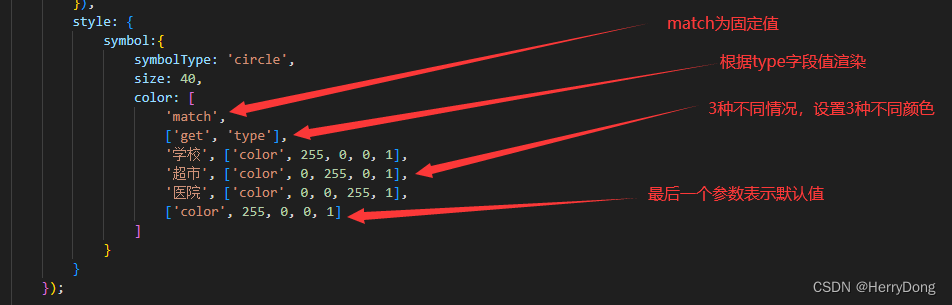
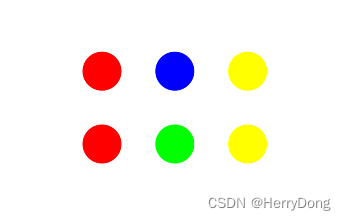
3.2、根据type字段值精确匹配渲染
在测试的GeoJSON数据中包含一个type字段,该字段表示学校、超市、医院。现在要求将学校渲染为红色、超市渲染为绿色、超市渲染为蓝色。那么第一个问题来了:如何获取字段值?其实很简单,使用读取运算符中的['get', 'type']即可,第一个参数'get'为固定值,第二个参数为字段名称,这里是'type'。第二个问题:如何进行情况分类?其实也很简单,使用变换运算符中的match即可,代码如下:
<!DOCTYPE html>
<html lang="en">
<head>
    <meta charset="UTF-8">
    <meta name="viewport" content="width=device-width, initial-scale=1.0">
    <title>OpenLayers</title>
    <style>
        html,
        body,
        #map {
            width: 100%;
            height: 100%;
            margin: 0;
            padding: 0;
        }
    </style>
    <link rel="stylesheet" href="libs/ol/ol.css" />
    <script src="libs/ol/ol.js"></script>
</head>
<body>
    <div id="map"></div>
    <script>
        // 创建图层
        var layer = new ol.layer.WebGLPoints({
            source: new ol.source.Vector({
                url: 'data/point.json',
                format: new ol.format.GeoJSON(),
                wrapX: false
            }),
            style: {
                symbol:{
                    symbolType: 'circle',
                    size: 40,
                    color: [
                        'match',
                        ['get', 'type'],
                        '学校', ['color', 255, 0, 0, 1],
                        '超市', ['color', 0, 255, 0, 1],
                        '医院', ['color', 0, 0, 255, 1],
                        ['color', 255, 0, 0, 1]
                    ]
                }
            }
        });

        // 创建地图
        var map = new ol.Map({
            target: 'map',
            layers: [
                layer
            ],
            view: new ol.View({
                projection: 'EPSG:4326',
                center: [120, 30],
                zoom: 10
            })
        });
    </script>
</body>
</html>
运行结果如下图所示:

3.3、根据dbm字段值的范围渲染
现在根据dbm值的范围进行渲染,规定:1<=dbm<=2渲染为红色,dbm=3渲染为绿色,dbm=4渲染为蓝色,5<=dbm<=6渲染为黄色,这时就该逻辑运算符和变换运算符同时登场了,代码如下:
<!DOCTYPE html>
<html lang="en">
<head>
    <meta charset="UTF-8">
    <meta name="viewport" content="width=device-width, initial-scale=1.0">
    <title>OpenLayers</title>
    <style>
        html,
        body,
        #map {
            width: 100%;
            height: 100%;
            margin: 0;
            padding: 0;
        }
    </style>
    <link rel="stylesheet" href="libs/ol/ol.css" />
    <script src="libs/ol/ol.js"></script>
</head>
<body>
    <div id="map"></div>
    <script>
        // 创建图层
        var layer = new ol.layer.WebGLPoints({
            source: new ol.source.Vector({
                url: 'data/point.json',
                format: new ol.format.GeoJSON(),
                wrapX: false
            }),
            style: {
                symbol: {
                    symbolType: 'circle',
                    size: 40,
                    color: [
                        'case',
                        ['between', ['get', 'dbm'], 1, 2], ['color', 255, 0, 0, 1],
                        ['==', ['get', 'dbm'], 3], ['color', 0, 255, 0, 1],
                        ['==', ['get', 'dbm'], 4], ['color', 0, 0, 255, 1],
                        ['between', ['get', 'dbm'], 5, 6], ['color', 255, 255, 0, 1],
                        ['color', 255, 0, 0, 1]
                    ]
                }
            }
        });

        // 创建地图
        var map = new ol.Map({
            target: 'map',
            layers: [
                layer
            ],
            view: new ol.View({
                projection: 'EPSG:4326',
                center: [120, 30],
                zoom: 10
            })
        });
    </script>
</body>
</html>
第一个参数'case'为固定值,['between', ['get', 'dbm'], 1, 2]表示获取的dbm值在1-2之间,['==', ['get', 'dbm'], 3]表示获取的dbm值恒等于3,运行结果如下图所示:
3.4、根据地图缩放等级渲染
看了上面的三个例子之后,相信你应该想到了,如果要根据地图缩放等级渲染,只需要使用读取运算符和变换运算符即可,现在要求:地图缩放等级<=10时渲染为红色、>10 and <=12时渲染为绿色、>12 and <=14时渲染为蓝色、其余等级为黄色,代码如下:
<!DOCTYPE html>
<html lang="en">
<head>
    <meta charset="UTF-8">
    <meta name="viewport" content="width=device-width, initial-scale=1.0">
    <title>OpenLayers</title>
    <style>
        html,
        body,
        #map {
            width: 100%;
            height: 100%;
            margin: 0;
            padding: 0;
        }
    </style>
    <link rel="stylesheet" href="libs/ol/ol.css" />
    <script src="libs/ol/ol.js"></script>
</head>
<body>
    <div id="map"></div>
    <script>
        // 创建图层
        var layer = new ol.layer.WebGLPoints({
            source: new ol.source.Vector({
                url: 'data/point.json',
                format: new ol.format.GeoJSON(),
                wrapX: false
            }),
            style: {
                symbol: {
                    symbolType: 'circle',
                    size: 40,
                    color: [
                        'case',
                        ['<=', ['zoom'], 10], ['color', 255, 0, 0, 1],
                        ['<=', ['zoom'], 12], ['color', 0, 255, 0, 1],
                        ['<=', ['zoom'], 14], ['color', 0, 0, 255, 1],
                        ['color', 255, 255, 0, 1]
                    ]
                }
            }
        });

        // 创建地图
        var map = new ol.Map({
            target: 'map',
            layers: [
                layer
            ],
            view: new ol.View({
                projection: 'EPSG:4326',
                center: [120, 30],
                zoom: 10
            })
        });
    </script>
</body>
</html>
运行结果如下图所示:

3.5、根据地图分辨率渲染
根据地图分辨率渲染也很简单,只需要调用['resolution']即可。不过考虑到resolution值是一个小数,因此我们这里将resolution乘以10000之后再进行渲染,代码如下:
<!DOCTYPE html>
<html lang="en">
<head>
    <meta charset="UTF-8">
    <meta name="viewport" content="width=device-width, initial-scale=1.0">
    <title>OpenLayers</title>
    <style>
        html,
        body,
        #map {
            width: 100%;
            height: 100%;
            margin: 0;
            padding: 0;
        }
    </style>
    <link rel="stylesheet" href="libs/ol/ol.css" />
    <script src="libs/ol/ol.js"></script>
</head>
<body>
    <div id="map"></div>
    <script>
        // 创建图层
        var layer = new ol.layer.WebGLPoints({
            source: new ol.source.Vector({
                url: 'data/point.json',
                format: new ol.format.GeoJSON(),
                wrapX: false
            }),
            style: {
                symbol: {
                    symbolType: 'circle',
                    size: 40,
                    color: [
                        'case',
                        ['<=', ['*', ['resolution'], 10000], 2], ['color', 255, 0, 0, 1],
                        ['<=', ['*', ['resolution'], 10000], 3], ['color', 0, 255, 0, 1],
                        ['<=', ['*', ['resolution'], 10000], 4], ['color', 0, 0, 255, 1],
                        ['<=', ['*', ['resolution'], 10000], 5], ['color', 255, 255, 0, 1],
                        ['<=', ['*', ['resolution'], 10000], 6], ['color', 255, 0, 255, 1],
                        ['<=', ['*', ['resolution'], 10000], 7], ['color', 0, 255, 255, 1],
                        ['color', 300, 200, 100, 1]
                    ]
                }
            }
        });

        // 创建地图
        var map = new ol.Map({
            target: 'map',
            layers: [
                layer
            ],
            view: new ol.View({
                projection: 'EPSG:4326',
                center: [120, 30],
                zoom: 10
            })
        });
    </script>
</body>
</html>
运行结果如下图所示:

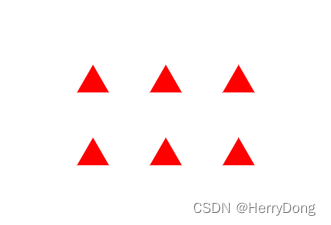
4、其他的一些渲染参数
除了color属性之外,symbol的其它参数也可对样式渲染起到作用。比如symbolType参数,它可以设置为circle、triangle、square、image。设置为triangle时为三角形,如下图所示:
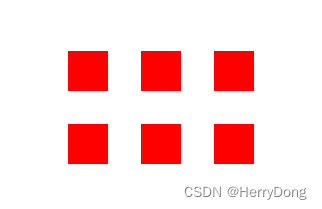
设置为square时为正方形,如下图所示:
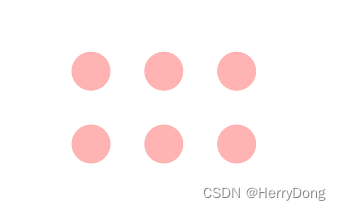
opacity表示透明度,例如将透明度设置为0.3:
<!DOCTYPE html>
<html lang="en">
<head>
    <meta charset="UTF-8">
    <meta name="viewport" content="width=device-width, initial-scale=1.0">
    <title>OpenLayers</title>
    <style>
        html,
        body,
        #map {
            width: 100%;
            height: 100%;
            margin: 0;
            padding: 0;
        }
    </style>
    <link rel="stylesheet" href="libs/ol/ol.css" />
    <script src="libs/ol/ol.js"></script>
</head>
<body>
    <div id="map"></div>
    <script>
        // 创建图层
        var layer = new ol.layer.WebGLPoints({
            source: new ol.source.Vector({
                url: 'data/point.json',
                format: new ol.format.GeoJSON(),
                wrapX: false
            }),
            style: {
                symbol: {
                    symbolType: 'circle',
                    size: 40,
                    color: ['color', 255, 0, 0, 1],
                    opacity: 0.3
                }
            }
        });

        // 创建地图
        var map = new ol.Map({
            target: 'map',
            layers: [
                layer
            ],
            view: new ol.View({
                projection: 'EPSG:4326',
                center: [120, 30],
                zoom: 10
            })
        });
    </script>
</body>
</html>
运行结果如下图所示:
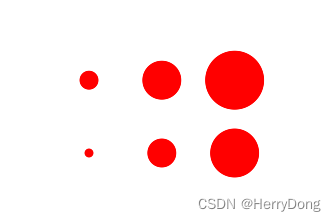
不仅是color,其实size参数也可以使用样式表达式,例如根据dbm值生成不同大小的要素,代码如下:
<!DOCTYPE html>
<html lang="en">
<head>
    <meta charset="UTF-8">
    <meta name="viewport" content="width=device-width, initial-scale=1.0">
    <title>OpenLayers</title>
    <style>
        html,
        body,
        #map {
            width: 100%;
            height: 100%;
            margin: 0;
            padding: 0;
        }
    </style>
    <link rel="stylesheet" href="libs/ol/ol.css" />
    <script src="libs/ol/ol.js"></script>
</head>
<body>
    <div id="map"></div>
    <script>
        // 创建图层
        var layer = new ol.layer.WebGLPoints({
            source: new ol.source.Vector({
                url: 'data/point.json',
                format: new ol.format.GeoJSON(),
                wrapX: false
            }),
            style: {
                symbol: {
                    symbolType: 'circle',
                    size: [
                        'case',
                        ['==', ['get', 'dbm'], 1], 10,
                        ['==', ['get', 'dbm'], 2], 20,
                        ['==', ['get', 'dbm'], 3], 30,
                        ['==', ['get', 'dbm'], 4], 40,
                        ['==', ['get', 'dbm'], 5], 50,
                        ['==', ['get', 'dbm'], 6], 60,
                        20
                    ],
                    color: ['color', 255, 0, 0, 1],
                }
            }
        });

        // 创建地图
        var map = new ol.Map({
            target: 'map',
            layers: [
                layer
            ],
            view: new ol.View({
                projection: 'EPSG:4326',
                center: [120, 30],
                zoom: 10
            })
        });
    </script>
</body>
</html>
5、结语
本文主要介绍了OpenLayers中WebGLPoints图层的样式设置方法。其实刚接触样式表达式的时候觉得这种方法很反人类,但是习惯之后发现它的灵活度很高,本文也只列举了一些常见的用法,有兴趣的同志可以去官网查看更详细的文档。