Hey 好久不见,大家一看三月中下旬这个时间节点也应该能猜到这篇更新什么内容,没错MATLAB R2024a正式版发布啦啦拉拉,直接来看看有啥我认为比较有意思的更新点吧:
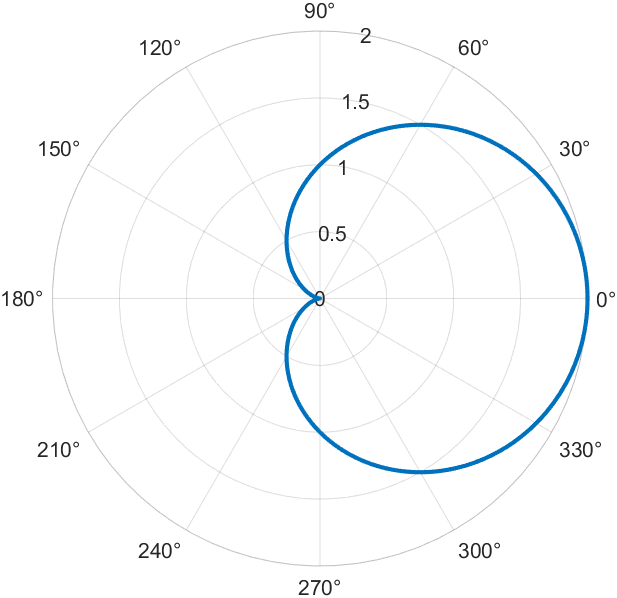
1 极坐标表达式绘制
将会使用使用fpolarplot函数来替换ezpolar:
f = @(t) 1 + cos(t);
fpolarplot(f)
% fpolarplot(f,LineWidth=2)
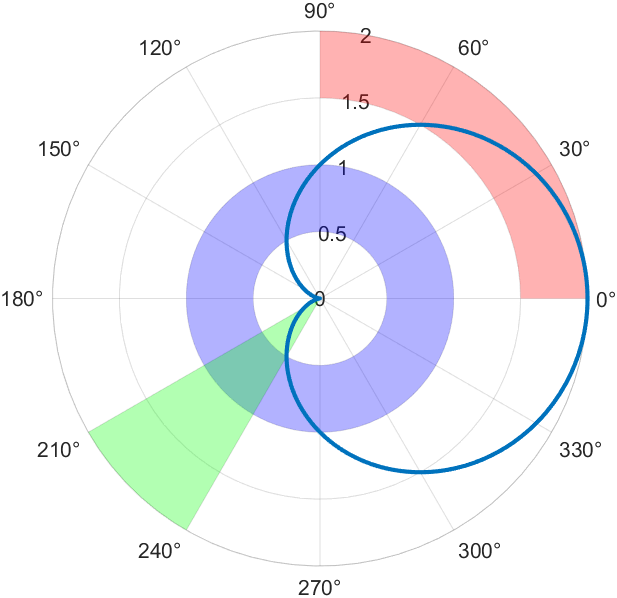
2 极坐标填充区域
使用thetaregion,radiusregion和polarregion函数。填充区域用于高亮显示绘图:
f = @(t) 1 + cos(t);
fpolarplot(f,LineWidth=2)

% 极坐标半径填充
radiusregion([0.5,1],'FaceColor','b')

% 极坐标角度填充
thetaregion([pi/6,pi/3]+pi,'FaceColor','g')

% 极坐标区域填充
thetas = [0 pi/2];
radii = [1.5 2];
polarregion(thetas,radii,'FaceColor','r')
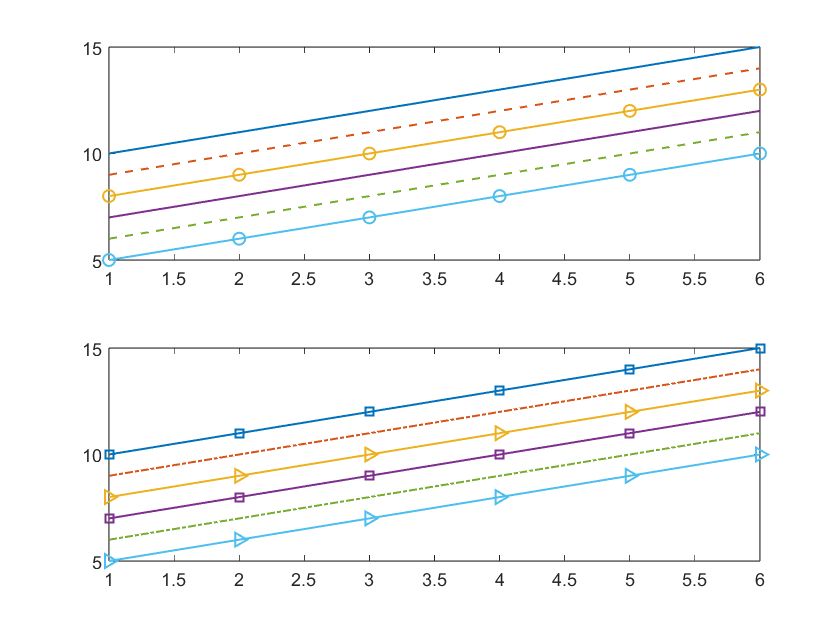
3 线条样式
可以使用linestyleorder函数设置线条样式的出现规律:
Y = (10:15)'-(0:5);
tiledlayout(2,1)
ax1 = nexttile;
plot(ax1,Y,LineWidth=1)
ax2 = nexttile;
plot(ax2,Y,LineWidth=1)

% 设置坐标区域1线条样式
linestyles1 = ["-","--","-o"];
linestyleorder(ax1, linestyles1)
% 设置坐标区域2线条样式
linestyles2 = ["-s","-.","->"];
linestyleorder(ax2, linestyles2)
4 RGB和16进制颜色转换
rgb2hex和hex2rgb:
RGB = [0.60 0.30 0.80];
rgb2hex(RGB)
% ans =
% "#994DCC"

hexStr = "#CD00EF";
hex2rgb(hexStr)
% ans = 1×3
%    0.8039         0    0.9373
当然我很久很久以前写过类似的东西:
function string=ten2sixteen(num)
%the num should be a 1x3 Integer mat limited in [0 255]
exchange_list={'0','1','2','3','4','5','6','7','8','9','A','B','C','D','E','F'};
string='#';
for i=1:3
    temp_num=num(i);
    string(1+i*2-1)=exchange_list{(temp_num-mod(temp_num,16))/16+1};
    string(1+i*2)=exchange_list{mod(temp_num,16)+1};
end
end

% ten2sixteen([20,30,255])
% ans =
%    '#141EFF'

function num=sixteen2ten(string)
    exchange_list='0123456789ABCDEF#';
    num=zeros(1,3);
    for i=1:3
        tempCoe1=find(exchange_list==string(i*2))-1;
        tempCoe2=find(exchange_list==string(i*2+1))-1;
        num(i)=16*tempCoe1+tempCoe2;
    end
end

% sixteen2ten('#26FF06')
% ans =
%     38   255     6
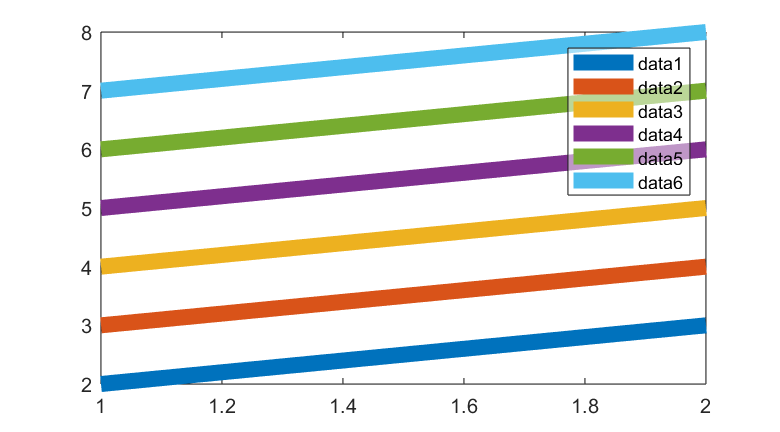
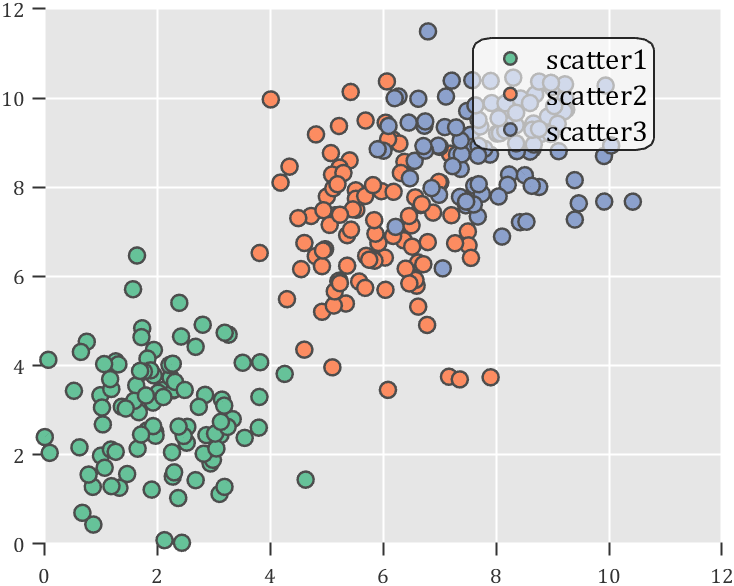
5 图例及矩形透明度
您可以控制图例框和矩形的透明度:
- 通过设置BackgroundAlpha的属性,将图例对象透明度设置为介于0(完全透明)和 1(不透明)
- 通过设置FaceAlpha的属性,将矩形对象透明度设置为介于0和1 .
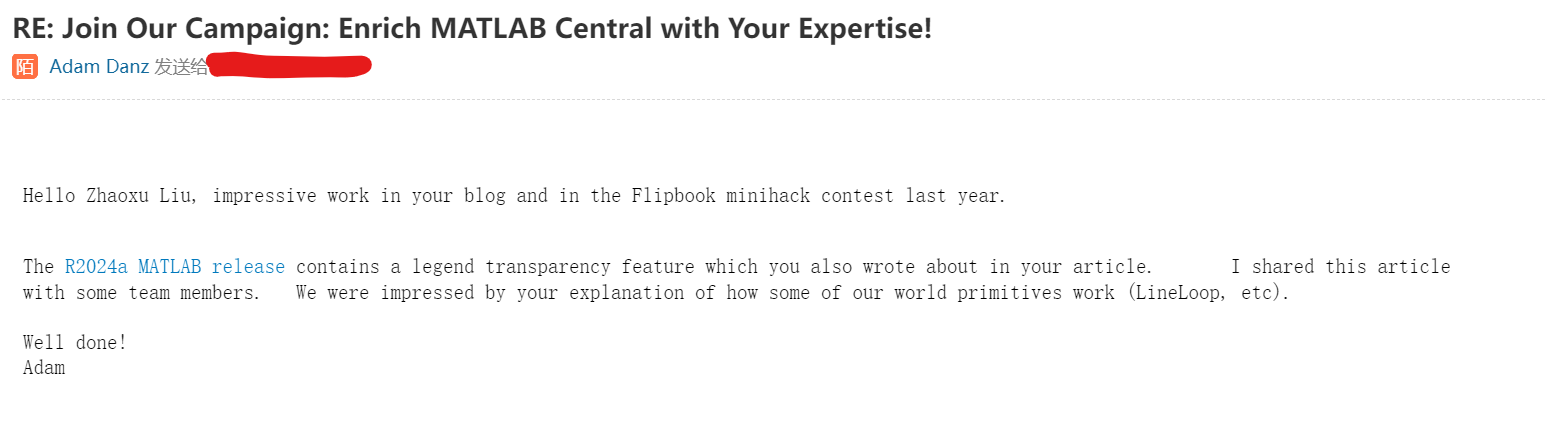
说来有趣,之前参加迷你黑客大赛后,官方Graphics Team询问有没有想要分享的技巧:

我就分享了关于实现圆角半透明图例的知乎文章:
然后比较巧的是,官方团队正好也打算在R2024a版本发布这个功能,属于正巧撞上了:
X=1:2;
Y=(1:2)+(1:6)';
plot(X,Y,'LineWidth',8);

legend('BackgroundAlpha',.5)
展示一下我之前写的功能函数和效果:
function SPrettyLegend(lgd)
% Semitransparent rounded rectangle legend
% Copyright (c) 2023, Zhaoxu Liu / slandarer
% -------------------------------------------------------------------------
% Zhaoxu Liu / slandarer (2023). pretty legend
% (https://www.mathworks.com/matlabcentral/fileexchange/132128-pretty-legend),
% MATLAB Central File Exchange. 检索来源 2023/7/9.
% =========================================================================
if nargin<1
    ax = gca;
    lgd = get(ax,'Legend');
end
pause(1e-6)
Ratio = .1;
t1 = linspace(0,pi/2,4); t1 = t1([1,2,2,3,3,4]);
t2 = linspace(pi/2,pi,4); t2 = t2([1,2,2,3,3,4]);
t3 = linspace(pi,3*pi/2,4); t3 = t3([1,2,2,3,3,4]);
t4 = linspace(3*pi/2,2*pi,4); t4 = t4([1,2,2,3,3,4]);
XX = [1,1,1-Ratio+cos(t1).*Ratio,1-Ratio,Ratio,Ratio+cos(t2).*Ratio,...
    0,0,Ratio+cos(t3).*Ratio,Ratio,1-Ratio,1-Ratio+cos(t4).*Ratio];
YY = [Ratio,1-Ratio,1-Ratio+sin(t1).*Ratio,1,1,1-Ratio+sin(t2).*Ratio,...
    1-Ratio,Ratio,Ratio+sin(t3).*Ratio,0,0,Ratio+sin(t4).*Ratio];
% 圆角边框(border-radius)
oriBoxEdgeHdl = lgd.BoxEdge;
newBoxEdgeHdl = matlab.graphics.primitive.world.LineStrip();
newBoxEdgeHdl.AlignVertexCenters = 'off';
newBoxEdgeHdl.Layer = 'front';
newBoxEdgeHdl.ColorBinding = 'object';
newBoxEdgeHdl.LineWidth = 1;
newBoxEdgeHdl.LineJoin = 'miter';
newBoxEdgeHdl.WideLineRenderingHint = 'software';
newBoxEdgeHdl.ColorData = uint8([38;38;38;0]);
newBoxEdgeHdl.VertexData = single([XX;YY;XX.*0]);
newBoxEdgeHdl.Parent=oriBoxEdgeHdl.Parent;
oriBoxEdgeHdl.Visible='off';
% 半透明圆角背景(Semitransparent rounded background)
oriBoxFaceHdl = lgd.BoxFace;
newBoxFaceHdl = matlab.graphics.primitive.world.TriangleStrip();
Ind = [1:(length(XX)-1);ones(1,length(XX)-1).*(length(XX)+1);2:length(XX)];
Ind = Ind(:).';
newBoxFaceHdl.PickableParts = 'all';
newBoxFaceHdl.Layer = 'back';
newBoxFaceHdl.ColorBinding = 'object';
newBoxFaceHdl.ColorType = 'truecoloralpha';
newBoxFaceHdl.ColorData = uint8(255*[1;1;1;.6]);
newBoxFaceHdl.VertexData = single([XX,.5;YY,.5;XX.*0,0]);
newBoxFaceHdl.VertexIndices = uint32(Ind);
newBoxFaceHdl.Parent = oriBoxFaceHdl.Parent;
oriBoxFaceHdl.Visible = 'off';
end
使用效果
clc; clear; close all
rng(12)
% 生成随机点(Generate random points)
mu = [2 3; 6 7; 8 9];
S  = cat(3,[1 0; 0 2],[1 0; 0 2],[1 0; 0 1]);
r1 = abs(mvnrnd(mu(1,:),S(:,:,1),100));
r2 = abs(mvnrnd(mu(2,:),S(:,:,2),100));
r3 = abs(mvnrnd(mu(3,:),S(:,:,3),100));
% 绘制散点图(Draw scatter chart)
hold on
propCell = {'LineWidth',1.2,'MarkerEdgeColor',[.3,.3,.3],'SizeData',60};
scatter(r1(:,1),r1(:,2),'filled','CData',[0.40 0.76 0.60],propCell{:});
scatter(r2(:,1),r2(:,2),'filled','CData',[0.99 0.55 0.38],propCell{:});
scatter(r3(:,1),r3(:,2),'filled','CData',[0.55 0.63 0.80],propCell{:});
% 增添图例(Draw legend)
lgd = legend('scatter1','scatter2','scatter3');
lgd.Location = 'northwest';
lgd.FontSize = 14;
% 坐标区域基础修饰(Axes basic decoration)
ax=gca; grid on
ax.FontName   = 'Cambria';
ax.Color      = [0.9,0.9,0.9];
ax.Box        = 'off';
ax.TickDir    = 'out';
ax.GridColor  = [1 1 1];
ax.GridAlpha  = 1;
ax.LineWidth  = 1;
ax.XColor     = [0.2,0.2,0.2];
ax.YColor     = [0.2,0.2,0.2];
ax.TickLength = [0.015 0.025];
% 隐藏轴线(Hide XY-Ruler)
pause(1e-6)
ax.XRuler.Axle.LineStyle = 'none';
ax.YRuler.Axle.LineStyle = 'none';

SPrettyLegend(lgd)
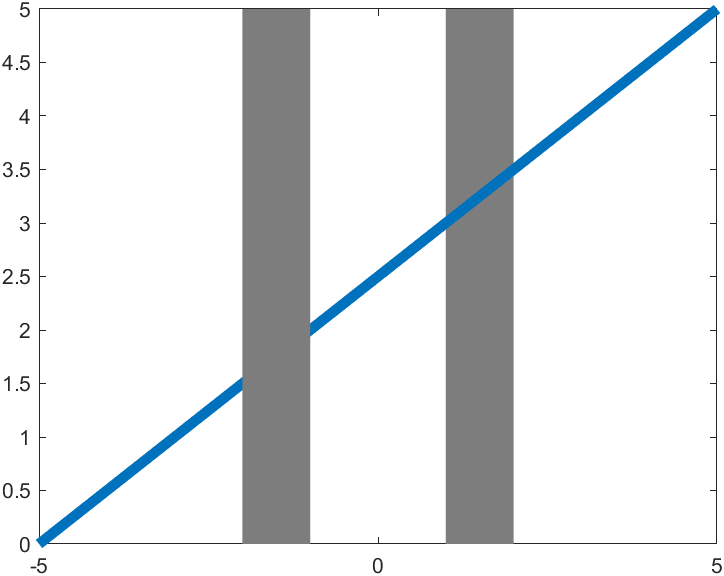
6 常量线和常值区域层级
可以调节常量线(使用xline或者yline创造的对象),以及常值区域(使用xregion和yregion创建的对象)的层次(位于顶层还是底层):
plot([-5,5],[0,5],'LineWidth',5)
xr = xregion([-2 1],[-1 2],'FaceAlpha',1);
xr(1).Layer = "top";
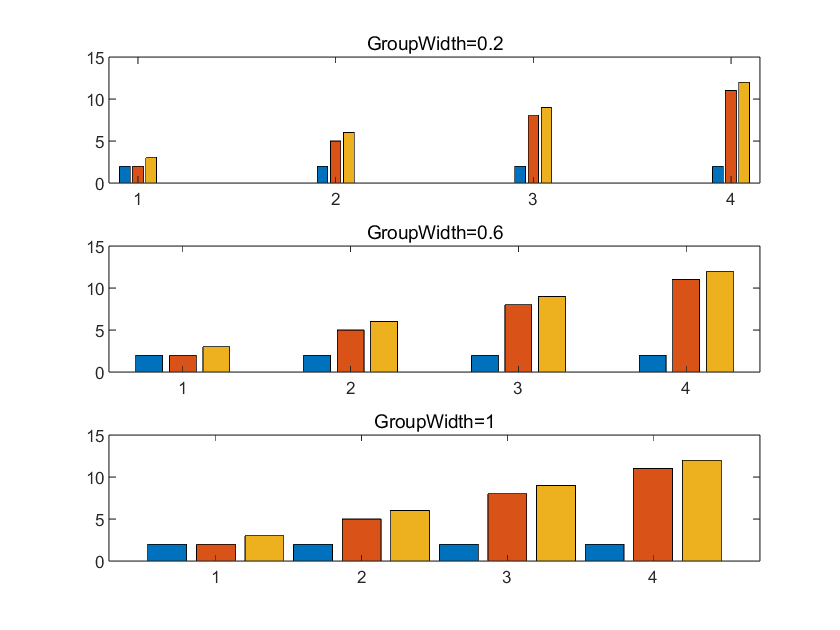
7 柱状图组间距
设置GroupWidth属性设置柱状图组间距:
y = [2 2 3; 2 5 6; 2 8 9; 2 11 12];

subplot(3,1,1)
bar(y,'GroupWidth',.2)
title('GroupWidth=0.2')

subplot(3,1,2)
bar(y,'GroupWidth',.6)
title('GroupWidth=0.6')

subplot(3,1,3)
bar(y,'GroupWidth',1)
title('GroupWidth=1')
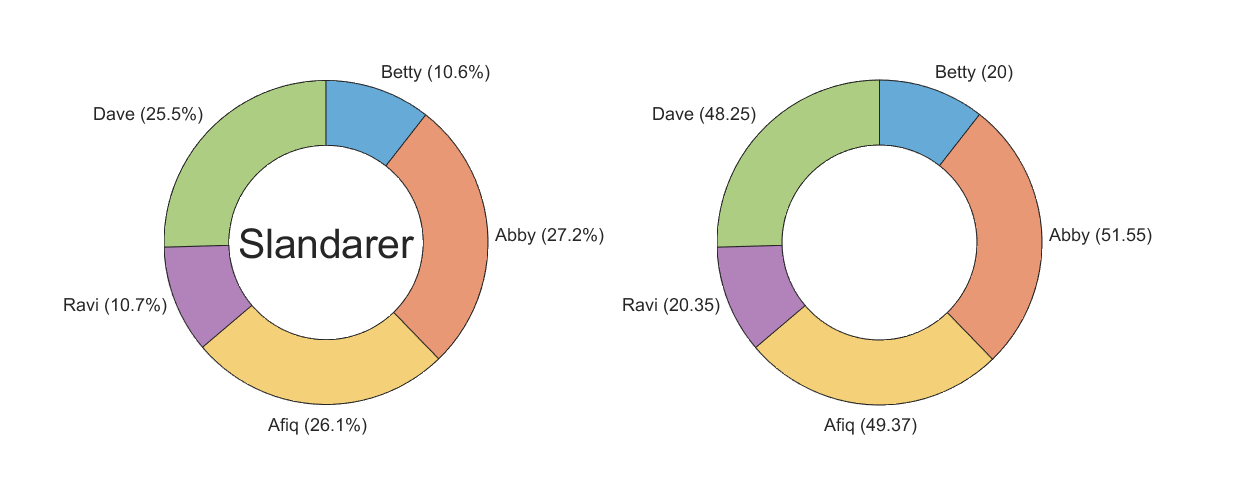
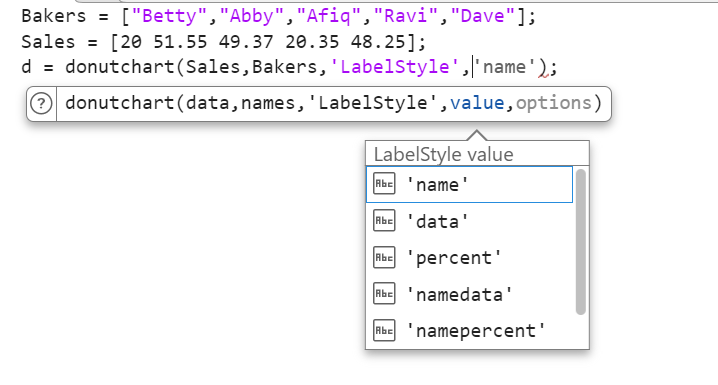
8 甜甜圈图标签格式
有六种甜甜圈图标签格式,同时可以设置中心标签:
Bakers = ["Betty","Abby","Afiq","Ravi","Dave"];
Sales = [20 51.55 49.37 20.35 48.25];
subplot(1,2,1)
donutchart(Sales,Bakers,'LabelStyle','namepercent','CenterLabel','Slandarer');

subplot(1,2,2)
donutchart(Sales,Bakers,'LabelStyle','namedata');
9 图像导出函数升级
在调用exportgraphics函数时
使用以下名称值参数控制图像导出:
- Width,Height-指定输出的宽度和高度。
- Padding-指定图形周长周围的填充量。
- Units-指定宽度、高度和填充值的单位。
- PreserveAspectRatio-指定是否自动添加填充以保留原始纵横比,如果宽度和高度值与图形的原始纵横比冲突。
详情请见:
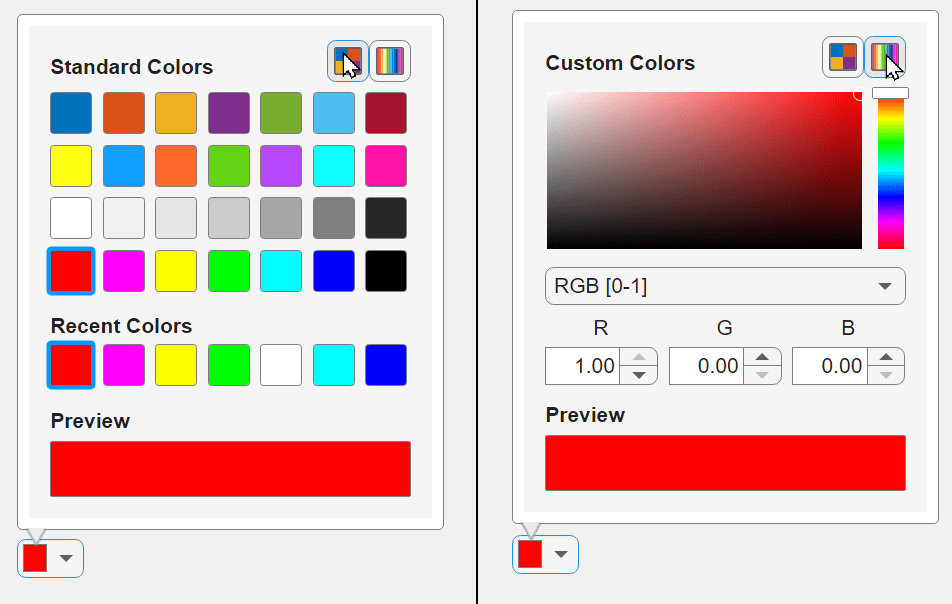
10 颜色选择器置于App窗口上
fig = uifigure;
c = uicolorpicker(fig);

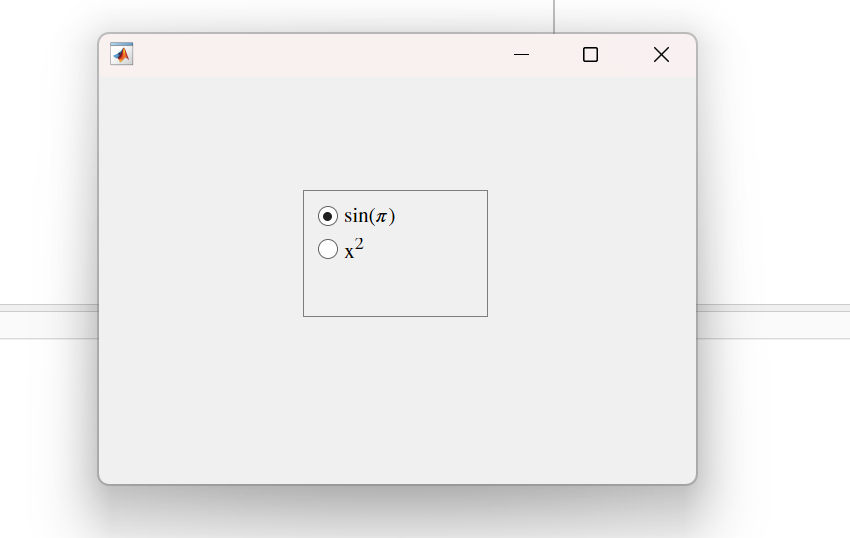
11 App单选按钮HTML及tex
设置Interpreter属性,比如显示公式:
fig = uifigure('Position',[680 678 398 271]);
bg = uibuttongroup(fig,'Position',[137 113 123 85]);


rb1 = uiradiobutton(bg,'Position',[10 60 91 15],'Interpreter','tex');
rb2 = uiradiobutton(bg,'Position',[10 38 91 15],'Interpreter','tex');

rb1.Text = 'sin(\pi)';
rb2.Text = 'x^2';
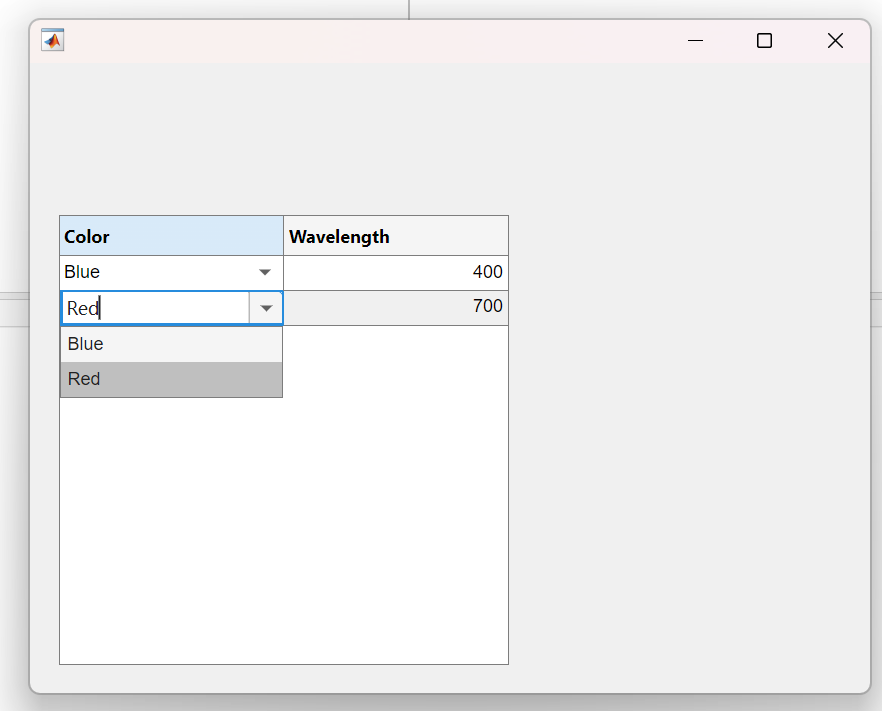
12 具有下拉表的表格
fig = uifigure;
cnames = categorical({'Blue';'Red'},{'Blue','Red'});
w = [400; 700];
tdata = table(cnames,w,'VariableNames',{'Color','Wavelength'});
uit = uitable(fig,'Data',tdata,'ColumnEditable',true);
13 在脚本和实时脚本中的任意位置定义函数
以前函数只能定义在脚本末尾,现在可以定义在任意位置了:

14 初始矩阵创建
使用createArray函数几乎可以创建任意类型的矩阵,比如:
p = uint8(7 + 3i)
% p = uint8
%    7 +   3i
X = createArray(3,Like=p)
% X = 3×3 uint8 矩阵
%    0 +   0i   0 +   0i   0 +   0i
%    0 +   0i   0 +   0i   0 +   0i
%    0 +   0i   0 +   0i   0 +   0i

P = createArray(3,FillValue=single(pi))
% P = 3x3 single matrix
%     3.1416    3.1416    3.1416
%     3.1416    3.1416    3.1416
%     3.1416    3.1416    3.1416
这个函数的使用方式比较复杂,详情请见:
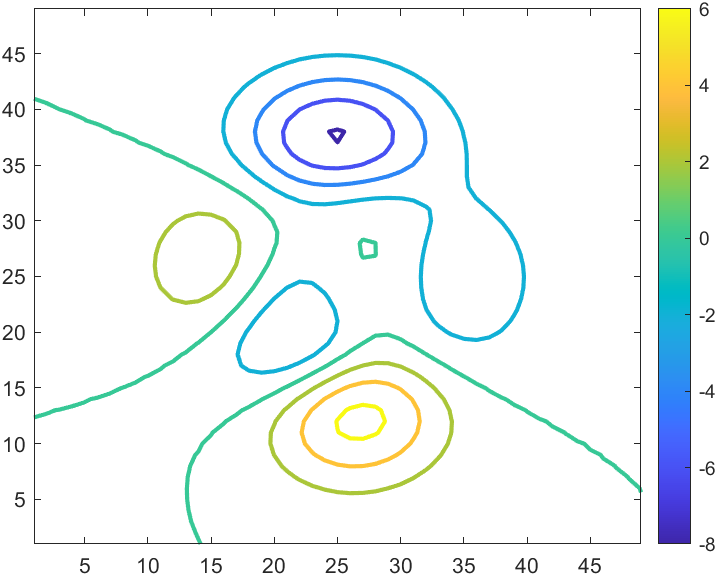
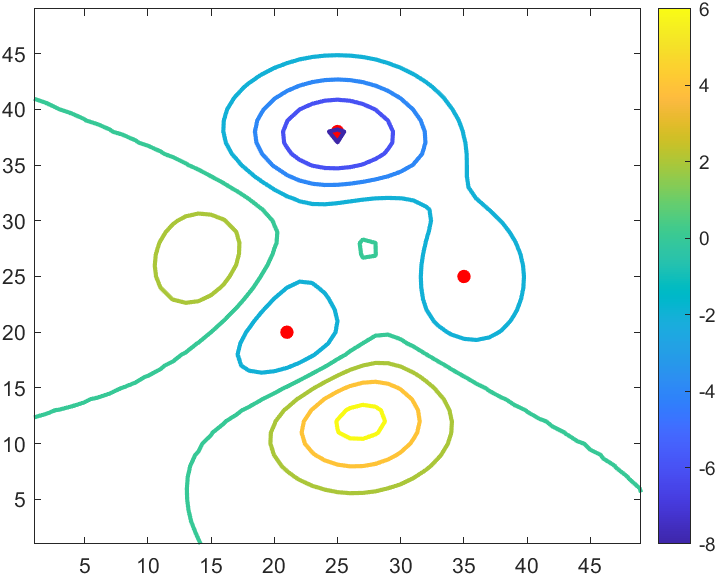
15 局部最值获取
通过islocalmin2及islocalmax2获取局部最值,例如:
A = -peaks;
contour(A,'LineWidth',2)
colorbar

% 获取最小值位置
TF = islocalmin2(A);
minval = A(TF);
[X,Y] = meshgrid(1:49,1:49);
hold on
plot3(X(TF),Y(TF),minval,"red.",MarkerSize=22)
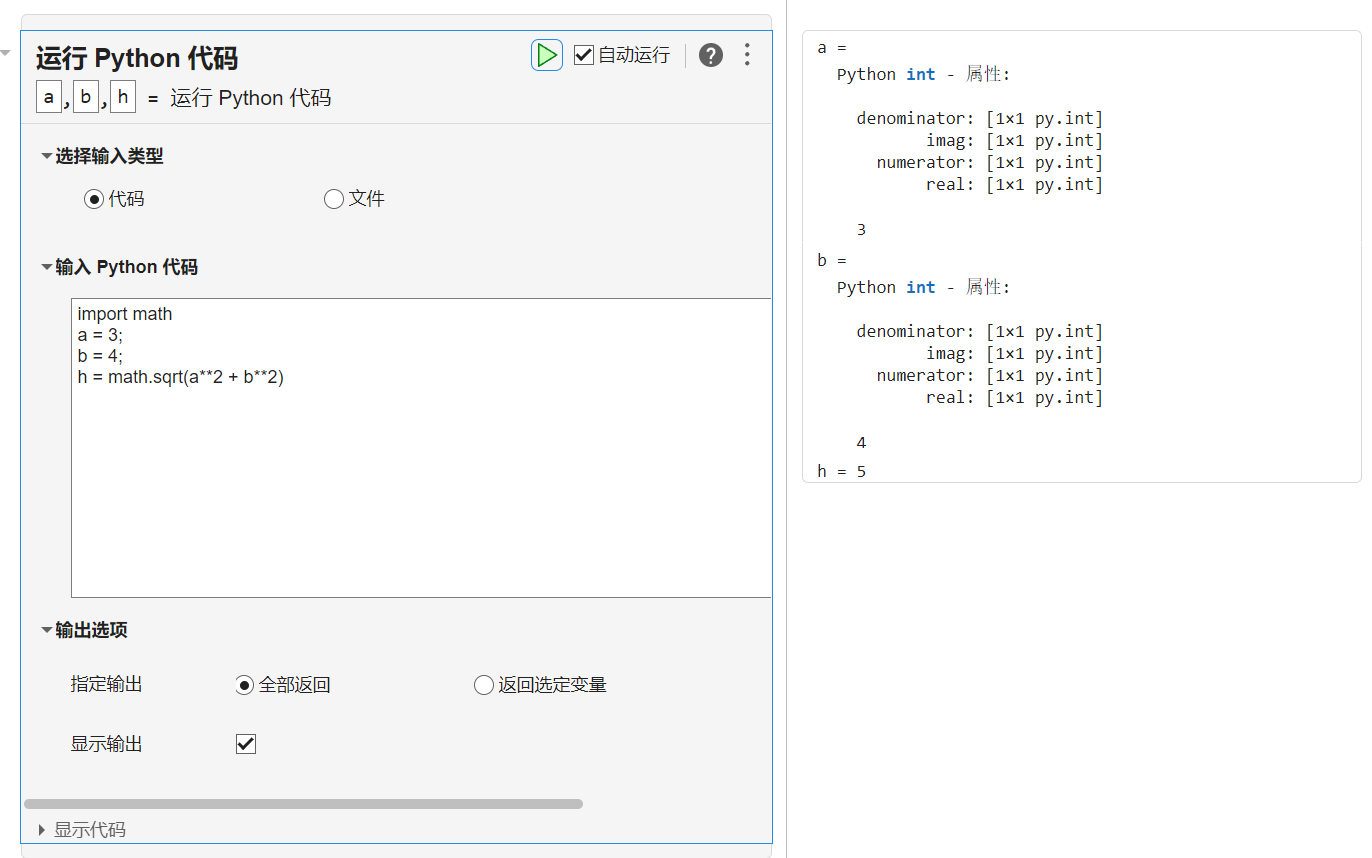
16 实时编辑器运行python代码

完
这期的更新远远不止上面提到的那些,还有很多更新,但是篇幅有限,这里便不再一一提及,其他更新比如数学方面更新了求解N维数组的伪逆以及线性方程组的最小范数最小二乘解,ui控件比如App designer可以和simulink交互了,此外还有无数的效率提高,比如读取大型JPEG图像比上一版本快1.5倍,生成一个大JPEG图像比上一版本快1.6倍,提高了各种数据格式解析的能力。
除了MATLAB本体外,主要对以下六个工具箱进行了更新,请自行查看:
- Computer Vision Toolbox
- Deep Learning Toolbox
- GPU Coder
- Instrument Control Toolbox
- Satellite Communications Toolbox
- UAV Toolbox
更多更新内容请见:


![[蓝桥杯 2022 国 B] 出差(P8802)](https://img-blog.csdnimg.cn/direct/bf7c7cf712e747e7a29fcf0cec32f2f7.png)