<template>
<div id="main" class="echart-style">
</div>
</template>
<script setup lang="ts">
import * as echarts from 'echarts';
import { onMounted, ref } from 'vue';
let myChart = ref()
let option = ref({})
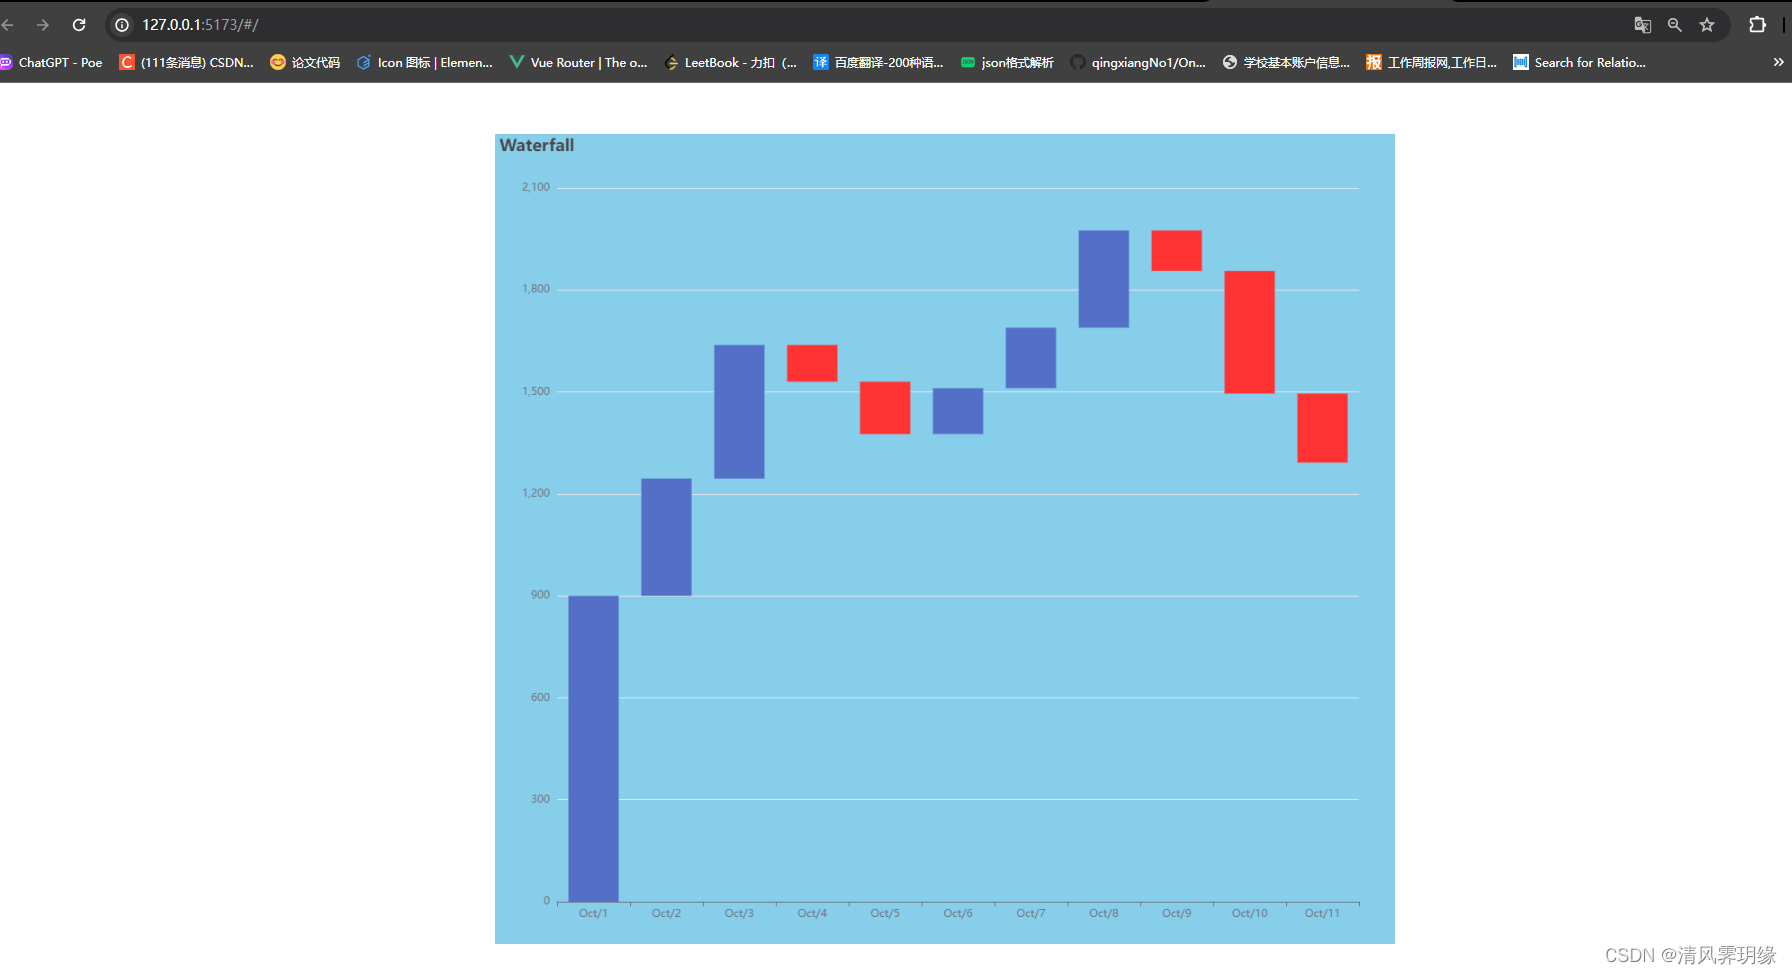
let data = ref([900, 345, 393, -108, -154, 135, 178, 286, -119, -361, -203]);
let help: any = [];
let positive: any = [];
let negative: any = [];
for (let i = 0, sum = 0; i < data.value.length; ++i) {
if (data.value[i] >= 0) {
positive.push(data.value[i]);
negative.push('-');
} else {
positive.push('-');
negative.push(-data.value[i]);
}
if (i === 0) {
help.push(0);
} else {
sum += data.value[i - 1];
if (data.value[i] < 0) {
help.push(sum + data.value[i]);
} else {
help.push(sum);
}
}
}
onMounted(() => {
init()
})
const init = () => {
// 基于准备好的dom,初始化echarts实例
myChart.value = echarts.init(document.getElementById('main'));
// 绘制图表
option.value = {
title: {
text: 'Waterfall'
},
grid: {
left: '3%',
right: '4%',
bottom: '3%',
containLabel: true
},
xAxis: {
type: 'category',
splitLine: { show: false },
data: (function () {
var list = [];
for (var i = 1; i <= 11; i++) {
list.push('Oct/' + i);
}
return list;
})()
},
yAxis: {
type: 'value'
},
series: [
{
type: 'bar',
stack: 'all',
itemStyle: {
normal: {
barBorderColor: 'rgba(0,0,0,0)',
color: 'rgba(0,0,0,0)'
},
emphasis: {
barBorderColor: 'rgba(0,0,0,0)',
color: 'rgba(0,0,0,0)'
}
},
data: help
},
{
name: 'positive',
type: 'bar',
stack: 'all',
data: positive
},
{
name: 'negative',
type: 'bar',
stack: 'all',
data: negative,
itemStyle: {
color: '#f33'
}
}
]
};
myChart.value.setOption(option.value)
};
</script>
<style scoped>
.echart-style {
width: 1000px;
height: 900px;
background: skyblue;
}
</style>