一、业务场景:
最近在vue中使用echarts时 有多处需要用到各种图表,想着自己封装一个便于多次复用
为了避免大家走弯路,为大家整理了一下,粘走可以直接用的那种
二、具体实现步骤:
1、先在终端安装echarts
npm install echarts --save
2、在main.js中引入(这里分5.0以上和以下两个版本来安装)
5.0以上版本
import * as echarts from 'echarts'
5.0以下版本
import echarts from 'echarts'
注册在原型上 `
vue.prototype.$echarts = echarts
3、创建图表组件(Echarts)
随机搞一个id
其他内容都由父组件传过来
代码如下:
<template>
  <div>
    <!-- 为 ECharts 准备一个定义了宽高的 DOM -->
    <div :id="uuid" :style="style"></div>
  </div>

</template>

<script>

    export default {
      name: "MyCharts",
      props:{
        dataSource:{
          type:Object,
          default:null,
          require:true
        },
        canvasWidth:{
          type:String,
          default:'',
          require:true
        },
        canvasHeight:{
          type:String,
          default:'',
          require:true
        },
      },
      data() {
        return {
          uuid:undefined,
          myChart:null,
        }
      },
      computed:{
          style(){
            return {
              width: this.canvasWidth,
              height:this.canvasHeight
            }
          }
      },
      created() {
          // 时间戳+随机字符
        	this.uuid = new Date().getTime()+Math.random().toString(32).slice(2, 10)
      },
      mounted() {
        	this.init()
      },
      methods:{
        init(){
          // 基于准备好的dom,初始化echarts实例
          this.myChart = this.$echarts.init(document.getElementById(this.uuid));
            // 绘制图表
          this.myChart.setOption(this.dataSource);
        }
      }
    }
</script>

<style scoped>

</style>
4、在src下新建一个js文件(dataSource.js),把数据单独提出来
代码如下:
export const dataSource2 = {
  title: {
    text: 'Are you OK?'
  },
  tooltip: {},
  xAxis: {
    data: ['魄力', '建议', '先干', '成了', '马拉松', '成败得失']
  },
  yAxis: {},
  series: [
    {
      name: '小米',
      type: 'bar',
      data: [60, 45, 52, 38, 49, 55]
    }
  ]
}
export const dataSource = {
  title: {
    text: '生死看淡,不服就干'
  },
  tooltip: {},
  xAxis: {
    data: ['梦想', '坚持', '力量', '美好', '坚韧', '东西']
  },
  yAxis: {},
  series: [
    {
      name: '雷总',
      type: 'bar',
      data: [50, 80, 66, 70, 69, 71]
    }
  ]
}
5、在父组件中引入图表组件
代码如下:
<template>
    <div>
      <MyCharts :dataSource="dataSource" :canvasWidth="canvasWidth" :canvasHeight="canvasHeight"></MyCharts>
      <MyCharts :dataSource="dataSource2" :canvasWidth="canvasWidth" :canvasHeight="canvasHeight"></MyCharts>
    </div>
</template>
<script>
    import MyCharts from "@/components/mycharts/MyCharts";
    import {dataSource,dataSource2} from "@/dataSource";
    export default {
        name: "CrudPage",
      components: {MyCharts},
      data() {
        return {
          canvasWidth:'600px',
          canvasHeight:'400px',
          dataSource:dataSource,
          dataSource2:dataSource2
        }
      },
      created() {

      },
      methods:{

      }
    }
</script>

<style scoped>

</style>
四、效果展示:
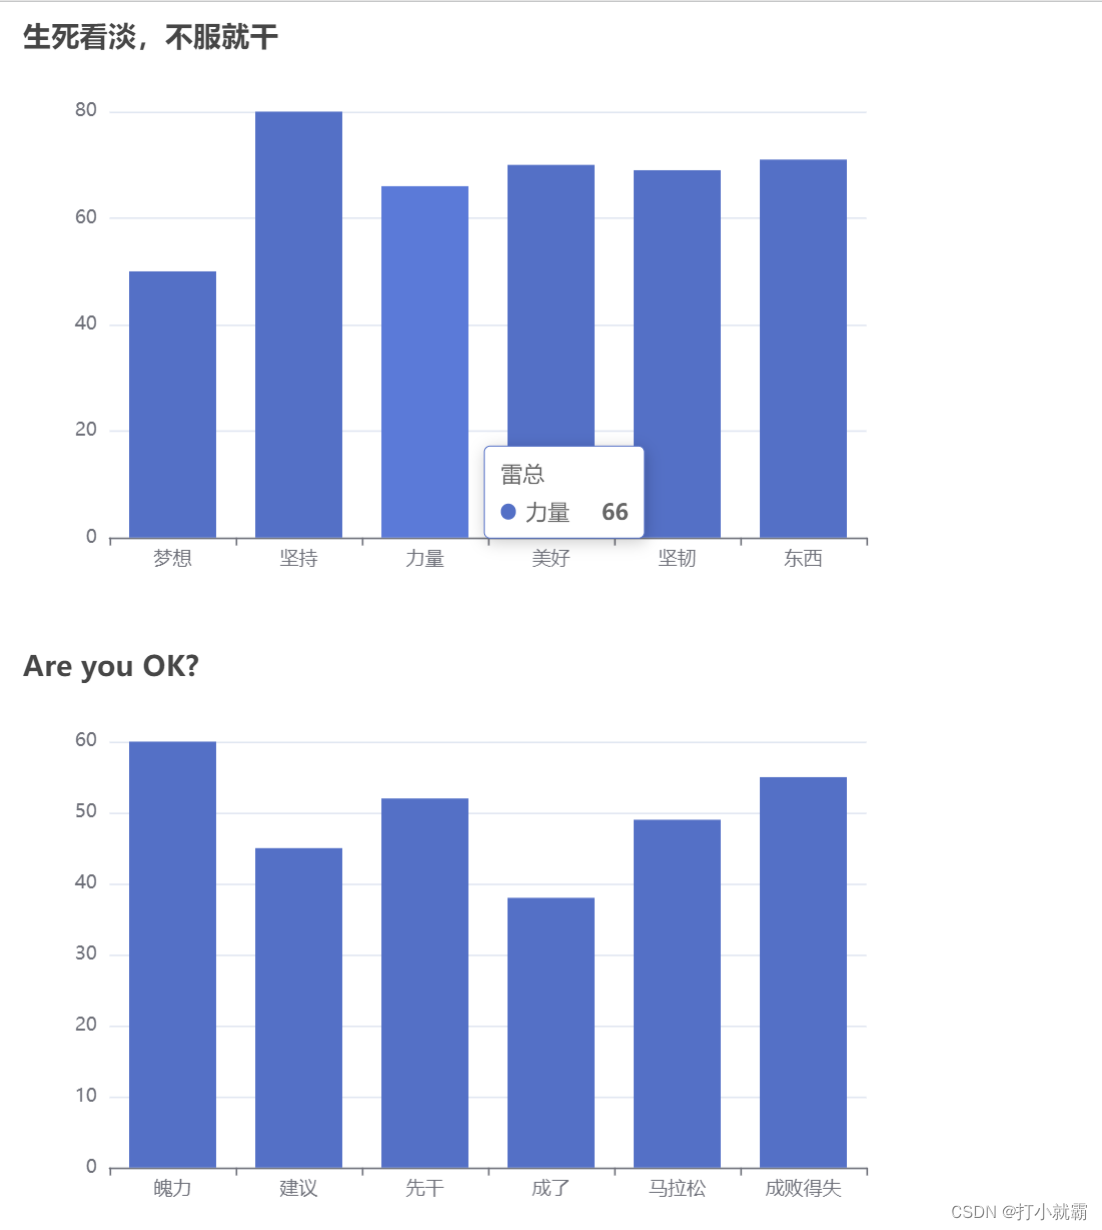
你已经成功了,撒花。
今天的分享到此结束,欢迎小伙伴们一起交流