what is VARMA?
ARIMA是针对单一变量进行建模的方法,当我们需要进行多变量时序建模时,需要使用VAR and VMA and VARMA模型。
- VAR:Vector Auto-Regressive,a generalization of the auto-regressive model for multivariate time series where the time series is stationary and we consider only the lag order ‘p’ in the modelling
- VMA:Vector Moving Average,a generalization of the Moving Average Model for multivariate time series where the time series is stationary and we consider only the order of moving average ‘q’ in the model
- VARMA:Vector Autoregressive Moving Average,a combination of VAR and VMA models that helps in multivariate time series modelling by considering both lag order and order of moving average (p and q)in the model
Vector Autoregression VAR
A typical autoregression model(AR§) for univariate time series can be represented by

In the VAR model, each variable is modeled as a linear combination of past values of itself and the past values of other variables in the system.
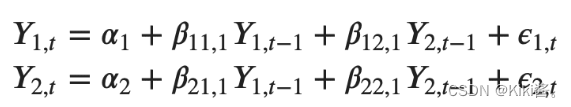
So, the equation for the VAR(1) model with two time-series variables (y1 and y2) will look like this:
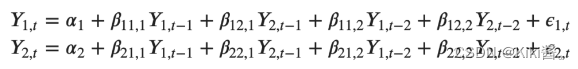
the VAR(2) with y1 and y2 time series variables, the equation of the model will look like:
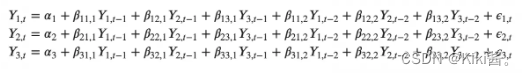
VAR(2) model with three variables (Y1, Y2 and Y3) would look like:
Building a VAR model in Python
The procedure to build a VAR model involves the following steps:
import pandas as pd
import numpy as np
import matplotlib.pyplot as plt
%matplotlib inline

# Import Statsmodels
from statsmodels.tsa.api import VAR
from statsmodels.tsa.stattools import adfuller
from statsmodels.tools.eval_measures import rmse, aic
1. Analyze the time series characteristics
打印数据的统计特征,绘制数据可视化。
filepath = 'https://raw.githubusercontent.com/selva86/datasets/master/Raotbl6.csv'
df = pd.read_csv(filepath, parse_dates=['date'], index_col='date')
print(df.shape)  # (123, 8)
df.tail()
# Plot
fig, axes = plt.subplots(nrows=4, ncols=2, dpi=120, figsize=(10,6))
for i, ax in enumerate(axes.flatten()):
    data = df[df.columns[i]]
    ax.plot(data, color='red', linewidth=1)
    # Decorations
    ax.set_title(df.columns[i])
    ax.xaxis.set_ticks_position('none')
    ax.yaxis.set_ticks_position('none')
    ax.spines["top"].set_alpha(0)
    ax.tick_params(labelsize=6)

plt.tight_layout();
2. Test for causation amongst the time series
Using Granger’s Causality Test, it’s possible to test this relationship before even building the model.
Granger’s causality tests the null hypothesis that the coefficients of past values in the regression equation is zero.
也就是说Granger’s causality tests的零假设是两个变量之间不存在因果关系。
当p-value小于显著性水平0.05时,我们可以安全的拒绝零假设。
from statsmodels.tsa.stattools import grangercausalitytests
maxlag=12
test = 'ssr_chi2test'
def grangers_causation_matrix(data, variables, test='ssr_chi2test', verbose=False):
    """Check Granger Causality of all possible combinations of the Time series.
    The rows are the response variable, columns are predictors. The values in the table
    are the P-Values. P-Values lesser than the significance level (0.05), implies
    the Null Hypothesis that the coefficients of the corresponding past values is
    zero, that is, the X does not cause Y can be rejected.

    data      : pandas dataframe containing the time series variables
    variables : list containing names of the time series variables.
    """
    df = pd.DataFrame(np.zeros((len(variables), len(variables))), columns=variables, index=variables)
    for c in df.columns:
        for r in df.index:
            test_result = grangercausalitytests(data[[r, c]], maxlag=maxlag, verbose=False)
            p_values = [round(test_result[i+1][0][test][1],4) for i in range(maxlag)]
            if verbose: print(f'Y = {
     r}, X = {
     c}, P Values = {
     p_values}')
            min_p_value = np.min(p_values)
            df.loc[r, c] = min_p_value
    df.columns = [var + '_x' for var in variables]
    df.index = [var + '_y' for var in variables]
    return df

grangers_causation_matrix(df, variables = df.columns)
怎么理解输出呢?df的列为原因,行为结果。如果对应的p value小于显著性水平0.05那么拒绝零假设,列是行的原因。
对于上表中的 P 值,如果几乎可以观察到系统中的所有变量(时间序列)都可以互换地相互影响(所有的p值都小于显著性水平),那么这个多时间序列系统可以使用 VAR 模型进行良好的预测。
3. Cointegration Test
Cointegration test helps to establish the presence of a statistically significant connection between two or more time series.
协整测试用来测试多个时序之间彼此统计显著性的连接。
what is ‘order of integration’ (d): 一个非平稳的时序为了要变成平稳从而进行差分的次数。
而对于两个或者更多时序们来说,当这些时序们存在线性组合使得组合的integration (d)小于各个时序的integration (d),那么就说这些时序是协整的。there exists a linear combination of them that has an order of integration (d) less than that of the individual series, then the collection of series is said to be cointegrated.
当两个或者更多时序们是协整的,那么意味着这些时序有一个长期的统计显著的关系。it means they have a long run, statistically significant relationship.这个长期的统计显著的关系也是VAR建模的前提条件。
implement Cointegration Test in python’s statsmodels
from statsmodels.tsa.vector_ar.vecm import coint_johansen

def cointegration_test(df, alpha=0.05):
    """Perform Johanson's Cointegration Test and Report Summary"""
    out = coint_johansen(df,-1,5)
    d = {
   '0.90':0, '0.95':1, '0.99':2}
    traces = out.lr1
    cvts = out.cvt[:, d[str(1-alpha)]]
    def adjust(val, length= 6): return str(val).ljust(length)

    # Summary
    print('Name   ::  Test Stat > C(95%)    =>   Signif  \n', '--'*20)
    for col, trace, cvt in zip(df.columns, traces, cvts):
        print(adjust(col), ':: ', adjust(round(trace,2), 9), ">", adjust(cvt, 8), ' =>  ' , trace > cvt)

cointegration_test(df)
结果是:
Name   ::  Test Stat > C(95%)    =>   Signif
 ----------------------------------------
rgnp   ::  248.0     > 143.6691  =>   True
pgnp   ::  183.12    > 111.7797  =>   True
ulc    ::  130.01    > 83.9383   =>   True
gdfco  ::  85.28     > 60.0627   =>   True
gdf    ::  55.05     > 40.1749   =>   True
gdfim  ::  31.59     > 24.2761   =>   True
gdfcf  ::  14.06     > 12.3212   =>   True
gdfce  ::  0.45      > 4.1296    =>   False
4. Test for stationarity, and Transform the series to make it stationary, if needed
VAR模型要求数据是平稳的,所以需要检查所有的时序变量的平稳性。
判断时序数据平稳性的方法有很多,包括:
- Augmented Dickey-Fuller Test (ADF Test)
- KPSS test
- Philip-Perron test
判断时序平稳性的流程为:使用上述方法之一判断时序的平稳性,如果时序为平稳,则进行下一步;如果时序为不平稳,则进行一次差分,然后再使用上述方法之一判断时序的平稳性;如果时序为平稳,则进行下一步;如果时序为不平稳,则重复上述步骤。
此外,由于所有的时序数据需要保证相同的长度,所以不同的时序变量需要采用相同次数的差分。
def adfuller_test(series, signif=0.05, name='', verbose=False):
    """Perform ADFuller to test for Stationarity of given series and print report"""
    r = adfuller(series, autolag='AIC')
    output = {
   'test_statistic':round(r[0], 4), 'pvalue':round(r[1], 4), 'n_lags':round(r[2], 4), 'n_obs':r[3]}
    p_value = output['pvalue']
    def adjust(val, length= 6): return str(val).ljust(length)

    # Print Summary
    print(f'    Augmented Dickey-Fuller Test on "{
     name}"', "\n   ", '-'*47)
    print(f' Null Hypothesis: Data has unit root. Non-Stationary.')
    print(f' Significance Level    = {
     signif}')
    print(f' Test Statistic        = {
     output["test_statistic"]}')
    print(f' No. Lags Chosen       = {
     output["n_lags"]}')

    for key,val in r[4].items():
        print(f' Critical value {
     adjust(key)} = {
     round(val, 3)}')

    if p_value <= signif:
        print(f" => P-Value = {
     p_value}. Rejecting Null Hypothesis.")
        print(f" => Series is Stationary.")
    else:
        print(f" => P-Value = {
     p_value}. Weak evidence to reject the Null Hypothesis.")
        print(f" => Series is Non-Stationary.")

# ADF Test on each column
for name, column in df_train.iteritems():
    adfuller_test(column, name=column.name)
    print('\n')
结果是:
Augmented Dickey-Fuller Test on "rgnp"
    -----------------------------------------------
 Null Hypothesis: Data has unit root. Non-Stationary.
 Significance Level    = 0.05
 Test Statistic        = 0.5428
 No. Lags Chosen       = 2
 Critical value 1%     = -3.488
 Critical value 5%     = -2.887
 Critical value 10%    = -2.58
 => P-Value = 0.9861. Weak evidence to reject the Null Hypothesis.
 => Series is Non-Stationary.


    Augmented Dickey-Fuller Test on "pgnp"
    ------------