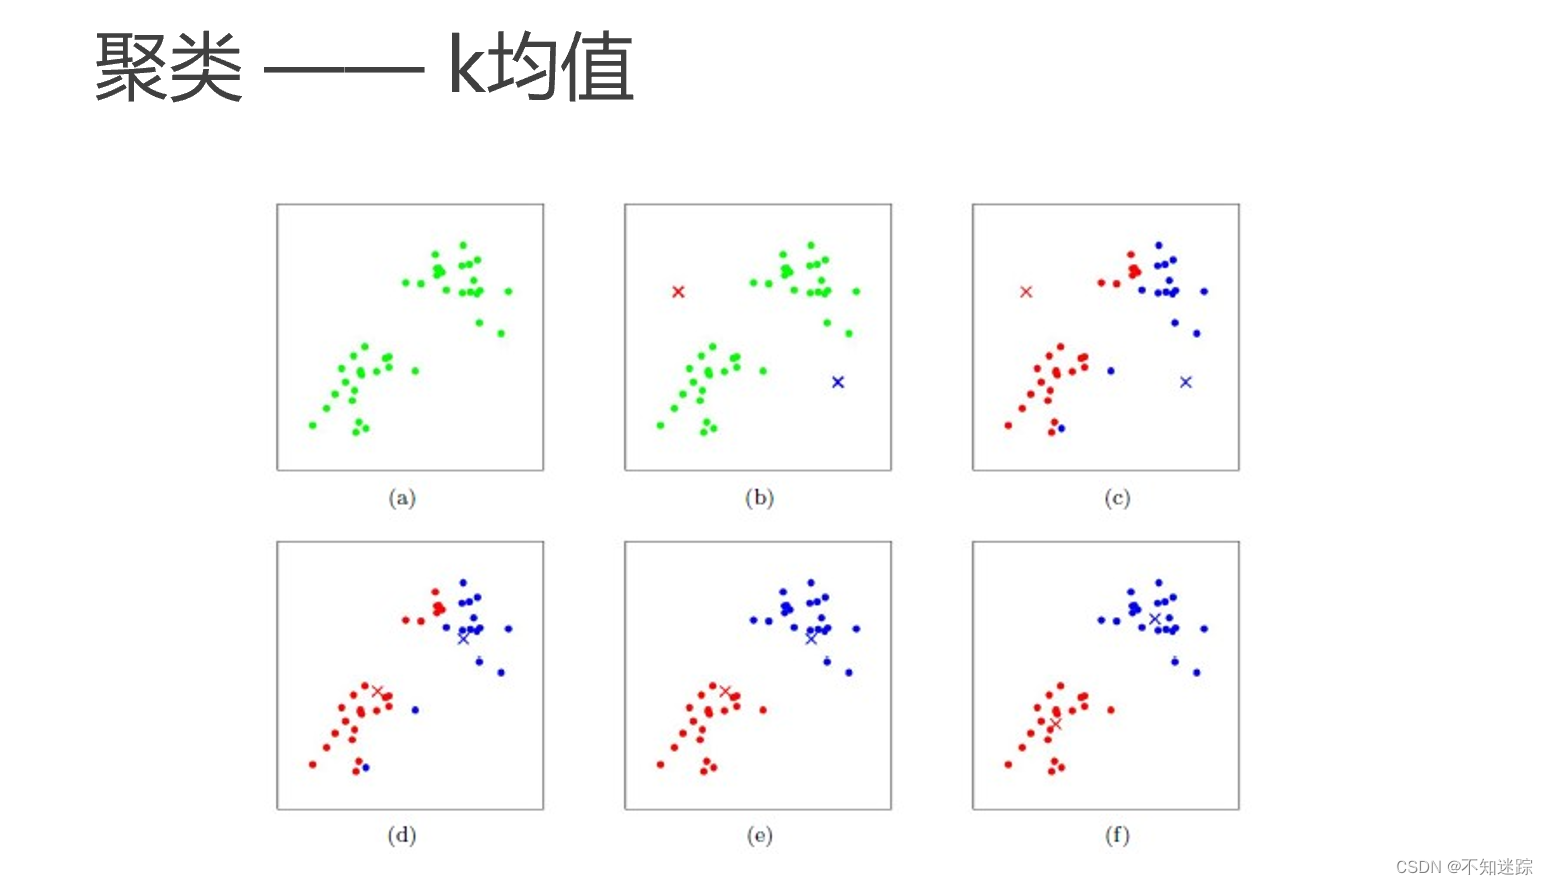
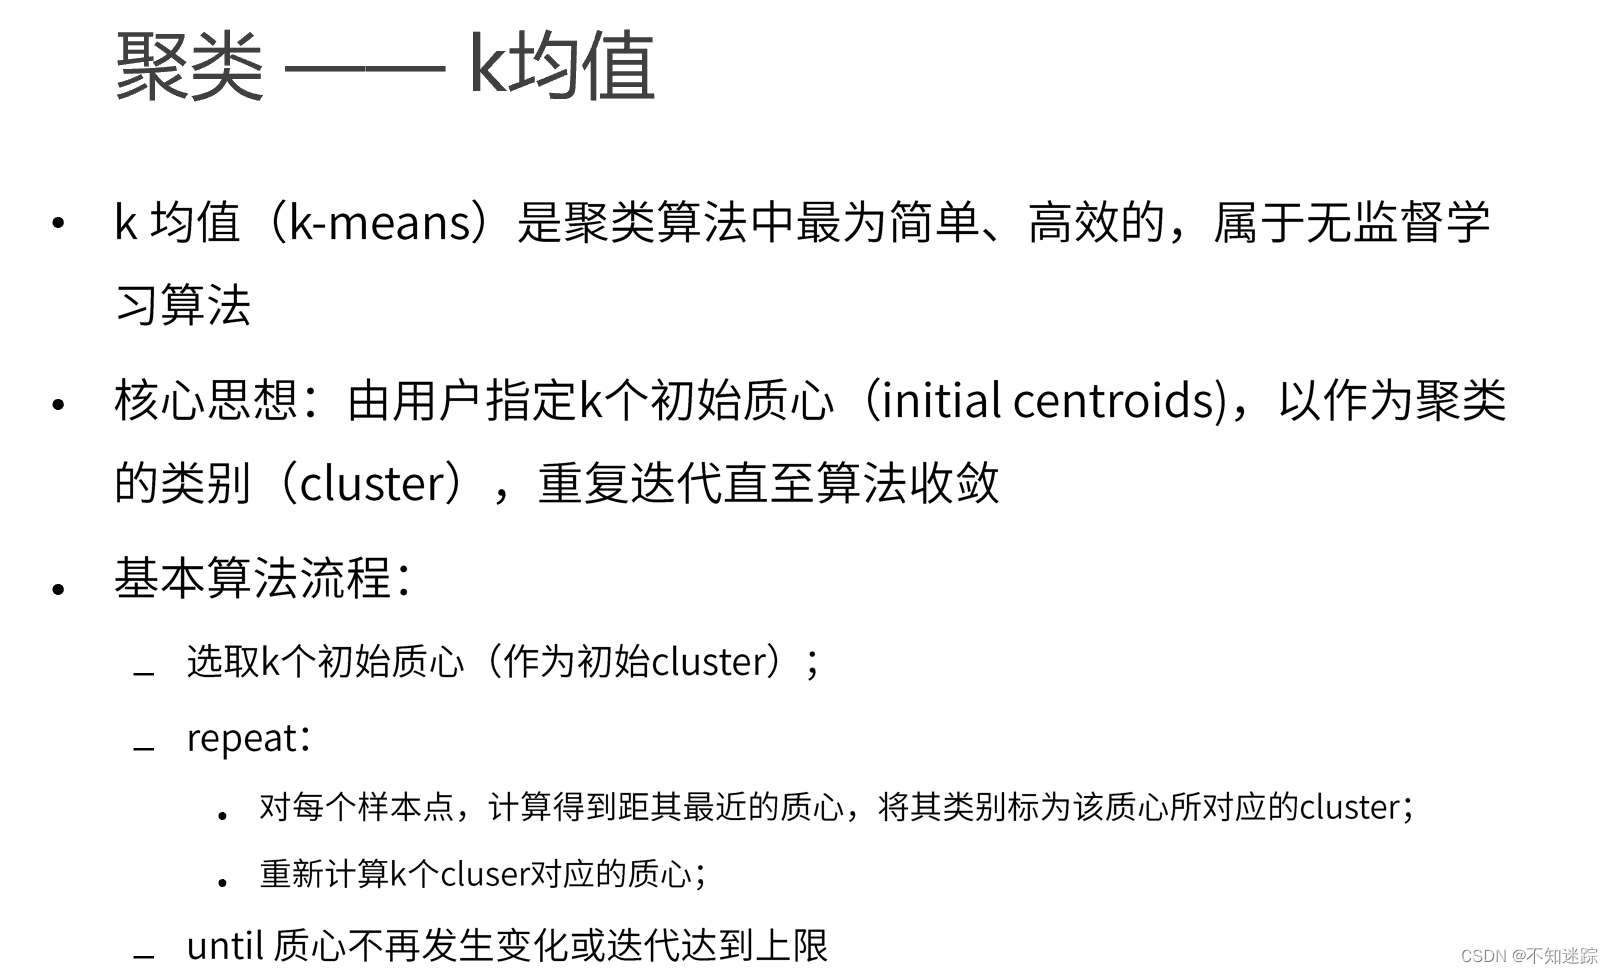
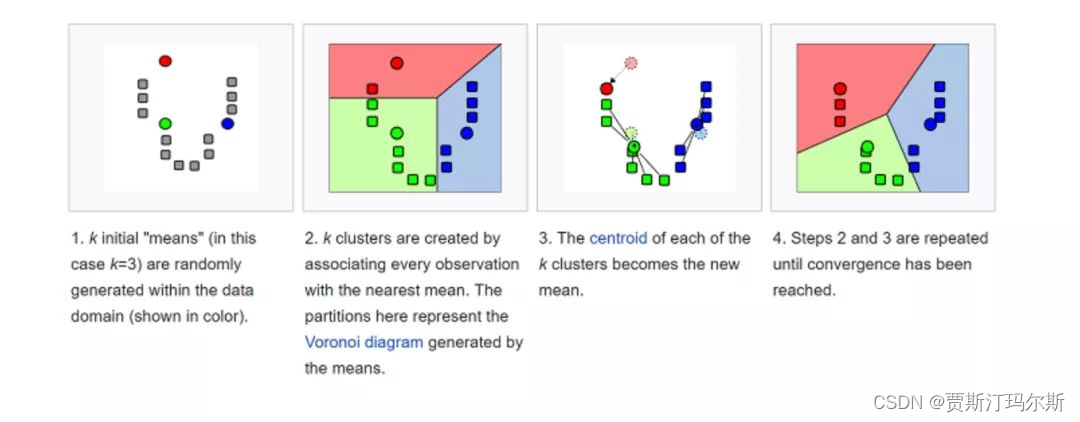
一.K-means算法概念

二.代码实现
# 0. 引入依赖
import numpy as np
import matplotlib.pyplot as plt # 画图依赖
from sklearn.datasets import make_blobs # 从sklearn中直接生成聚类数据
# 1. 数据加载
# 生成(n_samples:样本点,centers:中心点,random_state:随机种子,cluster_std:聚类标准差)
x, y = make_blobs( n_samples=100, centers=6, random_state=1234, cluster_std=0.6 )
"""
print(x)
# 画原始图
plt.figure(figsize=(6,6))
plt.scatter(x[:,0], x[:,1], c=y)
plt.show()
"""
# 2. 算法实现
# 引入scipy中的距离函数,默认欧式距离
from scipy.spatial.distance import cdist
class K_Means(object):
# 初始化,每一类均值参数:n_clusters(K),迭代次数:max_iter,初始质心:centroids
def __init__(self, n_clusters=6, max_iter=300, centroids=[]):
self.n_clusters = n_clusters
self.max_iter = max_iter
self.centroids = np.array(centroids, dtype=np.float64)
# 训练模型方法,k-means聚类过程,传入原始数据(x本身就有两个坐标)
def fit(self, data):
# 假如没有指定初始质心,就随机选取data中的点作为初始质心
if (len(self.centroids) == 0):
# 从data中随机生成0到data行数的6个整数,作为索引值
# 从0到len(data)中随机选取n_clusters个
self.centroids = data[np.random.randint(0, len(data), self.n_clusters), :]
# 开始迭代
for i in range(self.max_iter):
# 1. 计算距离矩阵,得到的是一个100*6的矩阵,每一行为该样本点到6个质心的距离
distances = cdist(data, self.centroids)
# 2. 对距离按有近到远排序,选取最近的质心点的类别,作为当前点的分类
c_ind = np.argmin(distances, axis=1)
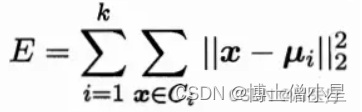
# 3. 对每一类数据进行均值计算,更新质心点坐标
for i in range(self.n_clusters):
# 排除掉没有出现在c_ind里的类别
if i in c_ind:
# 选出所有类别是i的点,取data里面坐标的均值,更新第i个质心
self.centroids[i] = np.mean(data[c_ind == i], axis=0)
# 实现预测方法
def predict(self, samples):
# 跟上面一样,先计算距离矩阵,然后选取距离最近的那个质心的类别
distances = cdist(samples, self.centroids)
c_ind = np.argmin(distances, axis=1)
return c_ind
"""
dist = np.array([[121, 221, 32, 43],
[121, 1, 12, 23],
[65, 21, 2, 43],
[1, 221, 32, 43],
[21, 11, 22, 3], ])
c_ind = np.argmin(dist, axis=1)
print(c_ind)
x_new = x[0:5]
print(x_new)
print(c_ind == 2)
print(x_new[c_ind == 2])
np.mean(x_new[c_ind == 2], axis=0)
"""
# 3. 测试
# 定义一个绘制子图函数
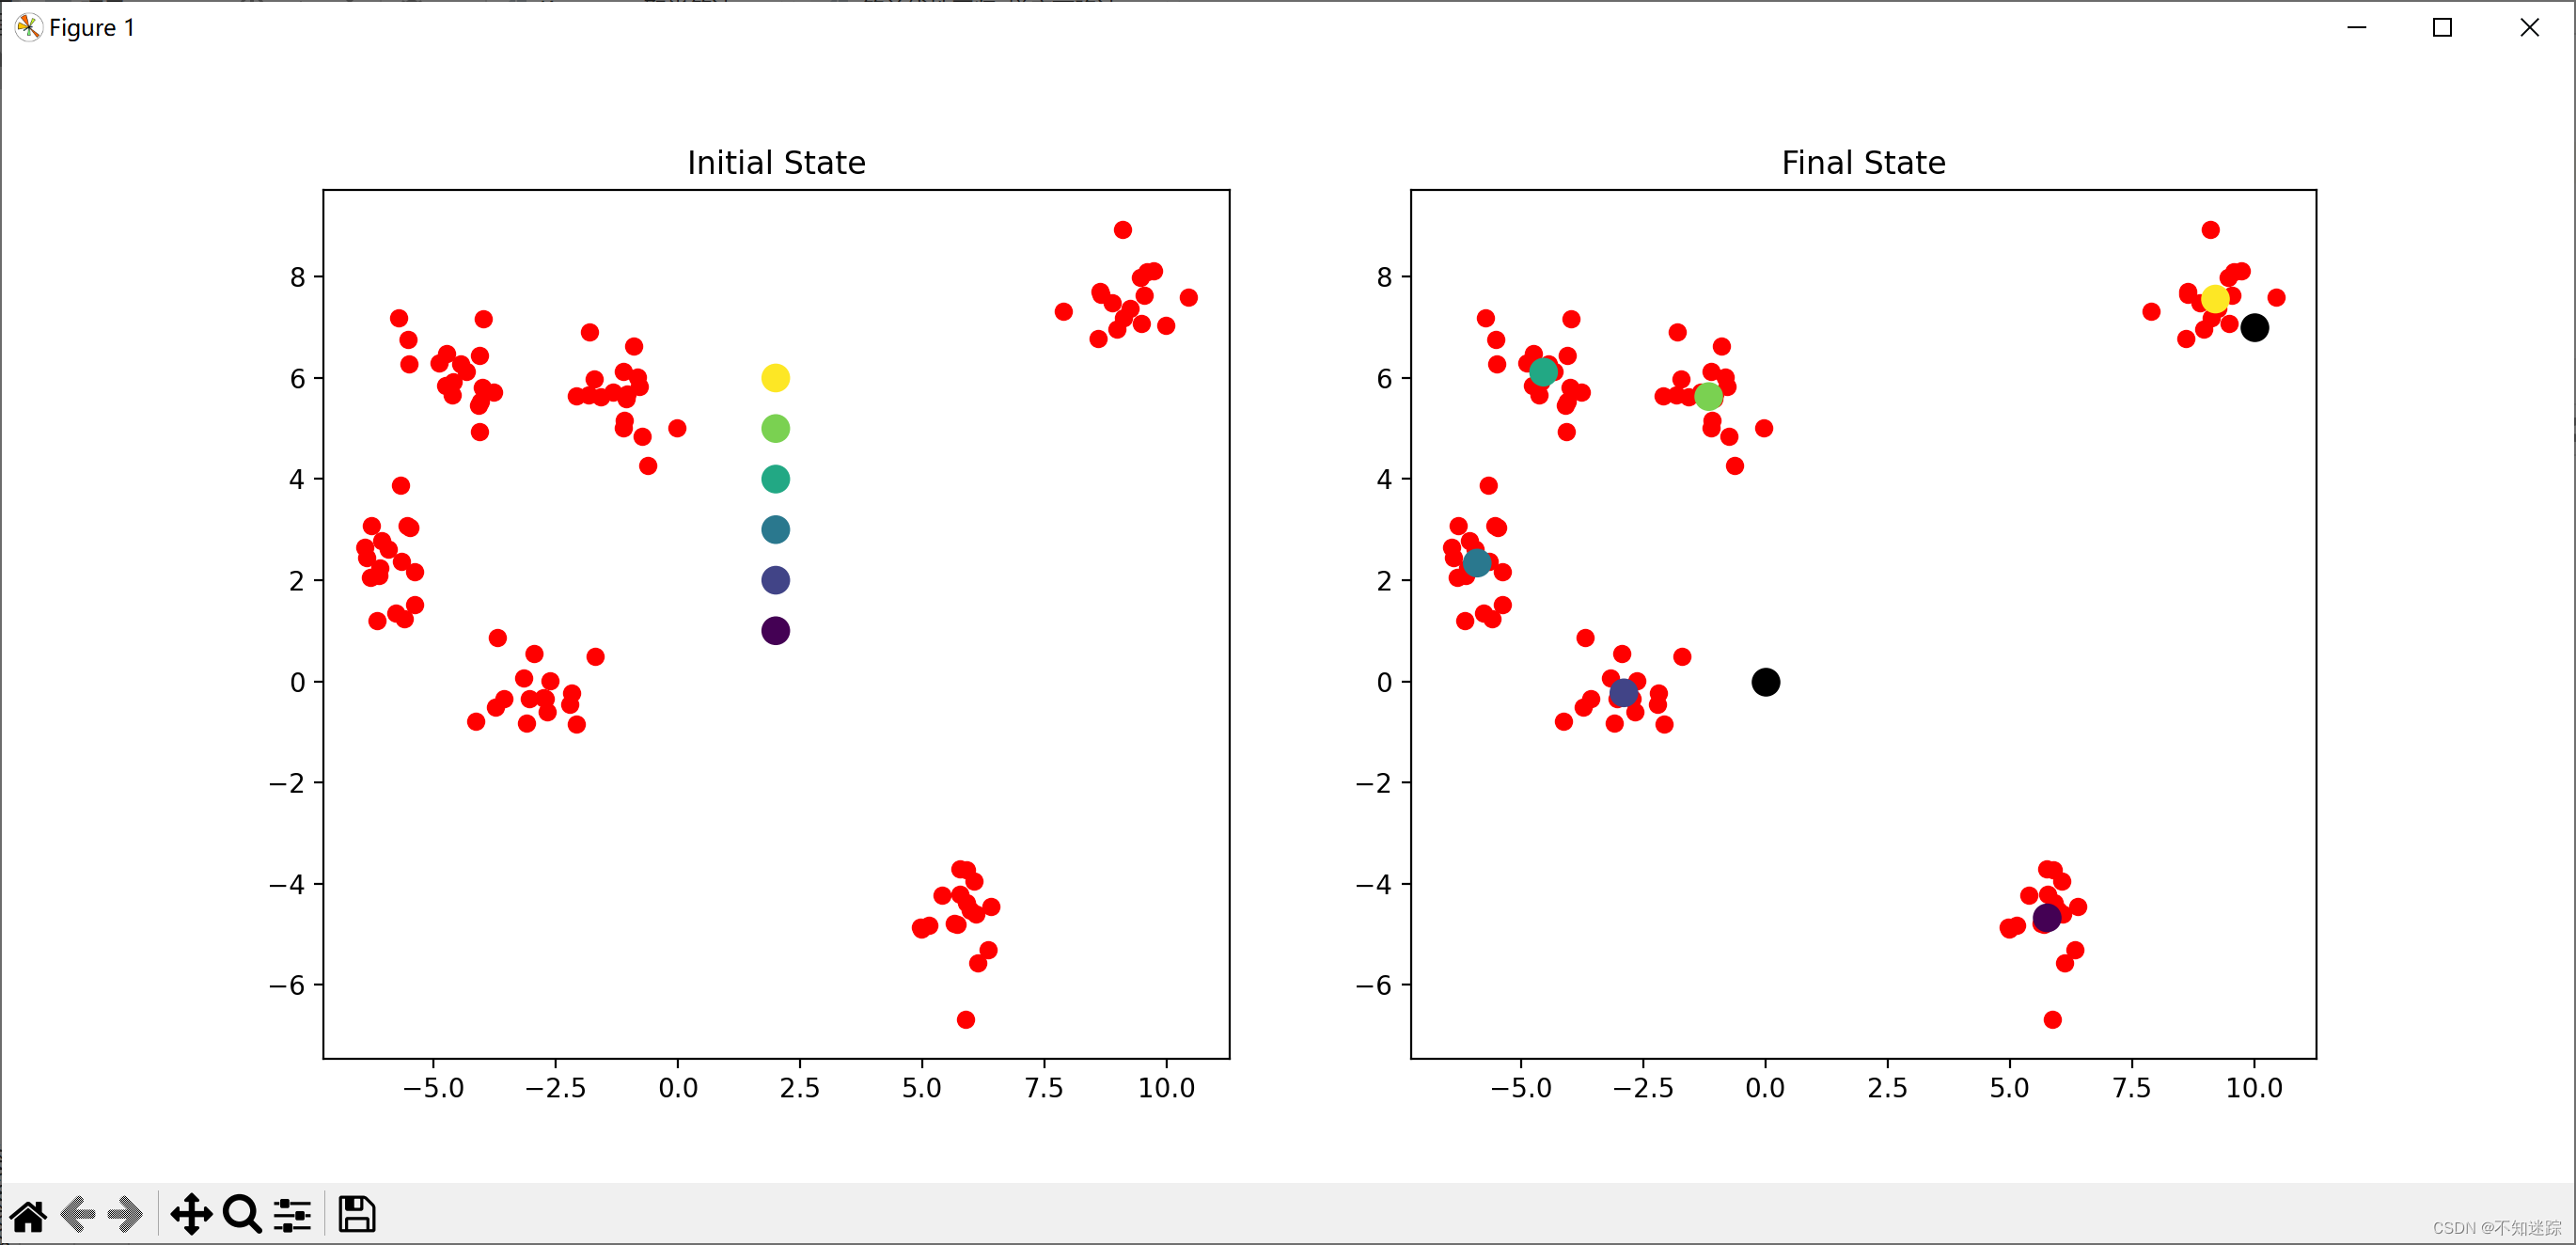
def plotKMeans(x, y, centroids, subplot, title):
# 分配子图,121表示1行2列的子图中的第一个
plt.subplot(subplot)
plt.scatter(x[:,0], x[:,1], c='red')
# 画出质心点
plt.scatter(centroids[:,0], centroids[:,1], c=np.array(range(6)), s=100)
plt.title(title)
# centroids指定质心初始点
kmeans = K_Means(max_iter=300, centroids=np.array([[2,1],[2,2],[2,3],[2,4],[2,5],[2,6]]))
plt.figure(figsize=(16, 6))
plotKMeans( x, y, kmeans.centroids, 121, 'Initial State' )
# 开始聚类
kmeans.fit(x)
plotKMeans( x, y, kmeans.centroids, 122, 'Final State' )
# 预测新数据点的类别
x_new = np.array([[0,0],[10,7]])
y_pred = kmeans.predict(x_new)
print("经过训练的质心为:",kmeans.centroids)
print("这些点的预测为:",y_pred)
plt.scatter(x_new[:,0], x_new[:,1], s=100, c='black')
plt.show()
经过训练的质心为: [[ 5.76444812 -4.67941789]
[-2.89174024 -0.22808556]
[-5.89115978 2.33887408]
[-4.53406813 6.11523454]
[-1.15698106 5.63230377]
[ 9.20551979 7.56124841]]
这些点的预测为: [1 5]


![PyTorch][chapter 12][李宏毅深度学习][Semi-supervised Linear Methods-1]](https://img-blog.csdnimg.cn/direct/a2e499221f0a45d9a25acb871d06aef0.png)