前言
缓冲区是地理空间目标的一种影响范围或服务范围,是对选中的一组或一类地图要素(点、线或面)按设定的距离条件,围绕其要素而形成一定缓冲区多边形实体,从而实现数据在二维空间得以扩展,后续也可以生成栅格进行叠加分析等。
简单来说,缓冲区就是影响范围,比如想看看自己小区附近10公里范围内有哪些加油站,这个以自己小区为中心,半径10公里的圆,就是一个缓冲区。
一、准备
本文已经预设建好了一个vue项目
接下来需要安装openlayers
npm install openlayers -- save
安装地图工具tur
npm install turf -- save
二、初始化地图
1、创建一个地图容器
<template>
  <div style="width: 100vw; height: 100vh">
    <div id="map" style="height: 100%; width: 100%"></div>
  </div>
</template>
2、引入必须的类库
<script>
// 引入地图库
import Map from 'ol/Map'
// 引入视图
import View from 'ol/View'
// 地图控件,例如放大、缩小、比例尺等
import {
    defaults as defaultControls } from 'ol/control'
// 地图瓦片
import {
    Tile as TileLayer } from 'ol/layer'
// 地图瓦片资源
import {
    WMTS } from 'ol/source'
// 地图瓦片网格
import WMTSTileGrid from 'ol/tilegrid/WMTS'
// 地图投影相关工具
import * as olProj from 'ol/proj'
// 获取地图范围工具
import {
    getWidth, getTopLeft } from 'ol/extent'
</script>
3、地图初始化
<script>
// 引入地图库
import Map from 'ol/Map'
// 引入视图
import View from 'ol/View'
// 地图控件,例如放大、缩小、比例尺等
import {
    defaults as defaultControls } from 'ol/control'
// 地图瓦片
import {
    Tile as TileLayer } from 'ol/layer'
// 地图瓦片资源
import {
    WMTS } from 'ol/source'
// 地图瓦片网格
import WMTSTileGrid from 'ol/tilegrid/WMTS'
// 地图投影相关工具
import * as olProj from 'ol/proj'
// 获取地图范围工具
import {
    getWidth, getTopLeft } from 'ol/extent'
export default {

  data() {

    return {

      // 地图对象
      map: null,
      // 地图中心
      center: [117.19637146504114, 39.084235071439096],
    }
  },
  mounted() {

    // 创建地图实例
    this.map = new Map({

      target: 'map',
      // 地图控件
      controls: defaultControls({

        attributionOptions: {
    collapsed: false },
        // 是否可旋转角度
        rotate: false
      }),
      // 视图
      view: new View({

        // 视图中心默认定位到哪里
        center: this.center,
        // 地图投影
        projection: 'EPSG:4326',
        // 缩放级别
        zoom: 13,
        minZoom: 2,
        maxZoom: 18
      })
    })
  }
}
</script>
4、给地图增加底图
<script>
// 引入地图库
import Map from 'ol/Map'
// 引入视图
import View from 'ol/View'
// 地图控件,例如放大、缩小、比例尺等
import {
    defaults as defaultControls } from 'ol/control'
// 地图瓦片
import {
    Tile as TileLayer } from 'ol/layer'
// 地图瓦片资源
import {
    WMTS } from 'ol/source'
// 地图瓦片网格
import WMTSTileGrid from 'ol/tilegrid/WMTS'
// 地图投影相关工具
import * as olProj from 'ol/proj'
// 获取地图范围工具
import {
    getWidth, getTopLeft } from 'ol/extent'
export default {

  data() {

    return {

      // 地图对象
      map: null,
      // 地图中心
      center: [117.19637146504114, 39.084235071439096],
      // 底图,本文实例用的是天地图免费图层,tk为天地图官网注册的key,大家自行注册
      basicLayer: [
        // 影像底图
        {

          // 具体可看https://openlayers.org/en/v6.15.1/apidoc/module-ol_source_WMTS-WMTS.html
          url: `http://t3.tianditu.gov.cn/img_c/wmts?tk=key`, // 服务地址
          layer: 'img', // 图层名称
          matrixSet: 'c', // 矩阵集
          format: 'tiles', // 格式化成瓦片
          wrapX: true // 在水平方向上无限循环显示瓦片
        },
        // 影像注记,地图中的地点名称由此图层渲染
        {

          url: `http://t3.tianditu.gov.cn/cia_c/wmts?tk=key`,
          layer: 'cia',
          matrixSet: 'c',
          format: 'tiles',
          wrapX: true
        }
      ]
    }
  },
  methods: {

    // 增加图层到地图
    addLayerToMap() {

      this.basicLayer.forEach((config, index) => {

        this.map.addLayer(this.initLayers(config, index + 1))
      })
    },
    // 初始化图层对象
    initLayers(config, index) {

      const projection = olProj.get('EPSG:4326')
      // 默认比例尺等相关配置
      const projectionExtent = projection.getExtent()
      const size = getWidth(projectionExtent) / 256
      const resolutions = new Array(18)
      const matrixIds = new Array(18)
      for (let z = 1; z < 19; ++z) {

        resolutions[z] = size / Math.pow(2, z)
        matrixIds[z] = z
      }
      let gridConfig = {

        origin: getTopLeft(projectionExtent),
        resolutions,
        matrixIds
      }
      // 网格
      const tileGrid = new WMTSTileGrid(gridConfig)
      // 创建瓦片资源
      let source = new WMTS(
        Object.assign(
          {

            crossOrigin: 'anonymous',
            projection,
            tileGrid
          },
          config
        )
      )
      // 创建图层对象
      return new TileLayer({

        source,
        projection,
        layerName: config.layer,
        index
      })
    },
  },
  mounted() {

    // 创建地图实例
    this.map = new Map({

      target: 'map',
      // 地图控件
      controls: defaultControls({

        attributionOptions: {
    collapsed: false },
        zoom: false,
        rotate: false
      }),
      view: new View({

        center: this.center,
        projection: 'EPSG:4326',
        zoom: 13,
        minZoom: 2,
        maxZoom: 18
      })
    })
    this.addLayerToMap()
  }
}
</script>
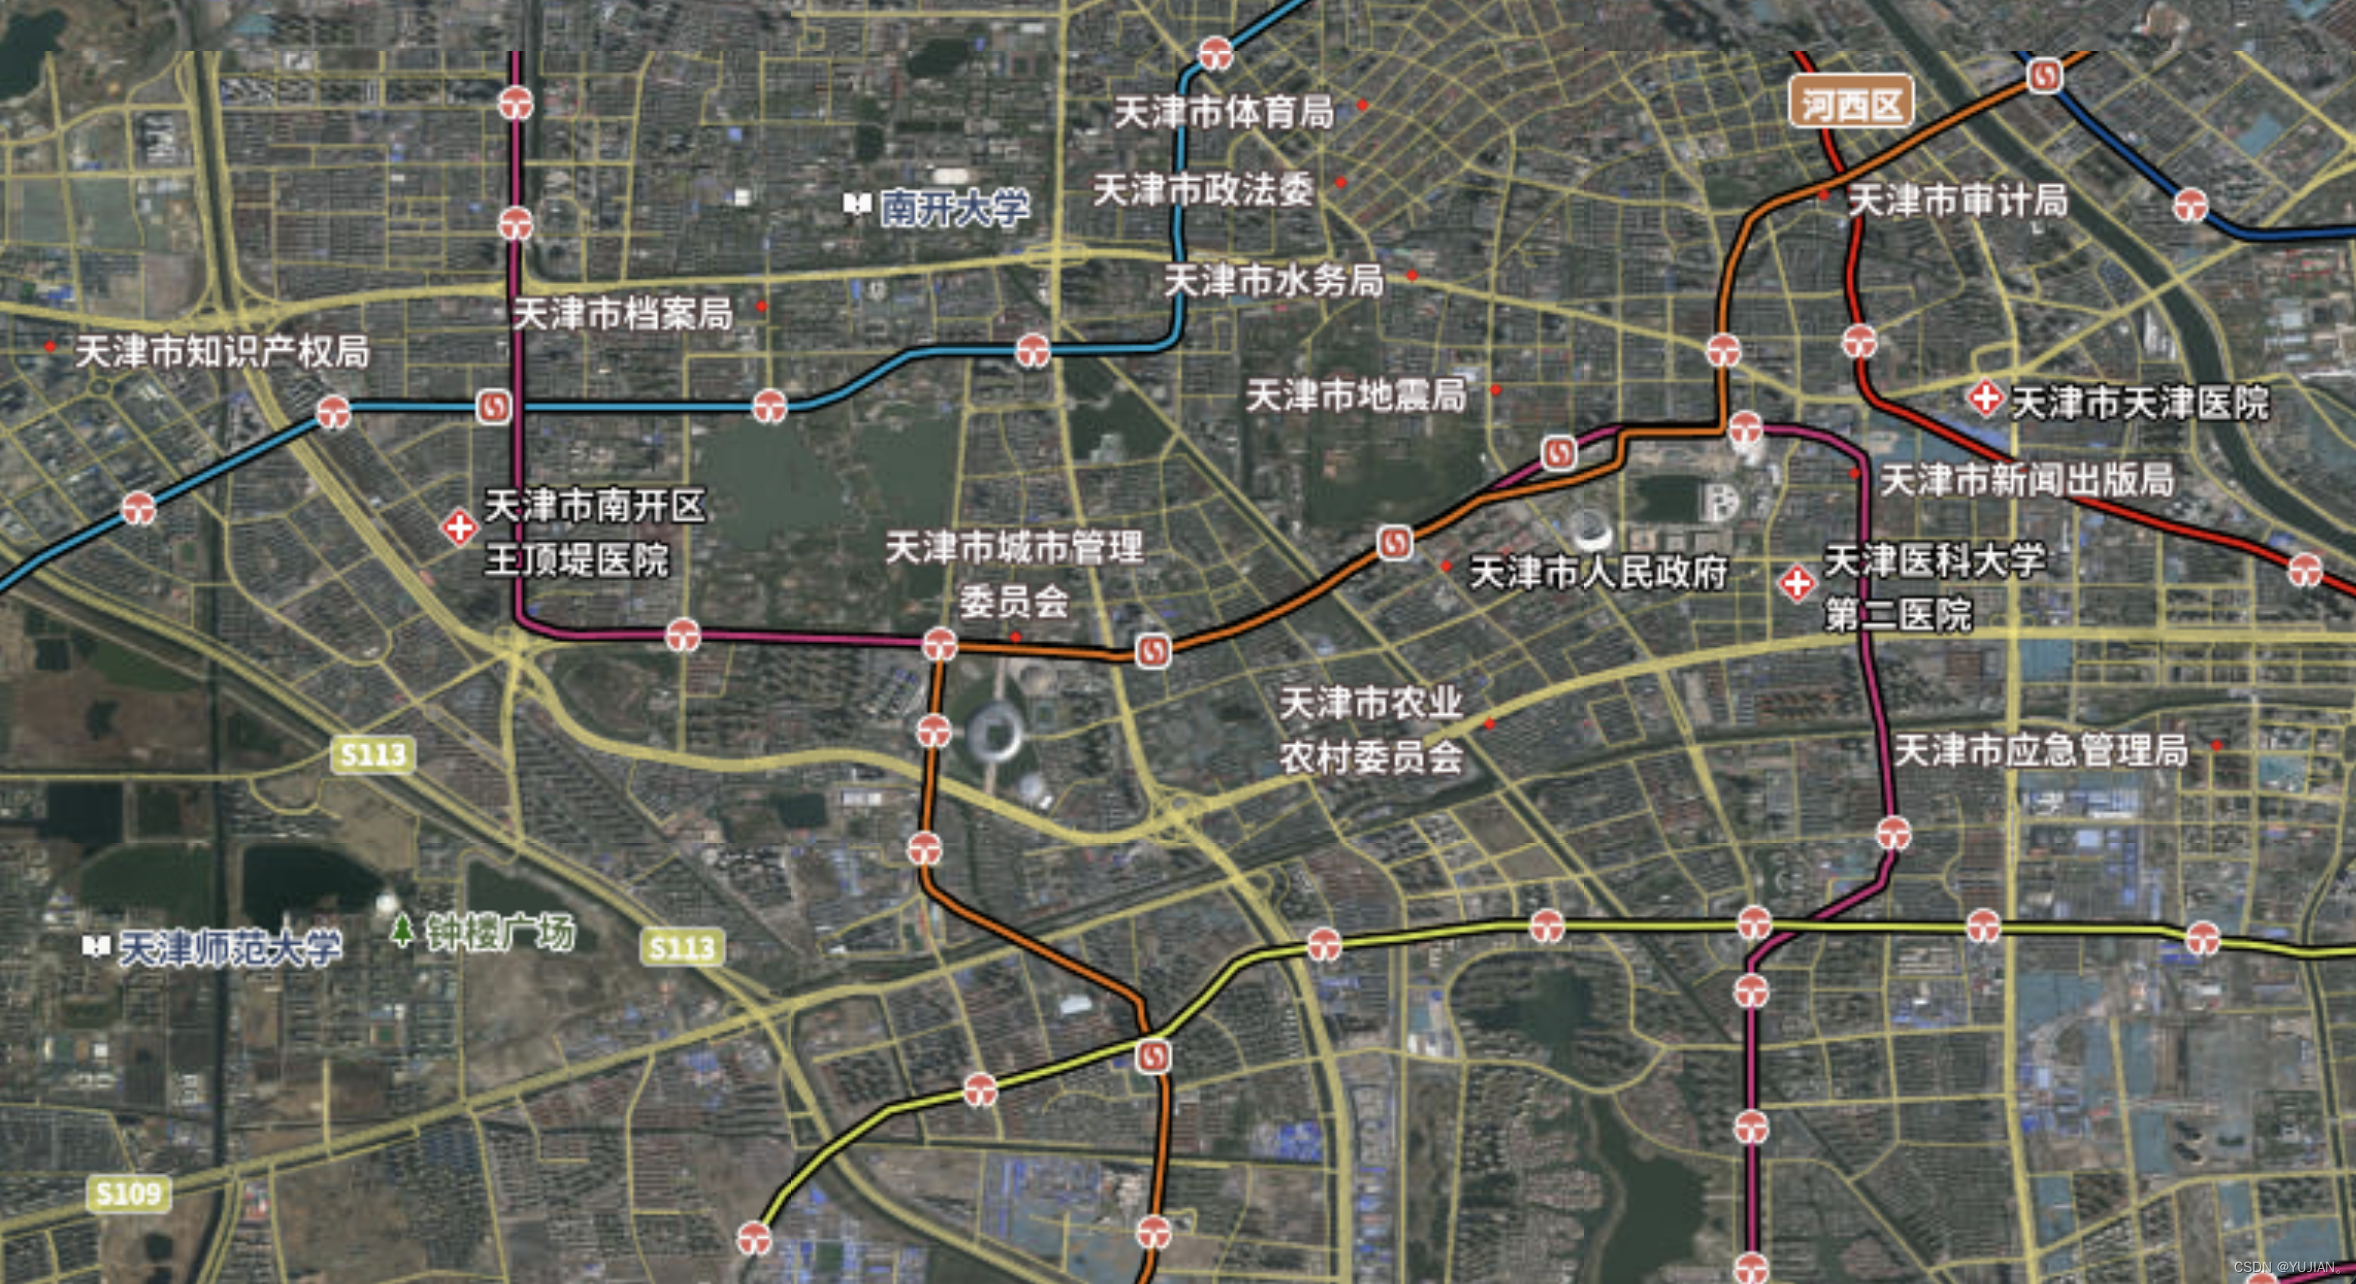
到此地图就算初始化成功
运行代码:
三、创建缓冲区
1、引入需要的工具类库
// 格式化GeoJSON
import {
    GeoJSON } from 'ol/format'
// 矢量图层资源
import {
    Vector as VectorSource } from 'ol/source'
// 矢量图层
import {
    Vector as VectorLayer } from 'ol/layer'
// 地图计算分析工具,例如绘制缓冲区、计算相交面、获取多边形中心等等
import * as turf from '@turf/turf'
2、绘制方法
createBuffer() {

      let options = {

      	// 缓冲区的粒度
        steps: 60,
        // 缓冲区单位
        units: 'meters'
      }
      // 这里第一个参数为缓冲区的中心,第二参数为缓冲区的半径,第三个参数为缓冲区的生成参数
      let drawFeature = turf.circle(this.center, 300, options)
      //创建缓冲区
      let buffered = turf.buffer(drawFeature, 100, {

        units: 'kilometers',
        steps: 5
      })
      //创建数据geojson对象和数据源对象
      let format = new GeoJSON()
      let source = new VectorSource()
      //读取geojson数据
      let a = format.readFeature(drawFeature)
      // 将数据添加数据源的
      source.addFeature(a)
      // 设置缓冲区样式
      if (buffered) {

        let b = format.readFeature(buffered)
        source.addFeature(b)
       // 将缓冲区移入视图,padding为边距 this.map.getView().fit(b.getGeometry().getExtent(), { padding: [10, 10, 10, 10] })
      }
      //添加图层
      let bufferLayer = new VectorLayer({

        source: source,
        layerName: 'bufferLayer',
        zIndex: 3
      })
      this.map.addLayer(bufferLayer)
    }
还可以给缓冲区增加样式
在头部需要引入
// 地图样式相关,例如绘制圆形、设置笔触、多边形颜色、字体颜色等等
import {
    Circle as CircleStyle, Fill, Stroke, Style } from 'ol/style'

// 在createBuffer方法中增加样式
     let a = format.readFeature(drawFeature)
      // 样式设置
      a.setStyle(
        new Style({

          stroke: new Stroke({

            color: 'rgba(255, 0, 0, 0.8)',
            width: 3
          }),
          fill: new Fill({

            color: 'rgba(255, 0, 0, 0.5)'
          }),
          image: new CircleStyle({

            // 点的颜色
            fill: new Fill({

              color: 'rgba(255, 0, 0, 0.8)'
            }),
            // 圆形半径
            radius: 5
          })
        })
      )
      // 设置缓冲区样式
      let b = format.readFeature(buffered)
      b.setStyle(
        new Style({

          stroke: new Stroke({

            color: '#2491ff',
            lineDash: [5, 5],
            width: 3
          }),
          fill: new Fill({

            color: 'rgba(176, 202, 241, 0.5)'
          })
        })
      )
效果如下:

四、完整代码
<template>
  <div style="width: 100vw; height: 100vh">
    <div id="map" style="height: 100%; width: 100%"></div>
  </div>
</template>
<script>
// 引入地图库
import Map from 'ol/Map'
// 引入视图
import View from 'ol/View'
// 地图控件,例如放大、缩小、比例尺等
import {
    defaults as defaultControls } from 'ol/control'
// 地图瓦片
import {
    Tile as TileLayer } from 'ol/layer'
// 地图瓦片资源
import {
    WMTS } from 'ol/source'
// 地图瓦片网格
import WMTSTileGrid from 'ol/tilegrid/WMTS'
// 地图投影相关工具
import * as olProj from 'ol/proj'
// 获取地图范围工具
import {
    getWidth, getTopLeft } from 'ol/extent'
// 格式化GeoJSON
import {
    GeoJSON } from 'ol/format'
// 矢量图层资源
import {
    Vector as VectorSource } from 'ol/source'
// 矢量图层
import {
    Vector as VectorLayer } from 'ol/layer'
// 地图样式相关,例如绘制圆形、设置笔触、多边形颜色、字体颜色等等
import {
    Circle as CircleStyle, Fill, Stroke, Style } from 'ol/style'
// 地图计算分析工具,例如绘制缓冲区、计算相交面、获取多边形中心等等
import * as turf from '@turf/turf'
export default {

  data() {

    return {

      // 地图对象
      map: null,
      // 地图中心
      center: [117.19637146504114, 39.084235071439096],
      // 底图,本文实例用的是天地图免费图层,tk为天地图官网注册的key,大家自行注册
      basicLayer: [
        // 影像底图
        {

          // 具体可看https://openlayers.org/en/v6.15.1/apidoc/module-ol_source_WMTS-WMTS.html
          url: `http://t3.tianditu.gov.cn/img_c/wmts?tk=key`, // 服务地址
          layer: 'img', // 图层名称
          matrixSet: 'c', // 矩阵集
          format: 'tiles', // 格式化成瓦片
          wrapX: true // 在水平方向上无限循环显示瓦片
        },
        // 影像注记,地图中的地点名称由此图层渲染
        {

          url: `http://t3.tianditu.gov.cn/cia_c/wmts?tk=key`,
          layer: 'cia',
          matrixSet: 'c',
          format: 'tiles',
          wrapX: true
        }
      ]
    }
  },
  methods: {

    // 增加图层到地图
    addLayerToMap() {

      this.basicLayer.forEach((config, index) => {

        this.map.addLayer(this.initLayers(config, index + 1))
      })
    },
    // 初始化图层对象
    initLayers(config, index) {

      const projection = olProj.get('EPSG:4326')
      // 默认比例尺等相关配置
      const projectionExtent = projection.getExtent()
      const size = getWidth(projectionExtent) / 256
      const resolutions = new Array(18)
      const matrixIds = new Array(18)
      for (let z = 1; z < 19; ++z) {

        resolutions[z] = size / Math.pow(2, z)
        matrixIds[z] = z
      }
      let gridConfig = {

        origin: getTopLeft(projectionExtent),
        resolutions,
        matrixIds
      }
      // 网格
      const tileGrid = new WMTSTileGrid(gridConfig)
      let source = new WMTS(
        Object.assign(
          {

            crossOrigin: 'anonymous',
            projection,
            tileGrid
          },
          config
        )
      )
      return new TileLayer({

        source,
        projection,
        layerName: config.layer,
        index
      })
    },
    /**
     * 创建缓冲区
     * shape: Point Line Square Circle Polygon
     * distance: 缓冲区距离,单位是千米
     * polygon: 根据已绘制的图形创建缓冲区
     * maxArea: 最大创建范围,超出后不再进行缓冲区查询
     */
    createBuffer() {

      let options = {

        steps: 60,
        units: 'meters'
      }
      let drawFeature = turf.circle(this.center, 300, options)
      //创建缓冲区
      let buffered = turf.buffer(drawFeature, 100, {

        units: 'kilometers',
        steps: 5
      })
      //创建数据geojson对象和数据源对象
      let format = new GeoJSON()
      let source = new VectorSource()
      //读取geojson数据
      let a = format.readFeature(drawFeature)
      // 样式设置
      a.setStyle(
        new Style({

          stroke: new Stroke({

            color: 'rgba(255, 0, 0, 0.8)',
            width: 3
          }),
          fill: new Fill({

            color: 'rgba(255, 0, 0, 0.5)'
          }),
          image: new CircleStyle({

            // 点的颜色
            fill: new Fill({

              color: 'rgba(255, 0, 0, 0.8)'
            }),
            // 圆形半径
            radius: 5
          })
        })
      )
      // 设置缓冲区样式
      let b = format.readFeature(buffered)
      b.setStyle(
        new Style({

          stroke: new Stroke({

            color: '#2491ff',
            lineDash: [5, 5],
            width: 3
          }),
          fill: new Fill({

            color: 'rgba(176, 202, 241, 0.5)'
          })
        })
      )
      // 将数据添加数据源的
      source.addFeature(a)
      source.addFeature(b)
      // 将缓冲区移入视图,padding为边距this.map.getView().fit(b.getGeometry().getExtent(), { padding: [10, 10, 10, 10] })
      //添加图层
      let bufferLayer = new VectorLayer({

        source: source,
        layerName: 'bufferLayer',
        zIndex: 3
      })
      this.map.addLayer(bufferLayer)
    }
  },
  mounted() {

    // 创建地图实例
    this.map = new Map({

      target: 'map',
      controls: defaultControls({

        attributionOptions: {
    collapsed: false },
        zoom: false,
        rotate: false
      }),
      view: new View({

        center: this.center,
        projection: 'EPSG:4326',
        zoom: 13,
        minZoom: 2,
        maxZoom: 18
      })
    })
    this.addLayerToMap()
    this.createBuffer()
  }
}
</script>
总结
需要创建缓冲区首先需要初始化一个地图,一个地图需要有容器、控件(可选)、视图、图层来构成。
绘制缓冲区,这里借助工具turf.buffer来创建。
缓冲区的中心、半径和样式可以完全自定义,其中中心和半径,可以直接在创建时传入参数,自定义样式需要用到ol/style中的类,需要单独引入使用