后端代码:
from fastapi import FastAPI, WebSocket
import psutil
import asyncio

app = FastAPI()

@app.websocket("/ws")
async def websocket_endpoint(websocket: WebSocket):
    await websocket.accept()
    while True:
        cpu_usage = psutil.cpu_percent(interval=1)  # 获取 CPU 使用率
        await websocket.send_json({
   "cpu_usage": cpu_usage})
        await asyncio.sleep(1)  # 每秒发送一次数据
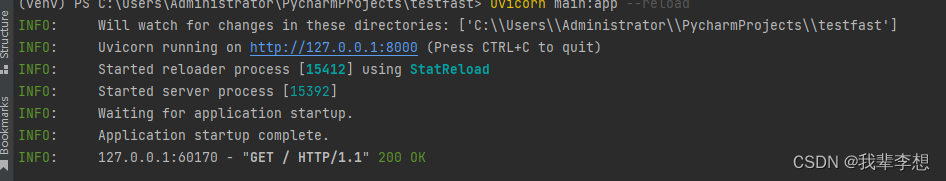
后端运行:
uvicorn main:app --port 9999
前端代码:
安装插件
npm install echarts
<template>
  <div>
    <div id="cpu-chart" style="width: 600px;height:400px;"></div>
  </div>
</template>

<script>
import * as echarts from 'echarts';

export default {
  data() {
    return {
      chart: null,
      ws: null,
      data: [],
    };
  },
  mounted() {
    this.initWebSocket();
    this.initChart();
  },
  methods: {
    initWebSocket() {
      this.ws = new WebSocket('ws://localhost:9999/ws');
      this.ws.onmessage = (event) => {
        const message = JSON.parse(event.data);
        this.updateChartData(message.cpu_usage);
      };
    },
    initChart() {
      this.chart = echarts.init(document.getElementById('cpu-chart'));
      const option = {
        title: {
          text: 'CPU Usage',
        },
        tooltip: {
          trigger: 'axis',
          axisPointer: {
            type: 'cross',
          },
        },
        xAxis: {
          type: 'category',
          data: [],
        },
        yAxis: {
          type: 'value',
          min: 0,
          max: 100,
          axisLabel: {
            formatter: '{value} %',
          },
        },
        series: [
          {
            name: 'CPU Usage',
            type: 'line',
            data: this.data,
          },
        ],
      };
      this.chart.setOption(option);
    },
    updateChartData(cpuUsage) {
      const now = new Date();
      const time = `${now.getHours()}:${now.getMinutes()}:${now.getSeconds()}`;
      this.data.push(cpuUsage);
      this.chart.setOption({
        xAxis: {
          data: [...Array(this.data.length).keys()].map(i => `#${i + 1}`),
        },
        series: [{
          data: this.data,
        }],
      });
    },
  },
  beforeDestroy() {
    if (this.ws) {
      this.ws.close();
    }
  },
};
</script>

<style>
/* Your CSS here */
</style>