echarts-wordcloud是基于echarts的一个插件,所以我们要首先安装echarts包,然后再安装echarts-wordcloud的包,这里我的练习项目安装的版本;当然,你可以随意安装你需要的版本;
“echarts”: “^5.3.3”,
“echarts-wordcloud”: “^2.0.0”,
npm install echarts@5.3.3
npm install echarts-wordcloud@2.0.0
基本配置详解
词库云的使用方式其实跟echart组件是一样的,也是首先需要一个容器,然后对其进行配置,我们先来看一下他的一下配置项,最后我们再把详细的使用方法以及代码展示出来;
var chart = echarts.init(document.getElementById('main'));

chart.setOption({

    ...
    series: [{

        type: 'wordCloud',

        /*要绘制的“云”的形状。可以是为回调函数,或一个关键字。
        可用的形状有(circle)圆形(默认)、(cardioid)心形,(diamond)菱形,(triangle-forward)三角形向前,(triangle)三角形,(pentagon)五边形和(star)星形。*/
        shape: 'circle',

        //保持maskImage的宽高比或1:1的形状,他的选项是支持从echarts-wordcloud@2.1.0
        keepAspect: false,

        //一个轮廓图像,其白色区域将被排除在绘制文本之外
        //意思就是可以通过图片,来自定义词云的形状
        maskImage: maskImage,

       //设置显示区域的位置以及大小
        left: 'center',
        top: 'center',
        right: null,
        bottom: null,
        width: '70%',
        height: '80%',

        //数据中的值将映射到的文本大小范围。默认大小为最小12px,最大60px。
        sizeRange: [12, 60],

       //文本旋转范围和步进度。文本将通过rotationStep:45在[- 90,90]范围内随机旋转
        rotationRange: [-90, 90],
        rotationStep: 45,

		//以像素为单位的网格大小,用于标记画布的可用性
		//网格尺寸越大,单词之间的间距越大。
        gridSize: 8,

         //设置为true,允许文字部分在画布外绘制。
        //允许绘制大于画布大小的单词
        //从echarts-wordcloud@2.1.0开始支持此选项
        drawOutOfBound: false,

        //如果字体太大而无法显示文本,
        //是否收缩文本。如果将其设置为false,则文本将不渲染。如果设置为true,则文本将被缩小。
        //从echarts-wordcloud@2.1.0开始支持此选项
        shrinkToFit: false,

        // 执行布局动画。当有大量的单词时,关闭它会导致UI阻塞。
        layoutAnimation: true,

        //全局文本样式
        textStyle: {

            fontFamily: 'sans-serif',
            fontWeight: 'bold',
            // Color可以是一个回调函数或一个颜色字符串
            color: function () {

                // Random color
                return 'rgb(' + [
                    Math.round(Math.random() * 160),
                    Math.round(Math.random() * 160),
                    Math.round(Math.random() * 160)
                ].join(',') + ')';
            }
        },
        emphasis: {

            focus: 'self',

            textStyle: {

                textShadowBlur: 10,
                textShadowColor: '#333'
            }
        },

       //数据是一个数组。每个数组项必须具有名称和值属性。
        data: [
	        {

	            name: 'Farrah Abraham',
	            value: 366,
	            //单个文本的样式
	            textStyle: {
   }
	        }
        ]
    }]
});
具体使用步骤
1.首先在项目中引入
import * as echarts from 'echarts';
import 'echarts-wordcloud';
2.在需要使用词库云的组件写一个div容器
<div id="myEchart"></div>
3.设置配置项
export default {

    mounted(){

       this. initEchart()
    },
    methods:{

        initEchart(){

           const echartDom = document.getElementById('myEchart')
           const myChart = echarts.init(echartDom)
           const option  = {

                series: [{

                type: 'wordCloud',
                shape: 'circle',
                keepAspect: false,
               // maskImage: maskImage,
                left: 'center',
                top: 'center',
                width: '100%',
                height: '90%',
                right: null,
                bottom: null,
                sizeRange: [12, 60],
                rotationRange: [-90, 90],
                rotationStep: 45,
                gridSize: 8,
                drawOutOfBound: false,
                layoutAnimation: true,
                textStyle: {

                    fontFamily: 'sans-serif',
                    fontWeight: 'bold',
                    color: function () {

                        return 'rgb(' + [
                            Math.round(Math.random() * 160),
                            Math.round(Math.random() * 160),
                            Math.round(Math.random() * 160)
                        ].join(',') + ')';
                    }
                },
                emphasis: {

                    // focus: 'self',
                    textStyle: {

                        textShadowBlur: 3,
                        textShadowColor: '#333'
                    }
                },
                //data属性中的value值却大,权重就却大,展示字体就却大
                data: [
                    {
   name: 'Farrah',value: 366},
                    {
   name: "汽车",value: 900},
                    {
   name: "视频",value: 606},
                    ...
                ]
            }]

           }
           option && myChart.setOption(option)

           //随着屏幕大小调节图表
            window.addEventListener("resize", () => {

                myChart.resize();
            });
        }
    }
}
4.效果图展示


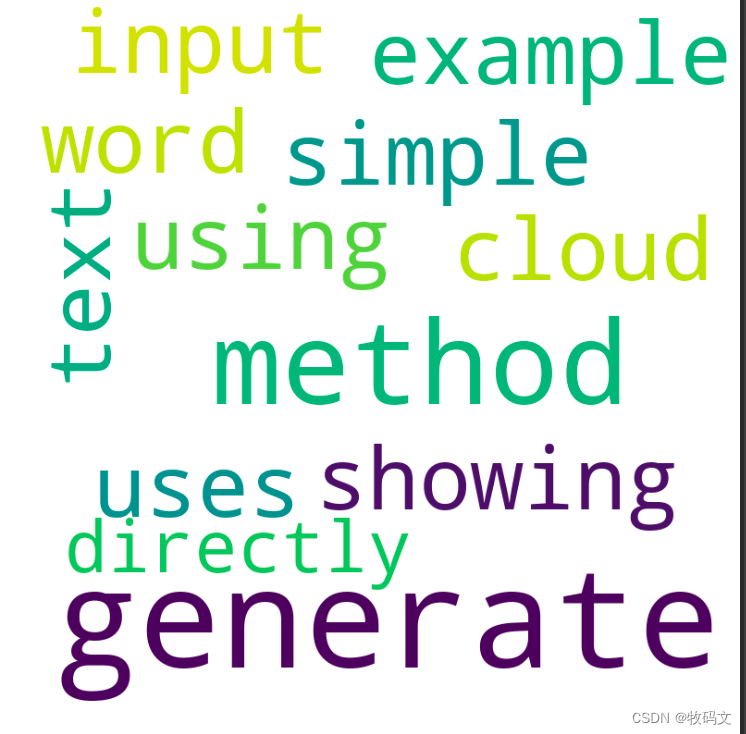


![[数据结构]顺序表](https://img-blog.csdnimg.cn/direct/6d2ef5d045c946d7b03a6930f5ed615b.png)