Backtrader 文档学习-Indicators混合时间周期
1.不同时间周期
如果数据源在Cerebro引擎中具有不同的时间范围和不同的长度,指示器将会终止。
比如:data0是日线,data1是月线 。
pivotpoint = btind.PivotPoint(self.data1)
sellsignal = self.data0.close < pivotpoint.s1
当收盘低于s1线(第一支撑位)时为卖出信号
PivotPoint可以在更大的时间范围内工作
在以前的版本报错:
return self.array[self.idx + ago]
IndexError: array index out of range
原因是:self.data.close提供第一个bar的值,但PivotPoint(以及s1行)只有在一个完整月过去后才会有值,相当于self.data0.close的22个值。在这22个close值,s1的Line还没有值,从底层数组获取它的尝试失败,报错超出范围。
Line对象支持(ago)运算符(Python中的__call__特殊方法)来传递自身的延迟版本:
close1 = self.data.close(-1)
In this example the object close1 (when accessed via [0]) always contains the previous value (-1) delivered by close. The syntax has been reused to accomodate adapting timeframes. Let’s rewrite the above pivotpoint snippet:
对象close1(通过[0]访问时)始终包含close提供的前一个值(-1)。语法将重写以适应时间框架。重写上面的pivotpoint 片段:
pivotpoint = btind.PivotPoint(self.data1)
sellsignal = self.data0.close < pivotpoint.s1()
看看()是如何在没有参数的情况下执行的(在后台没有提供任何参数)。发生了以下情况:
- pivotpoint.s1()返回内部LinesCoupler对象,该对象遵循较大范围周期,coupler用来自实际s1的最新值填充,从默认值NaN开始 。
在后面章节中的参数说明:
PivotPoint Formula:
- pivot = (h + l + c) / 3 # variants duplicate close or add open
- support1 = 2.0 * pivot - high
- support2 = pivot - (high - low)
- resistance1 = 2.0 * pivot - low
- resistance2 = pivot + (high - low)
对应计算后的Line: - p
- s1
- s2
- r1
- r2
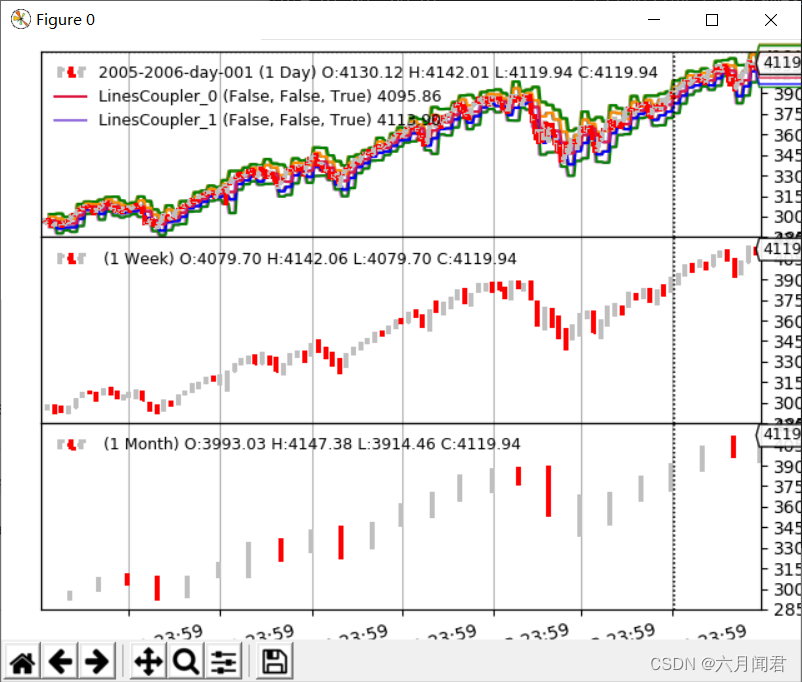
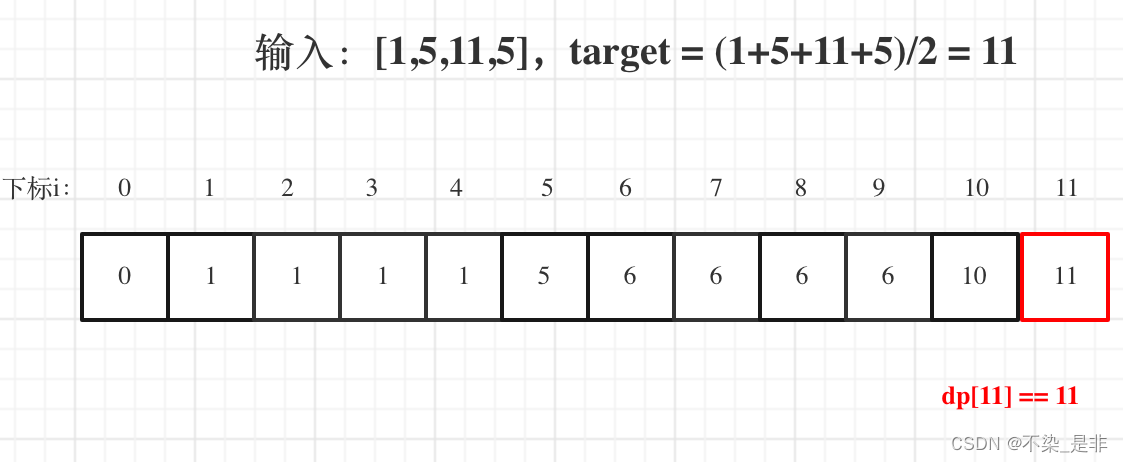
运行结果:
0069,0069,0014,2005-04-11,3080.60,3043.16,0.00
0070,0070,0014,2005-04-12,3065.18,3043.16,0.00
0071,0071,0014,2005-04-13,3080.54,3043.16,0.00
0072,0072,0014,2005-04-14,3075.33,3043.16,0.00
0073,0073,0014,2005-04-15,3013.89,3043.16,1.00
0074,0074,0015,2005-04-18,2947.79,2988.96,1.00
0075,0075,0015,2005-04-19,2957.37,2988.96,1.00
0076,0076,0015,2005-04-20,2944.33,2988.96,1.00
0077,0077,0015,2005-04-21,2950.34,2988.96,1.00
0078,0078,0015,2005-04-22,2976.39,2988.96,1.00
0079,0079,0016,2005-04-25,2987.05,2935.07,0.00
0080,0080,0016,2005-04-26,2983.22,2935.07,0.00
0081,0081,0016,2005-04-27,2942.62,2935.07,0.00
在长度为74 的时候,close < s1 。出现signal 。
2.代码
from __future__ import (absolute_import, division, print_function,
                        unicode_literals)

import argparse

import backtrader as bt
import backtrader.feeds as btfeeds
import backtrader.indicators as btind
import backtrader.utils.flushfile


class St(bt.Strategy):
    params = dict(multi=True)

    def __init__(self):
        self.pp = pp = btind.PivotPoint(self.data1)
        #print(dir(pp))

        pp.plotinfo.plot = False  # deactivate plotting

        if self.p.multi:
            pp1 = pp()  # couple the entire indicators
            self.sellsignal = self.data0.close < pp1.s1()
        else:
            self.sellsignal = self.data0.close < pp.s1()

    def next(self):
        txt = ' , '.join(
            ['%04d' % len(self),
             '%04d' % len(self.data0),
             '%04d' % len(self.data1),
             self.data.datetime.date(0).isoformat(),
             '%.2f' % self.data0.close[0],
             '%.2f' % self.pp.s1[0],
             '%.2f' % self.sellsignal[0]])

        print(txt)


def runstrat():
    args = parse_args()

    cerebro = bt.Cerebro()
    data = btfeeds.BacktraderCSVData(dataname=args.data)
    cerebro.adddata(data)

    cerebro.resampledata(data, timeframe=bt.TimeFrame.Weeks) # 增加周线
    cerebro.resampledata(data, timeframe=bt.TimeFrame.Months) # 增加月线

    cerebro.addstrategy(St, multi=args.multi)

    cerebro.run(stdstats=False, runonce=False)
    if args.plot:
        cerebro.plot(style='bar')


def parse_args():
    parser = argparse.ArgumentParser(
        formatter_class=argparse.ArgumentDefaultsHelpFormatter,
        description='Sample for pivot point and cross plotting')

    parser.add_argument('--data', required=False,
                        default='./datas/2005-2006-day-001.txt',
                        help='Data to be read in')

    parser.add_argument('--multi', required=False, action='store_true',
                        help='Couple all lines of the indicator')

    parser.add_argument('--plot', required=False, action='store_true',
                        help=('Plot the result'))

    return parser.parse_args()


if __name__ == '__main__':
    runstrat()
允许参数说明:
python  ./mixing-timeframes.py --help
usage: mixing-timeframes.py [-h] [--data DATA] [--multi] [--plot]

Sample for pivot point and cross plotting

optional arguments:
  -h, --help   show this help message and exit
  --data DATA  Data to be read in (default: ./datas/2005-2006-day-001.txt)
  --multi      Couple all lines of the indicator (default: False)
  --plot       Plot the result (default: False)
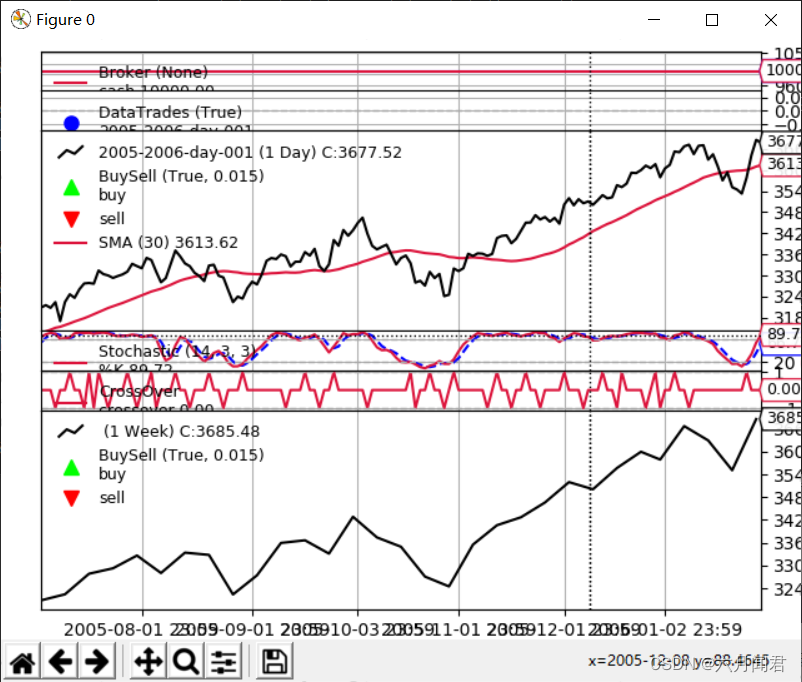
可以看到,日线、周线和月线,三个周期的数据,在cerebro 通过init中Indicator的初始化,在next中打印数据长度,数据和signal,执行结果:
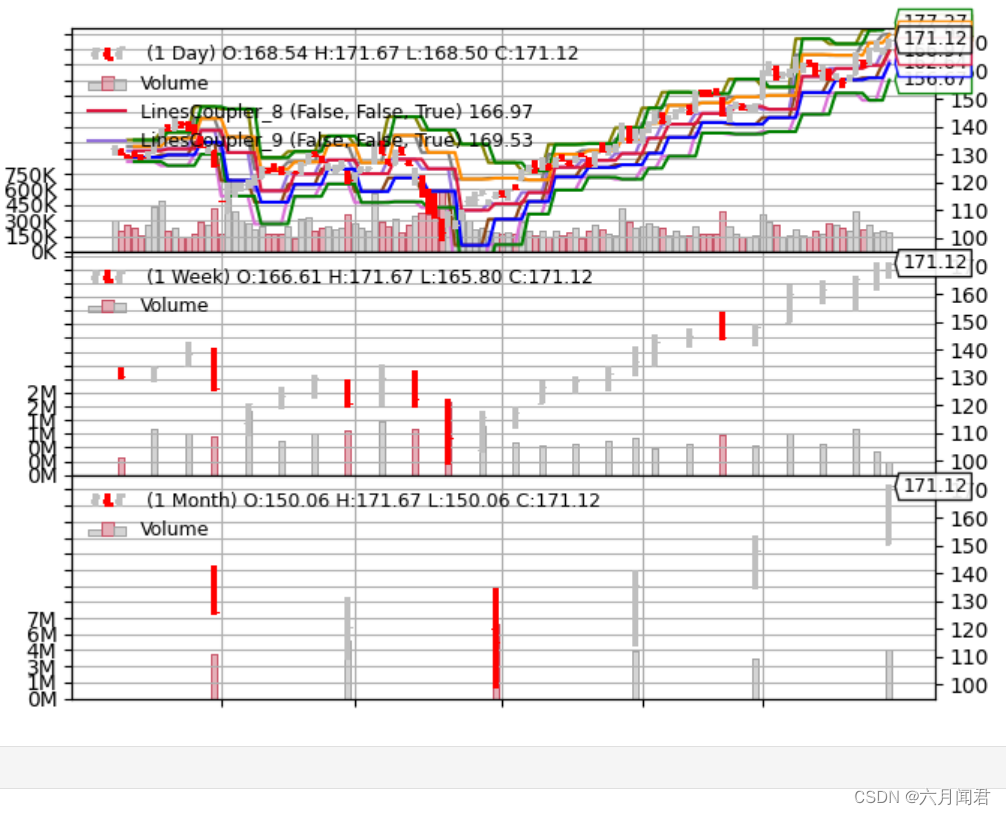
3. 修改为不用args参数
在jupter中可以执行:
from __future__ import (absolute_import, division, print_function,
                        unicode_literals)

import backtrader as bt
import backtrader.feeds as btfeeds
import backtrader.indicators as btind
import backtrader.utils.flushfile

%matplotlib inline

class St(bt.Strategy):
    params = dict(multi=True)

    def __init__(self):
        self.pp = pp = btind.PivotPoint(self.data1)
        pp.plotinfo.plot = False  # deactivate plotting

        if self.p.multi:
            pp1 = pp()  # couple the entire indicators
            self.sellsignal = self.data0.close < pp1.s1
        else:
            self.sellsignal = self.data0.close < pp.s1()

    def next(self):
        txt = ','.join(
            ['%04d' % len(self),
             '%04d' % len(self.data0),
             '%04d' % len(self.data1),
             self.data.datetime.date(0).isoformat(),
             '%.2f' % self.data0.close[0],
             '%.2f' % self.pp.s1[0],
             '%.2f' % self.sellsignal[0]])

        #print(txt)


def runstrat(args_plot):

    #cerebro = bt.Cerebro()
    #data = btfeeds.BacktraderCSVData(dataname=args.data)
    cerebro = bt.Cerebro()
    stock_hfq_df = get_code('000858')

    start_date = datetime.datetime(2020, 1, 1)  # 回测开始时间
    end_date = datetime.datetime(2020, 12, 31)  # 回测结束时间

    data = bt.feeds.PandasData(dataname=stock_hfq_df, fromdate=start_date, todate=end_date)  # 加载数据

    # Add the Data Feed to Cerebro
    cerebro.adddata(data)

    cerebro.resampledata(data, timeframe=bt.TimeFrame.Weeks)
    cerebro.resampledata(data, timeframe=bt.TimeFrame.Months)

    #cerebro.addstrategy(St, multi=args.multi)
    cerebro.addstrategy(St, multi=True)
    cerebro.run(stdstats=False, runonce=False)
    if args_plot:
        cerebro.plot(iplot=False,style='bar')

if __name__ == '__main__':
    args_plot = True
    runstrat(args_plot)
执行效果:
4.Indicator Reference
Indicator 参考说明,参数方法太多了,随用随学吧。


![[渗透测试学习] Hospital - HackTheBox](https://img-blog.csdnimg.cn/direct/c341f9042d504c7caf631e7b31ba7488.png)