OD(4)之libunwind打印堆栈信息
Author:OnceDay Date: 2024年1月11日
漫漫长路,才刚刚开始…
参考文档:
- libunwind 查看函数调用栈 - 知乎 (zhihu.com)
- GitHub - libunwind/libunwind: libunwind official github repo (in need of new / additional maintainer, mail/open issue if interested)
文章目录
1.概述
1.1 libunwind介绍
libunwind 是一个用于确定程序的调用栈的便携式和高效的编程库。它最初是为了改善在IA-64上的Linux系统上的程序性能分析和错误调试,但后来被扩展到支持其他架构。libunwind项目始于2000年代初期,并且随着时间的推移,它已经被各种系统和架构所采纳。
libunwind提供了一组API,允许程序在运行时查询和设置调用帧的状态,主要用于堆栈跟踪(stack unwinding)。这个功能对于异常处理、程序调试以及任何需要检查程序调用历史的场景都非常有用。
特点如下:
- 便携性:支持多种处理器架构和操作系统。
- 高效:设计优化以减少堆栈展开过程中的开销。
- 灵活性:提供API支持程序员编写自定义堆栈展开代码。
- 无侵入性:可以在不修改现有代码的情况下使用。
使用场景如下:
- 异常处理:在支持C++等语言的异常处理中,
libunwind可以用来确定抛出异常时的调用栈。 - 调试器支持:调试工具可以利用
libunwind来显示程序的调用栈,帮助开发者定位问题。 - 性能分析:性能分析工具,如gprof或Valgrind,使用堆栈展开来聚合函数调用数据。
- 崩溃分析:在应用程序崩溃时,
libunwind可以用来生成堆栈跟踪,以便开发者了解崩溃时的上下文。
优点如下:
- 精确度:提供精确的调用栈信息,尤其是在优化过的代码中。
- 非侵入性:可以作为第三方库使用,不需要对现有代码进行修改。
- 广泛的平台支持:支持包括x86, x86_64, IA-64, ARM, AArch64, PowerPC, MIPS在内的多种架构。
缺点如下:
- 复杂性:使用
libunwind可能需要对堆栈帧和底层架构有深入的理解。 - 性能开销:虽然设计上考虑了效率,但任何堆栈展开操作都会增加额外的运行时开销。
- 平台差异:虽然
libunwind旨在可移植,但不同平台的实现差异可能导致在特定环境下的行为不一致。
libunwind是一个功能强大的库,适用于需要堆栈跟踪的多种应用场景。尽管存在一定的学习曲线和性能考量,但它的精确度和非侵入性使其成为许多系统和应用程序的首选工具。
本文并不会去深入了解libunwind库,而是简单讲讲如何使用和打印基础的线程堆栈信息,比如结合信号处理。
1.2 backtrace介绍
backtrace 是一个在 GNU libc (glibc) 中提供的库函数,用于生成程序的调用栈跟踪。这个功能通常在程序出现错误或异常行为时使用,帮助开发者诊断问题。backtrace 函数能够查看当前线程的调用栈,并记录每一层调用栈帧的地址。
backtrace 函数可以获取当前程序执行的调用栈的一个快照。它的原型如下:
#include <execinfo.h>

int backtrace(void **buffer, int size);
- buffer: 一个指针数组,用于存储堆栈帧的地址。
- size: 指定数组的大小,即最大可以捕获的堆栈帧数量。
该函数返回实际捕获的堆栈帧数量,最多为 size。在实际使用时,你需要提前分配一个足够大的指针数组来存储返回的地址。
获取到调用栈地址之后,为了将这些地址转换为对应的函数名和偏移量,可以使用 backtrace_symbols 函数:
#include <execinfo.h>
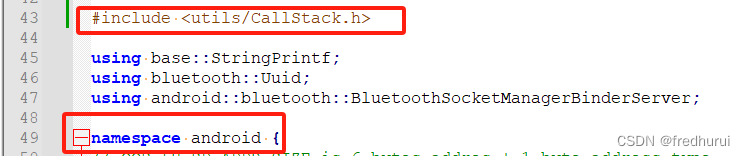
char **backtrace_symbols(void *const *buffer, int size);
- buffer:
backtrace函数返回的地址数组。 - size:
backtrace函数返回的堆栈帧数量。
该函数返回一个指针,指向新分配的字符串数组。每个字符串包含对应堆栈帧的可打印信息,通常包括函数名、偏移地址和实际的内存地址。
backtrace 通常用于以下情况:
- 错误处理:在错误处理代码中获取当前的函数调用序列。
- 信号处理:在信号处理函数中记录调用栈,尤其是处理诸如段错误之类的信号时。
- 调试目的:当编写调试信息或分析程序行为时,可以使用
backtrace来打印调用栈。
backtrace需要注意如下事项:
backtrace函数不会列出静态或内联函数的调用记录,因为这些信息在编译时可能已被优化掉。- 生成的符号信息的可读性取决于程序是否包含了调试信息(例如,是否使用了
-g编译选项)。 - 在优化过的代码中,调用栈可能不完整或不准确。
实际使用会发现backtrace并不如libunwind好用,特别是函数名缺失较多,可见后续使用对比。
1.3 libunwind安装
在 Linux 系统下安装 libunwind 库通常可以通过包管理系统或者从源代码编译安装两种方式进行。以下是这两种方法的基本步骤:
(1) 通过包管理器安装:
对于基于 Debian 的系统(如 Ubuntu),使用 apt-get:
sudo apt-get update
sudo apt-get install libunwind-dev
对于基于 Red Hat 的系统(如 Fedora),使用 dnf 或 yum:
使用 dnf:
sudo dnf install libunwind
使用 yum:
sudo yum install libunwind
对于 Arch Linux,使用 pacman:
sudo pacman -S libunwind
(2) 从源代码编译安装:
如果你需要安装的是最新版本或者包管理器中没有提供 libunwind,你可以从源代码编译安装。首先,你需要从官方网站或者分布式版本控制系统中获取最新的源代码。以下是从源代码编译安装的大致步骤:
安装编译所需的工具和库(如
autoconf,automake,libtool等):对于 Debian/Ubuntu 系统:
sudo apt-get install autoconf automake libtool gcc对于 Red Hat 系统:
sudo dnf install autoconf automake libtool gcc或者
sudo yum install autoconf automake libtool gcc获取源代码:
你可以从 libunwind 的官方网站下载最新的源码包,或者如果项目托管在如 GitHub 这样的服务上,可以使用
git克隆仓库:git clone https://github.com/libunwind/libunwind.git编译和安装:
cd libunwind
./autogen.sh    # 如果是从 git 克隆的仓库可能需要这步
./configure     # 根据你的需求可能需要添加配置选项
make
sudo make install
这些步骤会将 libunwind 安装到默认的系统位置(通常是 /usr/local/),如果你需要安装到别的位置,可以在 ./configure 命令中使用 --prefix 选项来指定安装路径。
请注意,编译源代码可能会遇到依赖问题或其他编译问题。如果你遇到错误,仔细阅读错误信息,并根据需要安装任何缺少的依赖或调整编译选项。
1.4 获取指令地址(IP)所属二进制文件路径
libunwind 是一个可移植且高效的 C 语言库,用于确定程序的调用链(backtrace)。它特别适用于帮助实现程序的错误报告功能,和需要对程序崩溃进行后处理的情况。
当你使用 libunwind 来获取程序的 backtrace 时,libunwind 可以提供关于每一个栈帧的信息,包括该帧的指令指针(IP)。然而,要确定这个指令指针所属的二进制文件,你需要进行额外的步骤。libunwind 本身并不直接提供这个功能,但是你可以使用其他的方法来实现这一点。
以下是一些在 Linux 下确定符号所属二进制文件的方法:
使用
/proc/<pid>/maps文件Linux 提供了一个特殊的
/proc文件系统,其中包含了关于正在运行的进程的信息。/proc/<pid>/maps文件列出了进程的内存映射,包括加载的二进制文件和库。通过比较你从
libunwind获取到的指令指针(IP)地址与/proc/<pid>/maps文件中的地址范围,你可以确定 IP 所属的二进制文件或共享库。结合使用
dladdr()函数``dladdr()
函数是 GNU C 库的一部分,可以将指令指针转换为对应的动态链接符号信息(Dl_info` 结构),包括符号所在的共享库的名称。如果
libunwind返回了指令指针,你可以用它调用dladdr()来获取包含该指令的共享库的路径。
以下是一个使用 dladdr() 的例子:
#include <stdio.h>
#include <dlfcn.h>
#include <libunwind.h>

void print_backtrace() {

    unw_cursor_t cursor;
    unw_context_t uc;
    unw_word_t ip;

    unw_getcontext(&uc);
    unw_init_local(&cursor, &uc);

    while (unw_step(&cursor) > 0) {

        unw_get_reg(&cursor, UNW_REG_IP, &ip);
        Dl_info dlinfo;
        if (dladdr((void *)ip, &dlinfo) && dlinfo.dli_fname) {

            printf("IP: %lx (%s)\n", (long)ip, dlinfo.dli_fname);
        } else {

            printf("IP: %lx (unknown)\n", (long)ip);
        }
    }
}

int main() {

    print_backtrace();
    return 0;
}
在这个示例中,print_backtrace 函数使用 libunwind 来遍历当前的栈帧并获取每一帧的指令指针(IP)。然后,它使用 dladdr 来获取每个 IP 所在的共享库的名称。这可以帮助你确定每个栈帧所对应的二进制文件或共享库。
请注意,dladdr 只能返回动态共享对象的信息。对于静态链接的二进制文件,你可能需要使用其他工具,如 addr2line 或 objdump,结合编译时的调试信息来解析符号名称和源代码位置。
2. 实例分析
2.1 backtrace使用
使用比较简单,可以编写如下代码:
#include <stdio.h>
#include <stdint.h>
#include <stdlib.h>
#include <execinfo.h>

static void do_backtrace(void)
{
    void  *array[20];
    int    size;
    char **strings;
    int    i;

    // 获取当前的调用堆栈
    size = backtrace(array, 20);

    // 将堆栈中的地址转换为易于阅读的符号(函数名等)
    strings = backtrace_symbols(array, size);

    printf("Obtained %d stack frames.\n", size);

    for (i = 0; i < size; i++) {
        printf("%s\n", strings[i]);
    }

    free(strings);
}

static void test_func_a(void)
{
    do_backtrace();
    return;
}

static void test_func_b(void)
{
    test_func_a();
    return;
}

static void test_func_c(void)
{
    test_func_b();
    return;
}

int main(void)
{
    test_func_c();
    return 0;
}
然后直接编译可执行程序:
ubuntu->server:$ gcc -o test-main.out test-main.c
ubuntu->server:$ ./test-main.out
Obtained 8 stack frames.
./test-main.out(+0x121b) [0x561a9909921b]
./test-main.out(+0x12d4) [0x561a990992d4]
./test-main.out(+0x12e4) [0x561a990992e4]
./test-main.out(+0x12f4) [0x561a990992f4]
./test-main.out(+0x1304) [0x561a99099304]
/lib/x86_64-linux-gnu/libc.so.6(+0x29d90) [0x7fc40e6c8d90]
/lib/x86_64-linux-gnu/libc.so.6(__libc_start_main+0x80) [0x7fc40e6c8e40]
./test-main.out(+0x1125) [0x561a99099125]
ubuntu->server:$ file test-main.out
test-main.out: ELF 64-bit LSB pie executable, x86-64, version 1 (SYSV), dynamically linked, interpreter /lib64/ld-linux-x86-64.so.2, BuildID[sha1]=c2ea9853654d36609ea515cd7175467fb09a069e, for GNU/Linux 3.2.0, not stripped
可以看到,在默认情况编译情况下,没有带-g参数,所以编译出来的二进制程序没有符号信息,因此打印出来的堆栈就只有一堆“地址”,难以阅读。
ubuntu->server:$ gcc -o test-main.out test-main.c -g
ubuntu->server:$ file test-main.out
test-main.out: ELF 64-bit LSB pie executable, x86-64, version 1 (SYSV), dynamically linked, interpreter /lib64/ld-linux-x86-64.so.2, BuildID[sha1]=294fd4aed36f34ad815edbaed6f3c0228e4494e2, for GNU/Linux 3.2.0, with debug_info, not stripped
ubuntu->server:$ ./test-main.out
Obtained 8 stack frames.
./test-main.out(+0x121b) [0x55893f27e21b]
./test-main.out(+0x12d4) [0x55893f27e2d4]
./test-main.out(+0x12e4) [0x55893f27e2e4]
./test-main.out(+0x12f4) [0x55893f27e2f4]
./test-main.out(+0x1304) [0x55893f27e304]
/lib/x86_64-linux-gnu/libc.so.6(+0x29d90) [0x7fb2bc75fd90]
/lib/x86_64-linux-gnu/libc.so.6(__libc_start_main+0x80) [0x7fb2bc75fe40]
./test-main.out(+0x1125) [0x55893f27e125]
不过,即使增加了-g标识,也无法打印函数名,这是因为backtrace无法识别本地符号,必须要全局动态链接符号才行。
#全局动态符号不能显示
ubuntu->server:$ objdump -t test-main.out
......
00000000000011e9 l     F .text  00000000000000de              do_backtrace
00000000000012c7 l     F .text  0000000000000010              test_func_a
00000000000012d7 l     F .text  0000000000000010              test_func_b
00000000000012e7 l     F .text  0000000000000010              test_func_c
......
所以链接的时候需要传递一个参数rdynamic用于保留符号表:
LDFLAGS += -rdynamic# 生成动态链接库时, 保留符号表
修改如下,把test_func_c改为全局函数:
void test_func_c(void)
{
    test_func_b();
    return;
}
编译时,加上-rdynamic参数,然后运行:
ubuntu->server:$ gcc -o test-main.out test-main.c -g -rdynamic
ubuntu->server:$ ./test-main.out
Obtained 8 stack frames.
./test-main.out(+0x121b) [0x55730152a21b]
./test-main.out(+0x12d4) [0x55730152a2d4]
./test-main.out(+0x12e4) [0x55730152a2e4]
./test-main.out(test_func_c+0xd) [0x55730152a2f4]
./test-main.out(main+0xd) [0x55730152a304]
/lib/x86_64-linux-gnu/libc.so.6(+0x29d90) [0x7fb35a228d90]
/lib/x86_64-linux-gnu/libc.so.6(__libc_start_main+0x80) [0x7fb35a228e40]
./test-main.out(_start+0x25) [0x55730152a125]
可以清晰看到,全局函数可以显示,本地局部函数仍然不行,所以实际场景下使用体验较差。
2.2 libunwind库使用
继续上面的测试,现在添加libunwind使用函数,整个代码如下:
#include <stdio.h>
#include <stdint.h>
#include <stdlib.h>
#include <string.h>
#include <execinfo.h>
#include <libunwind.h>
#include <unistd.h>
#include <sys/prctl.h>
#include <errno.h>

static void libunwind_backtrace(void)
{
    int32_t       ret, count, len, max_len;
    unw_cursor_t  cursor;
    unw_context_t context;
    unw_word_t    offset, pc, sp;
    char          fname[256], comm_name[32];
    char          buffer[4096];

    /* Initialize cursor to current frame for local unwinding. */
    if (unw_getcontext(&context) != 0) {
        printf("unw_getcontext error.\n");
        return;
    }
    if (unw_init_local(&cursor, &context) != 0) {
        printf("unw_init_local error.\n");
        return;
    }

    /* 获取当前线程名字, 通过prctl */
    memset(comm_name, 0, sizeof(comm_name));
    if (prctl(PR_GET_NAME, comm_name) != 0) {
        printf("prctl error : %s(%d).\n", strerror(errno), errno);
        snprintf(comm_name, sizeof(comm_name), "(unknown)");
    }

    len     = 0;
    max_len = sizeof(buffer);
    count   = 0;
    len += snprintf(buffer, (size_t)max_len, "Stack trace for [%s]:\n", comm_name);
    // Unwind frames one by one, going up the frame stack.
    while (unw_step(&cursor) > 0) {
        if (unw_get_reg(&cursor, UNW_REG_IP, &pc) != 0) {
            printf("unw_get_reg error.\n");
            return;
        }
        /* 获取栈指针SP的值 */
        if (unw_get_reg(&cursor, UNW_REG_SP, &sp) != 0) {
            printf("unw_get_reg error.\n");
            return;
        };

        ret = unw_get_proc_name(&cursor, fname, sizeof(fname), &offset);
        if (ret != 0) {
            snprintf(fname, sizeof(fname), "??????");
            offset = 0;
        }
        len += snprintf(buffer + len, (size_t)(max_len - len),
            "[%2d]-> PC 0x%-12lx, SP 0x%-12lx: [%s](+0x%lx)\n", count++, pc, sp, fname, offset);
        if (len >= max_len - 1) {
            break;
        }
    }

    buffer[sizeof(buffer) - 1] = '\0'; /* Ensure null termination. */
    printf("%s", buffer);

    return;
}

static void do_backtrace(void)
{
    void  *array[20];
    int    size;
    char **strings;
    int    i;

    // 获取当前的调用堆栈
    size = backtrace(array, 20);

    // 将堆栈中的地址转换为易于阅读的符号(函数名等)
    strings = backtrace_symbols(array, size);

    printf("Obtained %d stack frames.\n", size);

    for (i = 0; i < size; i++) {
        printf("%s\n", strings[i]);
    }

    free(strings);
}

static void test_func_a(void)
{
    do_backtrace();
    return;
}

static void test_func_b(void)
{
    test_func_a();
    return;
}

void test_func_c(void)
{
    test_func_b();
    return;
}

int main(void)
{
    test_func_c();
    return 0;
}
然后便可以开始编译了:’
ubuntu->server:$ gcc -o test-main.out test-main.c -rdynamic
/usr/bin/ld: /tmp/cckd8b97.o: in function `libunwind_backtrace':
test-main.c:(.text+0x36): undefined reference to `_Ux86_64_getcontext'
/usr/bin/ld: test-main.c:(.text+0x67): undefined reference to `_Ux86_64_init_local'
/usr/bin/ld: test-main.c:(.text+0x175): undefined reference to `_Ux86_64_get_reg'
/usr/bin/ld: test-main.c:(.text+0x1a8): undefined reference to `_Ux86_64_get_reg'
/usr/bin/ld: test-main.c:(.text+0x1e5): undefined reference to `_Ux86_64_get_proc_name'
/usr/bin/ld: test-main.c:(.text+0x2ae): undefined reference to `_Ux86_64_step'
collect2: error: ld returned 1 exit status
可以看到报错,这是因为linunwind库需要链接,而且不同架构下链接的库还有所区别:
ubuntu->server:$ find /usr/ -name "libunwind*"
/usr/lib/x86_64-linux-gnu/libunwind-x86_64.so
/usr/lib/x86_64-linux-gnu/libunwind-generic.so
/usr/lib/x86_64-linux-gnu/libunwind-x86_64.so.8
/usr/lib/x86_64-linux-gnu/libunwind-ptrace.so
/usr/lib/x86_64-linux-gnu/libunwind-ptrace.a
/usr/lib/x86_64-linux-gnu/libunwind-x86_64.a
/usr/lib/x86_64-linux-gnu/libunwind-coredump.so.0
/usr/lib/x86_64-linux-gnu/libunwind-coredump.a
/usr/lib/x86_64-linux-gnu/libunwind-generic.a
/usr/lib/x86_64-linux-gnu/libunwind.so.8.0.1
/usr/lib/x86_64-linux-gnu/libunwind.so
/usr/lib/x86_64-linux-gnu/libunwind-coredump.so
/usr/lib/x86_64-linux-gnu/libunwind-x86_64.so.8.0.1
/usr/lib/x86_64-linux-gnu/libunwind-ptrace.so.0
/usr/lib/x86_64-linux-gnu/libunwind-coredump.so.0.0.0
/usr/lib/x86_64-linux-gnu/libunwind.so.8
/usr/lib/x86_64-linux-gnu/libunwind.a
/usr/lib/x86_64-linux-gnu/libunwind-ptrace.so.0.0.0
可以看到libunwind相关的库还是挺多的,一般aarch64架构只需要链接-lunwind-generic,而X86需要额外链接-lunwind。
如下再次编译(如果没有libunwind库,请先安装库再编译):
ubuntu->server:$ gcc -o test-main.out test-main.c -rdynamic -lunwind -lunwind-generic
ubuntu->server:$ ./test-main.out
Obtained 8 stack frames.
./test-main.out(+0x1654) [0x558f27015654]
./test-main.out(+0x170d) [0x558f2701570d]
./test-main.out(+0x1722) [0x558f27015722]
./test-main.out(test_func_c+0xc) [0x558f27015732]
./test-main.out(main+0xc) [0x558f27015742]
/lib/x86_64-linux-gnu/libc.so.6(+0x29d8f) [0x7f0fe523bd8f]
/lib/x86_64-linux-gnu/libc.so.6(__libc_start_main+0x7f) [0x7f0fe523be3f]
./test-main.out(_start+0x24) [0x558f27015264]
Stack trace for [test-main.out]:
[ 0]-> PC 0x558f27015713, SP 0x7ffeab3ead80: [test_func_a](+0x12)
[ 1]-> PC 0x558f27015723, SP 0x7ffeab3ead90: [test_func_b](+0xd)
[ 2]-> PC 0x558f27015733, SP 0x7ffeab3eada0: [test_func_c](+0xd)
[ 3]-> PC 0x558f27015743, SP 0x7ffeab3eadb0: [main](+0xd)
[ 4]-> PC 0x7f0fe523bd90, SP 0x7ffeab3eadc0: [__libc_init_first](+0x90)
[ 5]-> PC 0x7f0fe523be40, SP 0x7ffeab3eae60: [__libc_start_main](+0x80)
[ 6]-> PC 0x558f27015265, SP 0x7ffeab3eaeb0: [_start](+0x25)
可以看到,对于libunwind来说,只要携带符号信息,就可以打印出函数名,无论该函数是否为本地函数或者全局函数,这是libunwind比backtrace更好的地方。
但是不足点也有,libunwind的打印数据需要自行排版和读取,比如符号的二进制文件,就没有显示出来(需要结合/proc/xx/maps地址空间映射来判断):
ubuntu->server:$ cat /proc/self/maps
55867721e000-558677220000 r--p 00000000 fc:02 558                        /usr/bin/cat
558677220000-558677224000 r-xp 00002000 fc:02 558                        /usr/bin/cat
558677224000-558677226000 r--p 00006000 fc:02 558                        /usr/bin/cat
......
如果使用libunwind,可以手动读取该文件并且确定函数所属二进制文件,也可以使用dladdr函数确定。
2.3 优化和内联场景
下面我们来试一试内联优化场景下堆栈打印,此时一些函数被直接内联,也就不存在函数调用,那么还能打印函数名吗?
首先使用两个宏来精准控制内联情况:
#define always_inline __attribute__((always_inline))
#define no_inline     __attribute__((noinline))
通过这两个宏,可以精准控制函数是否内联,默认优化等级为-o0,此时不会进行内联(always_inline可以强制内联)。如果优化等级足够高,即使没有内联标记,编译器也会自行内联。
下面指定test_func_b内联,其他函数不内联:
always_inline static inline void test_func_b(void)
{

    test_func_a();
    return;
}
下面直接使用-00默认优化等级测试,我们只关注内联函数是否能被识别出来:
ubuntu->server:$ gcc -o test-main.out test-main.c -rdynamic -lunwind -lunwind-generic
ubuntu->server:$ ./test-main.out
Obtained 7 stack frames.
./test-main.out(+0x1654) [0x56363bcb5654]
./test-main.out(+0x170d) [0x56363bcb570d]
./test-main.out(test_func_c+0xc) [0x56363bcb5722]
./test-main.out(main+0xc) [0x56363bcb5733]
/lib/x86_64-linux-gnu/libc.so.6(+0x29d8f) [0x7f0d2a97bd8f]
/lib/x86_64-linux-gnu/libc.so.6(__libc_start_main+0x7f) [0x7f0d2a97be3f]
./test-main.out(_start+0x24) [0x56363bcb5264]
Stack trace for [test-main.out]:
[ 0]-> PC 0x56363bcb5713, SP 0x7ffc26c58f20: [test_func_a](+0x12)
[ 1]-> PC 0x56363bcb5723, SP 0x7ffc26c58f30: [test_func_c](+0xd)
[ 2]-> PC 0x56363bcb5734, SP 0x7ffc26c58f40: [main](+0xd)
[ 3]-> PC 0x7f0d2a97bd90, SP 0x7ffc26c58f50: [__libc_init_first](+0x90)
[ 4]-> PC 0x7f0d2a97be40, SP 0x7ffc26c58ff0: [__libc_start_main](+0x80)
[ 5]-> PC 0x56363bcb5265, SP 0x7ffc26c59040: [_start](+0x25)
可以看到,对于backtrace和libunwind都无法识别到内联的函数。
2.4 打印函数所属二进制文件
下面使用dladdr进行测试,整个代码文件如下:
#include <stdio.h>
#include <stdint.h>
#include <stdlib.h>
#include <string.h>
#include <execinfo.h>
#include <libunwind.h>
#include <unistd.h>
#include <sys/prctl.h>
#include <errno.h>

#define __USE_GNU
#include <dlfcn.h>

#define always_inline __attribute__((always_inline))
#define no_inline     __attribute__((noinline))

no_inline static void libunwind_backtrace(void)
{
    int32_t       ret, count, len, max_len;
    unw_cursor_t  cursor;
    unw_context_t context;
    unw_word_t    offset, pc, sp;
    Dl_info       dl_info;
    const char   *dname;
    char          fname[256], comm_name[32];
    char          buffer[4096];

    /* Initialize cursor to current frame for local unwinding. */
    if (unw_getcontext(&context) != 0) {
        printf("unw_getcontext error.\n");
        return;
    }
    if (unw_init_local(&cursor, &context) != 0) {
        printf("unw_init_local error.\n");
        return;
    }

    /* 获取当前线程名字, 通过prctl */
    memset(comm_name, 0, sizeof(comm_name));
    if (prctl(PR_GET_NAME, comm_name) != 0) {
        printf("prctl error : %s(%d).\n", strerror(errno), errno);
        snprintf(comm_name, sizeof(comm_name), "(unknown)");
    }

    len     = 0;
    max_len = sizeof(buffer);
    count   = 0;
    len += snprintf(buffer, (size_t)max_len, "Stack trace for [%s]:\n", comm_name);
    // Unwind frames one by one, going up the frame stack.
    while (unw_step(&cursor) > 0) {
        if (unw_get_reg(&cursor, UNW_REG_IP, &pc) != 0) {
            printf("unw_get_reg error.\n");
            return;
        }
        /* 获取栈指针SP的值 */
        if (unw_get_reg(&cursor, UNW_REG_SP, &sp) != 0) {
            printf("unw_get_reg error.\n");
            return;
        };

        ret = unw_get_proc_name(&cursor, fname, sizeof(fname), &offset);
        if (ret != 0) {
            snprintf(fname, sizeof(fname), "??????");
            offset = 0;
        }

        /* 获取符号所属二进制文件名 */
        if (dladdr((void *)pc, &dl_info) && dl_info.dli_fname) {
            dname = dl_info.dli_fname;
        } else {
            dname = "(unknown)";
        }

        len += snprintf(buffer + len, (size_t)(max_len - len),
            "[%2d]-> PC 0x%-12lx, SP 0x%-12lx: [%s](+0x%lx) from [%s]\n", count++, pc, sp, fname,
            offset, dname);
        if (len >= max_len - 1) {
            break;
        }
    }

    buffer[sizeof(buffer) - 1] = '\0'; /* Ensure null termination. */
    printf("%s", buffer);

    return;
}

no_inline static void do_backtrace(void)
{
    void  *array[20];
    int    size;
    char **strings;
    int    i;

    // 获取当前的调用堆栈
    size = backtrace(array, 20);

    // 将堆栈中的地址转换为易于阅读的符号(函数名等)
    strings = backtrace_symbols(array, size);

    printf("Obtained %d stack frames.\n", size);

    for (i = 0; i < size; i++) {
        printf("%s\n", strings[i]);
    }

    free(strings);
}

no_inline static void test_func_a(void)
{
    do_backtrace();
    libunwind_backtrace();
    return;
}

always_inline static inline void test_func_b(void)
{
    test_func_a();
    return;
}

no_inline void test_func_c(void)
{
    test_func_b();
    return;
}

int main(void)
{
    test_func_c();
    return 0;
}
编译测试如下:
ubuntu->server:$ gcc -o test-main.out test-main.c -rdynamic -lunwind -lunwind-generic
ubuntu->server:$ ./test-main.out
Obtained 7 stack frames.
./test-main.out(+0x16c8) [0x55b87f7736c8]
./test-main.out(+0x1781) [0x55b87f773781]
./test-main.out(test_func_c+0xc) [0x55b87f773796]
./test-main.out(main+0xc) [0x55b87f7737a7]
/lib/x86_64-linux-gnu/libc.so.6(+0x29d8f) [0x7fa0da400d8f]
/lib/x86_64-linux-gnu/libc.so.6(__libc_start_main+0x7f) [0x7fa0da400e3f]
./test-main.out(_start+0x24) [0x55b87f773284]
Stack trace for [test-main.out]:
[ 0]-> PC 0x55b87f773787, SP 0x7ffe07efae30: [test_func_a](+0x12) from [./test-main.out]
[ 1]-> PC 0x55b87f773797, SP 0x7ffe07efae40: [test_func_c](+0xd) from [./test-main.out]
[ 2]-> PC 0x55b87f7737a8, SP 0x7ffe07efae50: [main](+0xd) from [./test-main.out]
[ 3]-> PC 0x7fa0da400d90, SP 0x7ffe07efae60: [__libc_init_first](+0x90) from [/lib/x86_64-linux-gnu/libc.so.6]
[ 4]-> PC 0x7fa0da400e40, SP 0x7ffe07efaf00: [__libc_start_main](+0x80) from [/lib/x86_64-linux-gnu/libc.so.6]
[ 5]-> PC 0x55b87f773285, SP 0x7ffe07efaf50: [_start](+0x25) from [./test-main.out]
可以看到,比较符合预期效果,能打印出动态链接符号所属的动态库路径。
2.5 信号中断里打印堆栈(可用于手动触发)
整体代码如下:
#include <stdio.h>
#include <stdint.h>
#include <stdlib.h>
#include <string.h>
#include <execinfo.h>
#include <libunwind.h>
#include <unistd.h>
#include <sys/prctl.h>
#include <errno.h>
#include <signal.h>

#define __USE_GNU
#include <dlfcn.h>

#define always_inline __attribute__((always_inline))
#define no_inline     __attribute__((noinline))

no_inline static void libunwind_backtrace(void)
{
    int32_t       ret, count, len, max_len;
    unw_cursor_t  cursor;
    unw_context_t context;
    unw_word_t    offset, pc, sp;
    Dl_info       dl_info;
    const char   *dname;
    char          fname[256], comm_name[32];
    char          buffer[4096];

    /* Initialize cursor to current frame for local unwinding. */
    if (unw_getcontext(&context) != 0) {
        printf("unw_getcontext error.\n");
        return;
    }
    if (unw_init_local(&cursor, &context) != 0) {
        printf("unw_init_local error.\n");
        return;
    }

    /* 获取当前线程名字, 通过prctl */
    memset(comm_name, 0, sizeof(comm_name));
    if (prctl(PR_GET_NAME, comm_name) != 0) {
        printf("prctl error : %s(%d).\n", strerror(errno), errno);
        snprintf(comm_name, sizeof(comm_name), "(unknown)");
    }

    len     = 0;
    max_len = sizeof(buffer);
    count   = 0;
    len += snprintf(buffer, (size_t)max_len, "Stack trace for [%s]:\n", comm_name);
    // Unwind frames one by one, going up the frame stack.
    while (unw_step(&cursor) > 0) {
        if (unw_get_reg(&cursor, UNW_REG_IP, &pc) != 0) {
            printf("unw_get_reg error.\n");
            return;
        }
        /* 获取栈指针SP的值 */
        if (unw_get_reg(&cursor, UNW_REG_SP, &sp) != 0) {
            printf("unw_get_reg error.\n");
            return;
        };

        ret = unw_get_proc_name(&cursor, fname, sizeof(fname), &offset);
        if (ret != 0) {
            snprintf(fname, sizeof(fname), "??????");
            offset = 0;
        }

        /* 获取符号所属二进制文件名 */
        if (dladdr((void *)pc, &dl_info) && dl_info.dli_fname) {
            dname = dl_info.dli_fname;
        } else {
            dname = "(unknown)";
        }

        len += snprintf(buffer + len, (size_t)(max_len - len),
            "[%2d]-> PC 0x%-12lx, SP 0x%-12lx: [%s](+0x%lx) from [%s]\n", count++, pc, sp, fname,
            offset, dname);
        if (len >= max_len - 1) {
            break;
        }
    }

    buffer[sizeof(buffer) - 1] = '\0'; /* Ensure null termination. */
    printf("%s", buffer);

    return;
}

no_inline static void do_backtrace(void)
{
    void  *array[20];
    int    size;
    char **strings;
    int    i;

    // 获取当前的调用堆栈
    size = backtrace(array, 20);

    // 将堆栈中的地址转换为易于阅读的符号(函数名等)
    strings = backtrace_symbols(array, size);

    printf("Obtained %d stack frames.\n", size);

    for (i = 0; i < size; i++) {
        printf("%s\n", strings[i]);
    }

    free(strings);
}

no_inline static void test_func_a(void)
{
    do_backtrace();
    libunwind_backtrace();
    return;
}

always_inline static inline void test_func_b(void)
{
    test_func_a();
    return;
}

no_inline void test_func_c(void)
{
    test_func_b();
    return;
}

/* 信号处理函数 */
static void sigint_cb(int32_t signo)
{
    printf("sigint_cb.\n");
    do_backtrace();
    libunwind_backtrace();
    signal(signo, SIG_DFL);
}

int main(void)
{
    /* 注册信号处理函数 */
    signal(SIGINT, sigint_cb);
    test_func_c();
    while (1) {
        sleep(1);
    }
    return 0;
}
添加了一个中断处理函数SIGINT,在里面打印堆栈,编译测试如下:
ubuntu->server:$ gcc -o test-main.out test-main.c -rdynamic -lunwind -lunwind-generic
ubuntu->server:$ ./test-main.out
Obtained 7 stack frames.
./test-main.out(+0x1708) [0x5628406dd708]
./test-main.out(+0x17c1) [0x5628406dd7c1]
./test-main.out(test_func_c+0xc) [0x5628406dd7d6]
./test-main.out(main+0x20) [0x5628406dd835]
/lib/x86_64-linux-gnu/libc.so.6(+0x29d8f) [0x7f376db96d8f]
/lib/x86_64-linux-gnu/libc.so.6(__libc_start_main+0x7f) [0x7f376db96e3f]
./test-main.out(_start+0x24) [0x5628406dd2c4]
Stack trace for [test-main.out]:
[ 0]-> PC 0x5628406dd7c7, SP 0x7ffe2306a7d0: [test_func_a](+0x12) from [./test-main.out]
[ 1]-> PC 0x5628406dd7d7, SP 0x7ffe2306a7e0: [test_func_c](+0xd) from [./test-main.out]
[ 2]-> PC 0x5628406dd836, SP 0x7ffe2306a7f0: [main](+0x21) from [./test-main.out]
[ 3]-> PC 0x7f376db96d90, SP 0x7ffe2306a800: [__libc_init_first](+0x90) from [/lib/x86_64-linux-gnu/libc.so.6]
[ 4]-> PC 0x7f376db96e40, SP 0x7ffe2306a8a0: [__libc_start_main](+0x80) from [/lib/x86_64-linux-gnu/libc.so.6]
[ 5]-> PC 0x5628406dd2c5, SP 0x7ffe2306a8f0: [_start](+0x25) from [./test-main.out]
^Csigint_cb.
Obtained 10 stack frames.
./test-main.out(+0x1708) [0x5628406dd708]
./test-main.out(+0x17fd) [0x5628406dd7fd]
/lib/x86_64-linux-gnu/libc.so.6(+0x4251f) [0x7f376dbaf51f]
/lib/x86_64-linux-gnu/libc.so.6(clock_nanosleep+0x5a) [0x7f376dc527fa]
/lib/x86_64-linux-gnu/libc.so.6(__nanosleep+0x16) [0x7f376dc576e6]
/lib/x86_64-linux-gnu/libc.so.6(sleep+0x3d) [0x7f376dc5761d]
./test-main.out(main+0x2a) [0x5628406dd83f]
/lib/x86_64-linux-gnu/libc.so.6(+0x29d8f) [0x7f376db96d8f]
/lib/x86_64-linux-gnu/libc.so.6(__libc_start_main+0x7f) [0x7f376db96e3f]
./test-main.out(_start+0x24) [0x5628406dd2c4]
Stack trace for [test-main.out]:
[ 0]-> PC 0x5628406dd803, SP 0x7ffe23069a20: [sigint_cb](+0x28) from [./test-main.out]
[ 1]-> PC 0x7f376dbaf520, SP 0x7ffe23069a40: [__sigaction](+0x50) from [/lib/x86_64-linux-gnu/libc.so.6]
[ 2]-> PC 0x7f376dc527fa, SP 0x7ffe2306a720: [clock_nanosleep](+0x5a) from [/lib/x86_64-linux-gnu/libc.so.6]
[ 3]-> PC 0x7f376dc576e7, SP 0x7ffe2306a7a0: [__nanosleep](+0x17) from [/lib/x86_64-linux-gnu/libc.so.6]
[ 4]-> PC 0x7f376dc5761e, SP 0x7ffe2306a7b0: [sleep](+0x3e) from [/lib/x86_64-linux-gnu/libc.so.6]
[ 5]-> PC 0x5628406dd840, SP 0x7ffe2306a7f0: [main](+0x2b) from [./test-main.out]
[ 6]-> PC 0x7f376db96d90, SP 0x7ffe2306a800: [__libc_init_first](+0x90) from [/lib/x86_64-linux-gnu/libc.so.6]
[ 7]-> PC 0x7f376db96e40, SP 0x7ffe2306a8a0: [__libc_start_main](+0x80) from [/lib/x86_64-linux-gnu/libc.so.6]
[ 8]-> PC 0x5628406dd2c5, SP 0x7ffe2306a8f0: [_start](+0x25) from [./test-main.out]
^C
可以看到,中断打印效果不错,在实际使用中,可以放在SIGABRT/SIGBUS/SIGFPE/SIGPIPE等coredump信号,或者SIGUSR这样的用户信号,来定向打印指定线程的堆栈。


![[金融支付]EMV是什么?](https://img-blog.csdnimg.cn/direct/dbf2ac1c783947c9af80cc12f0685be9.png)