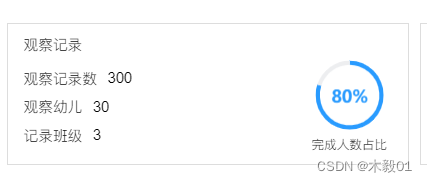
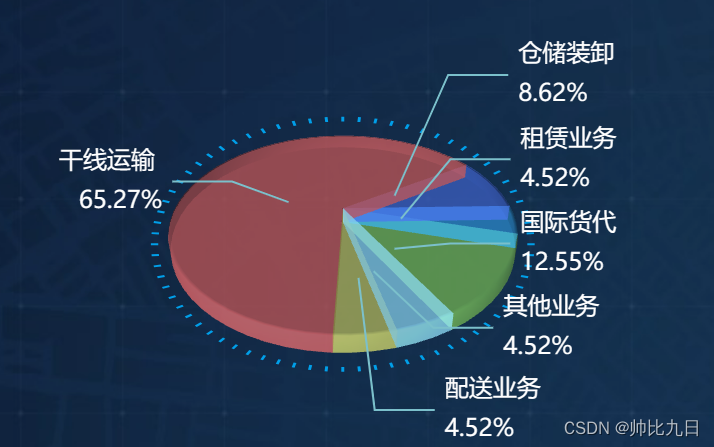
其他echarts:
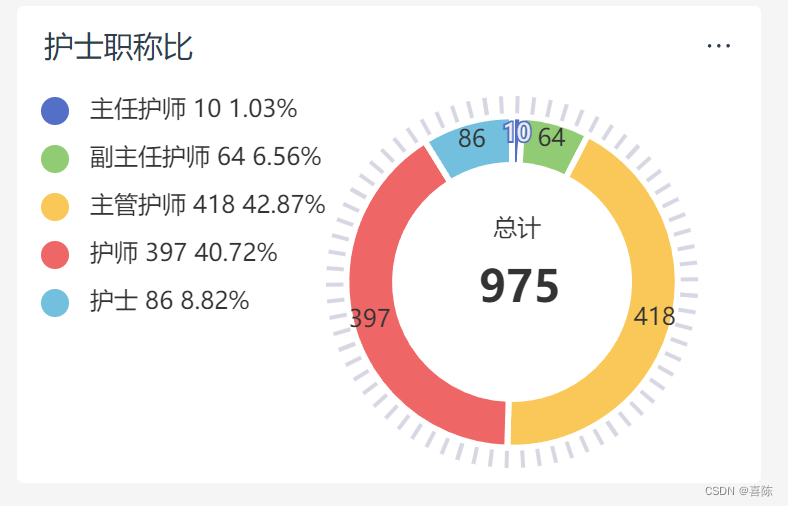
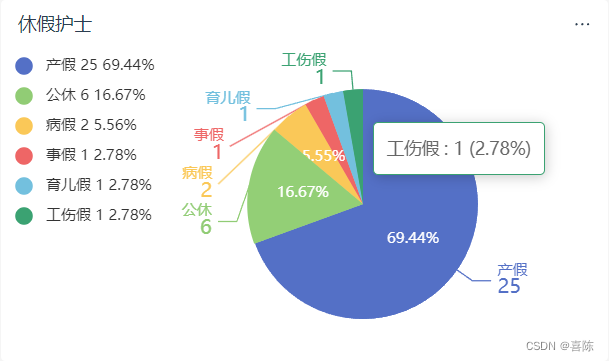
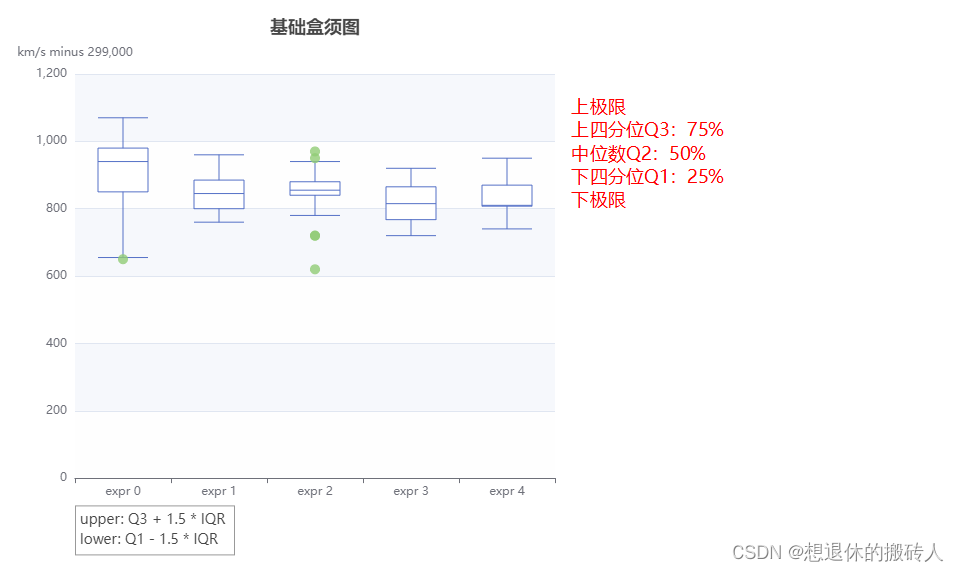
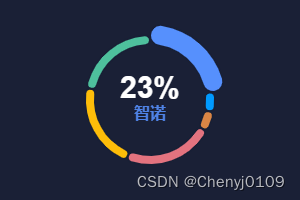
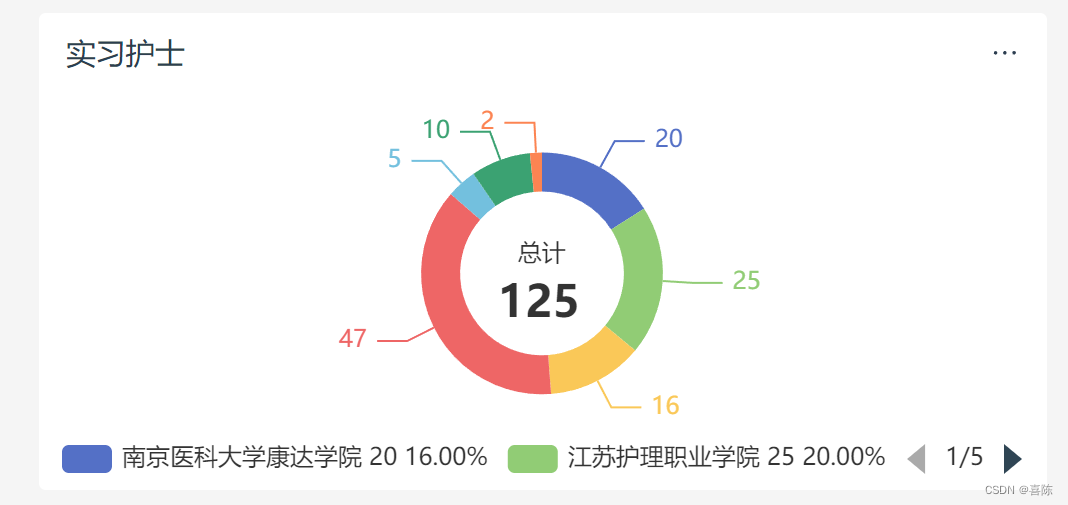
效果图:
代码:
<template>
  <div class="wrapper">
    <!-- 环形图 -->
    <div ref="doughnutChart" id="doughnutChart"></div>
  </div>
</template>

<script>
export default {
  mixins: [],
  components: {},
  props: {
    table: {
      type: Object,
      default: {
        datas: {},
        color: [],
      },
    },
    hollowOut: {
      //是否中空
      type: Boolean,
      default: false,
    },
  },
  data() {
    return {
      limitLength: 7, //显示name长度
      showTotalNum: false, //是否显示总数
      totalNum: 100, //总数
      showLegend: false, //是否显示label标签
    };
  },

  created() {},
  mounted() {},
  watch: {
    table: {
      handler(newVal) {
        if (newVal) {
          // 进行数据处理操作
          if (newVal.limitLength) this.limitLength = newVal.limitLength;
          this.showLegend = newVal.showLegend;
          //计算总数
          if (newVal.showTotalNum) {
            this.showTotalNum = newVal.showTotalNum;
            this.totalNum = this.calculatePropertySum(newVal.datas, "VALUE");
          }
          const generateRandomColor = () => {
            var r = Math.floor(Math.random() * 201); // 随机生成红色通道值(0-200)
            var g = Math.floor(Math.random() * 255); // 随机生成绿色通道值(0-200)
            var b = Math.floor(Math.random() * 201); // 随机生成蓝色通道值(0-200)

            let hex =
              "#" + componentToHex(r) + componentToHex(g) + componentToHex(b);
            return hex;
          };
          const componentToHex = (c) => {
            let hex = c.toString(16);
            return hex.length == 1 ? "0" + hex : hex;
          };
          newVal.datas.map((item, index) => {
            if (!newVal.color[index]) {
              let a = generateRandomColor();
              newVal.color.push(a);
            }
          });
          setTimeout(() => {
            this.init();
          });
        }
      },
    },
  },
  methods: {
    init() {
      let option = {
        tooltip: {
          trigger: "item",
          formatter: "{b} : {c} ({d}%)",
        },
        title: [
          {
            show: this.showTotalNum,
            text: this.totalNum,
            left: this.$common.adjustOffset(
              this.totalNum,
              this.table.legendLocation == "left" ? "70%" : "48.5%",
              this.table.legendLocation == "left" ? "50%" : "50%"
            ).adjustedLeft,
            top: this.$common.adjustOffset(
              this.totalNum,
              this.table.legendLocation == "left" ? "70%" : "48.5%",
              this.table.legendLocation == "left" ? "50%" : "50%"
            ).adjustedTop,
            textStyle: {
              color: "#333333",
              fontSize: "22",
              fontWeight: "600",
              textAlign: "center", // 设置标题居中对齐
            },
          },
          {
            show: this.showTotalNum,
            text: "总计",
            left: this.$common.adjustOffset(
              "总计",
              this.table.legendLocation == "left" ? "70.5%" : "48.5%",
              this.table.legendLocation == "left" ? "37.5%" : "37.5%"
            ).adjustedLeft,
            top: this.$common.adjustOffset(
              "总计",
              this.table.legendLocation == "left" ? "70.5%" : "46.5%",
              this.table.legendLocation == "left" ? "37.5%" : "37.5%"
            ).adjustedTop,
            textStyle: {
              color: "#333333",
              fontSize: "12",
              fontWeight: "500",
              textAlign: "center", // 设置标题居中对齐
            },
          },
        ],
        //颜色注释显示的位置
        legend: {
          orient:
            this.table.legendLocation == "left" ? "vertical" : "horizontal",
          // right: 10,
          // top: "center",
          type: "scroll", //颜色过多可以滚动
          left: this.table.legendLocation == "left" ? 0 : "center",
          top: this.table.legendLocation == "left" ? "top" : "bottom",
          icon: this.table.legendIcon ? "circle" : "",
          formatter: (name) => {
            let seriesData = option.series[0].data; // 数据在series的第几个中
            let total = 0;
            for (let i = 0; i < seriesData.length; i++) {
              total += seriesData[i].value;
            }
            for (let j = 0; j < seriesData.length; j++) {
              if (name === seriesData[j].name) {
                let percent = ((seriesData[j].value / total) * 100).toFixed(2);
                if (name.length > this.limitLength) {
                  return (
                    name.substring(0, this.limitLength) +
                    "..." +
                    " " +
                    seriesData[j].value +
                    " " +
                    percent +
                    "%"
                  );
                } else {
                  return name + " " + seriesData[j].value + " " + percent + "%";
                }
              }
            }
          },
        },
        series: [
          {
            type: "pie",
            center:
              this.table.legendLocation == "left"
                ? ["72%", "50%"]
                : ["50%", "46%"],
            radius:
              this.table.legendLocation == "left"
                ? ["50%", "70%"]
                : ["42%", "62%"], //饼图的半径,第一项是内半径,第二项是外半径
            avoidLabelOverlap: false,
            itemStyle: {
              color: (params) => {
                let index = params.dataIndex;
                return this.table.color[index];
              },
            },
            label: {
              show: this.showLegend,
              position: "outer",
              formatter: "{c}",
            },
            data: this.table.datas.map((item, index) => {
              let obj = {
                label: { color: this.table.color[index] },
                name: item.NAME,
                value: item.VALUE || item.NUM,
              };
              return obj;
            }),
          },
        ],
      };
      let chartDom = this.$refs.doughnutChart;
      let myChart = this.$E.init(chartDom);
      myChart.setOption(option);
    },
    //计算总和
    calculatePropertySum(arr, property) {
      return arr.reduce((sum, obj) => {
        const value = parseFloat(obj[property]);
        if (!isNaN(value)) {
          return sum + value;
        } else {
          return sum;
        }
      }, 0);
    },
  },
};
</script>

<style scoped lang="scss">
.wrapper {
  width: 100%;
  height: 100%;
  position: relative;
  #doughnutChart {
    width: 100%;
    height: 100%;
    box-sizing: border-box;
    position: absolute;
    top: 0;
    left: 0;
  }
}
</style>
调用:
<DoughnutChart
  :table="table"
  :style="{ height: heightNew }"
/>
// table
/**
 * {
  "datas": [
    {
      "NAME": "南京医科大学康达学院",
      "VALUE": 20
    },
    {
      "NAME": "江苏护理职业学院",
      "VALUE": 25
    },
    {
      "NAME": "无锡太湖学院",
      "VALUE": 16
    },
    {
      "NAME": "江苏医药职业学院",
      "VALUE": 47
    },
    {
      "NAME": "安徽省淮北卫生学校",
      "VALUE": 5
    },
    {
      "NAME": "江苏卫生健康职业学院",
      "VALUE": 10
    },
    {
      "NAME": "太湖创意职业技术学院",
      "VALUE": 2
    }
  ],
  "color": [
    "#5470c6",
    "#91cc75",
    "#fac858",
    "#ee6666",
    "#73c0de",
    "#3ba272",
    "#fc8452",
    "#9a60b4",
    "#ea7ccc",
    "#8364FF",
    "#36F4D7",
    "#FBB03C"
  ],
  "showPercentage": true,
  "showLegend": true,
  "showTotalNum": true,
  "limitLength": 10
}
 */