Title
题目
Carotid Vessel Wall Segmentation ThroughDomain Aligner, Topological Learning, andSegment Anything Model for Sparse Annotationin MR Images
颈动脉血管壁分割通过领域对齐、拓扑学习和稀疏标注中的Segment Anything模型在磁共振图像中的应用
01
文献速递介绍
A 动脉粥样硬化是一种复杂且慢性的动脉壁炎症性疾病,其特征是富含脂质的斑块的积累、平滑肌细胞的增生和细胞外基质的沉积。它是心血管疾病的主要原因,包括心脏病发作和中风,并且与全球显著的发病率和死亡率相关。动脉粥样硬化可以发生在身体的任何动脉中,但主要发现于向大脑供血的颈动脉。为了实现准确的颈动脉疾病分析,血管壁分割是一个关键步骤,这使得提取相关特征和测量值以进行诊断和预后成为可能。然而,手动标注血管壁是一项繁重且重复的任务,需要大量的专业知识和经验才能准确识别和标注感兴趣区域。
此外,血管表现的异质性对血管壁的准确和可靠标注构成了重大挑战,往往导致人为错误和观察者间的差异。因此,为这一任务获取足够的训练数据仍然是开发准确且有效模型的主要挑战。一个可能的解决方案是在标注过程中采用一种非常规的实践方法,即稀疏标注,如图1所示。稀疏标注是指对不连续的切片进行标注,以避免重复工作并节省时间。然而,这种方法使得3D分割变得困难。相比于稀疏标注,连续和完整的血管标注对于成功的血管分割及其相关结构重建是必不可少的。
Abstract
摘要
医学图像分析面临重大挑战由于临床数据的有限性,这对于训练准确的模型至关重要。这一限制因数据标注过程的专业性和劳动密集性而更加严重。例如,尽管计算机断层扫描血管造影(CTA)在诊断动脉粥样硬化方面非常流行,并且拥有大量注释数据集,磁共振(MR)图像在软斑块和血管壁表征方面却有更好的可视化效果。然而,MR的高成本和有限的可及性,以及手工标注的耗时性,导致了较少的注释数据集。为了解决这些问题,我们提出了一种多模态迁移学习网络,名为MT-Net,旨在学习未配对的CTA和稀疏注释的MR数据。此外,我们利用Segment Anything模型(SAM)合成额外的MR注释,丰富训练过程。具体而言,我们的方法首先分割血管腔区域,然后精确表征颈动脉血管壁,从而确保两者的分割精度和临床相关性。我们的方法通过严格的实验验证,使用COSMOS和CARE-II挑战中的公开数据集,证明了其相对于现有最先进技术的优越性能。
Method
方法
Fig. 4 presents an overview of our proposed two-stageframework. To better utilize the continuous tubular structureof the carotid artery, we propose to locate and reconstructvascular anatomy through vessel lumen segmentation with theproposed Multi-modal Transfer learning Network, i.e., MTNet, and then achieve the final vessel wall segmentation basedon vessel lumen prediction. We also constrain the segmentedobjects to be ring-shaped during vessel wall segmentation.
图4展示了我们提出的两阶段框架的概览。为了更好地利用颈动脉的连续管状结构,我们提出通过使用多模态迁移学习网络(即MT-Net)进行血管腔分割来定位和重建血管解剖结构,然后基于血管腔预测实现最终的血管壁分割。在血管壁分割过程中,我们还将分割的对象约束为环状。
Figure
图
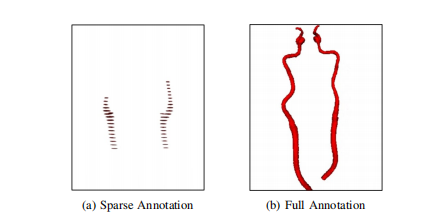
Fig. 1. A comparison between sparsely-annotated and fully-annotated carotid artery segments, with vessel lumens highlighted in red.
图1:稀疏标注和完全标注的颈动脉段的比较,其中血管腔用红色高亮显示。
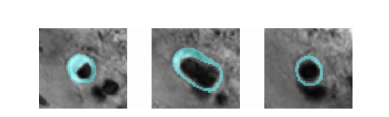
Fig. 2. Examples of vessel walls represented in ring-shaped forms, withthe light blue regions indicating the corresponding areas of
vessel walls.
图2:环状形式表示的血管壁示例,浅蓝色区域表示相应的血管壁区域。
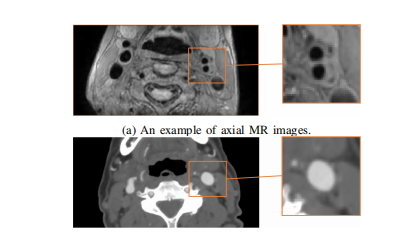
Fig. 3. Comparison of axial MR and CTA images for carotid
arterydiagnosis.
图3:用于颈动脉诊断的轴向MR和CTA图像比较。
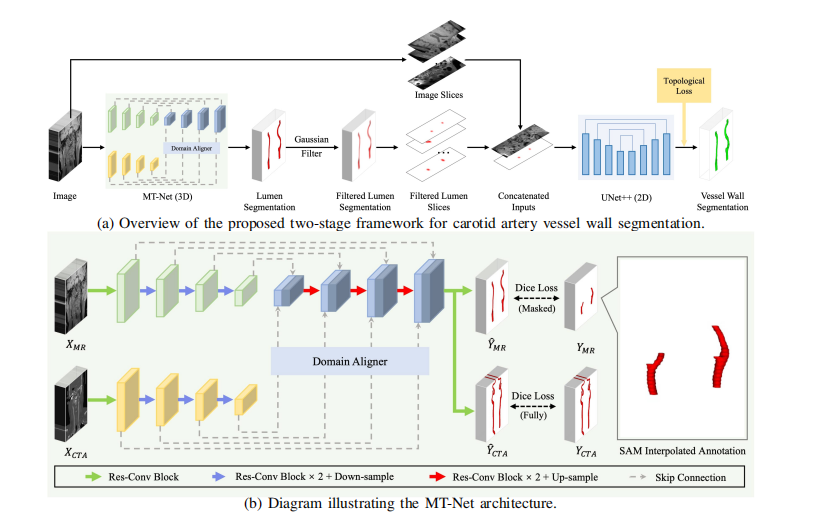
Fig. 4. Our two-stage framework for carotid vessel wall segmentation, as shown in Fig. (a). In the first stage, we deploy our proposed transferlearning network, MT-Net, to segment vessel lumens by utilizing the SAM interpolated annotation. In the second stage, we use the resulting lumensegmentation to obtain our vessel wall segmentation. Fig. (b) showcases the architecture of our MT-Net, in which a Res-Conv Block is composedof a convolution layer followed by batch normalization and a ReLU activation function, with a residual shortcut. The Domain Aligner consists of twoRes-Conv Blocks and a modified scSE module.
图4:我们的两阶段颈动脉血管壁分割框架,如图(a)所示。在第一阶段,我们部署了我们提出的迁移学习网络MT-Net,通过使用SAM插值注释来分割血管腔。在第二阶段,我们使用得到的血管腔分割结果来获得血管壁分割。图(b)展示了我们的MT-Net的架构,其中Res-Conv块由一个卷积层、批归一化层和ReLU激活函数组成,并带有一个残差捷径。Domain Aligner由两个Res-Conv块和一个修改后的scSE模块组成
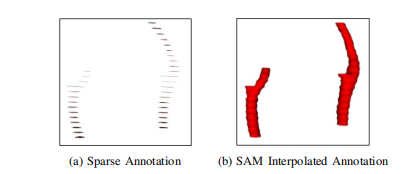
Fig. 5. Comparison of annotation before and after the usage of SAM.
图5:使用SAM前后的注释比较。
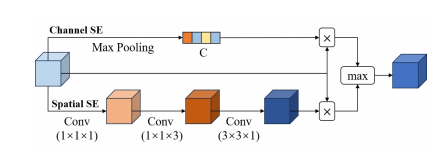
Fig. 6. Schematic representation of the architecture of the modified spatial and channel Squeeze and Excitation (scSE) module.
图6:修改后的空间和通道压缩与激励(scSE)模块的架构示意图。
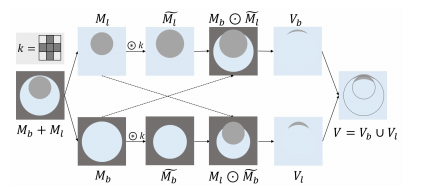
Fig. 7. An illustration of the process of topological loss with ring-shaped relationship between vessel wall and vessel lumen.
图7:展示血管壁和血管腔之间环状关系的拓扑损失过程示意图。
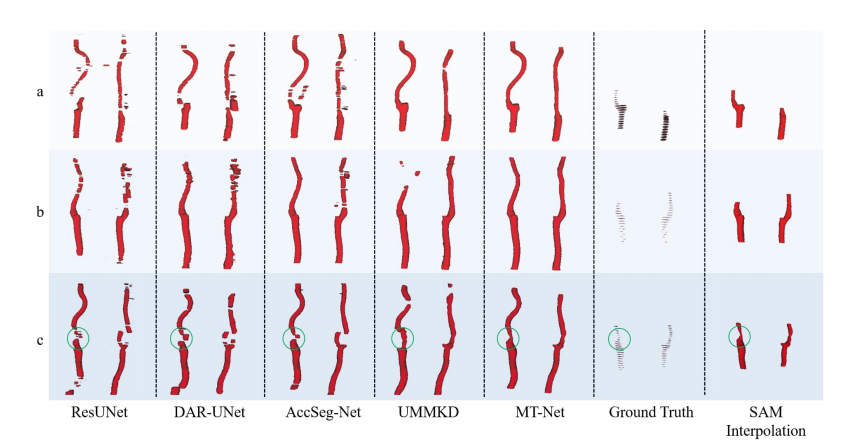
Fig. 8. Visual representation of vessel lumen segmentation, with the left and right carotid artery lumens depicted in red color. The last row illustratesartery segments with severe atherosclerosis, as indicated by the circled areas. The complex and irregular morphology of the atherosclerotic arteriespose substantial difficulties for the alternative methods, which can obscure the vessel boundaries and lead to a
fragmented result.
图8:血管腔分割的可视化表示,左侧和右侧颈动脉腔用红色表示。最后一行展示了严重动脉粥样硬化的动脉段,如圆圈所示区域所示。动脉粥样硬化的复杂和不规则形态对替代方法构成了相当大的挑战,这可能会模糊血管边界并导致分割结果的碎片化。
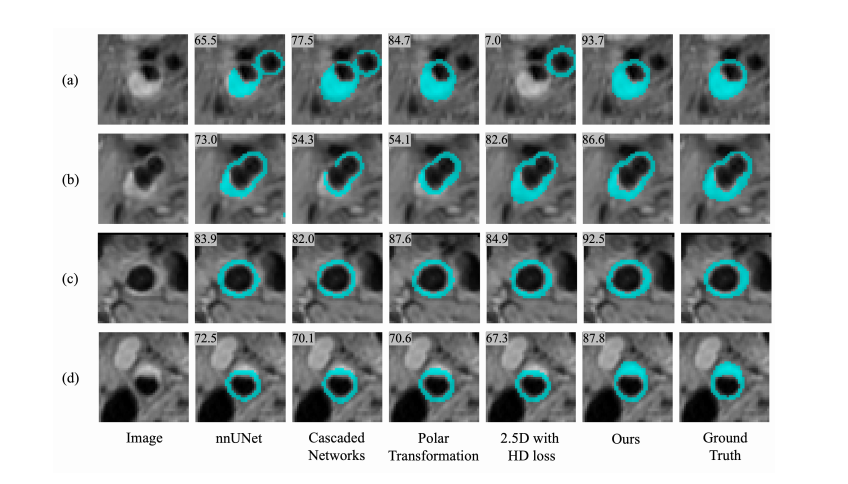
Fig. 9. Comparison of examples of vessel wall segmentation (shown in light blue). Number on each upper-left corner shows corresponding DSC (%). Only the results from nnUNet (the best-performing pure 2D method) are visualized.
图9:血管壁分割示例的比较(以浅蓝色显示)。每个左上角的数字显示相应的DSC(%)。仅显示了nnUNet(表现最佳的纯2D方法)的结果。
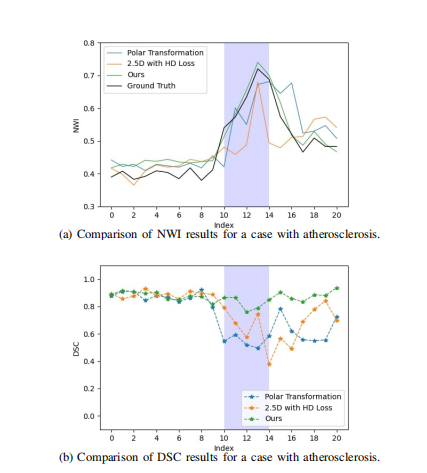
Fig. 10. Comparison of NWI and DSC predictions from various methods alongside actual values. The depicted images use light blue shadingto delineate the bifurcation zone, with a central spike in (a) indicating thelocation of a diseased vessel wall. This area exhibits an increased NWI,which is indicative of atherosclerotic plaque development.
图10:不同方法的NWI和DSC预测值与实际值的比较。所展示的图像使用浅蓝色阴影描绘分叉区,其中(a)中的中央尖峰表示病变血管壁的位置。该区域显示出增加的NWI,表明动脉粥样硬化斑块的发展。
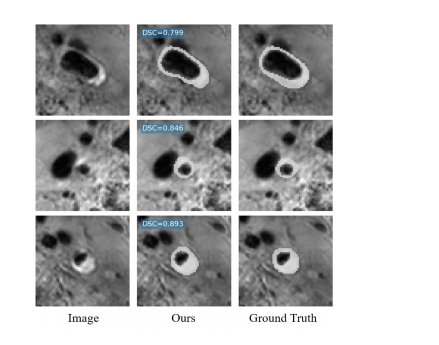
Fig. 11. Demonstration of vessel wall segmentation performance inidentifying areas with atherosclerosis.
图11:血管壁分割性能在识别动脉粥样硬化区域中的示范。
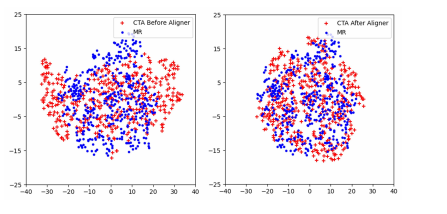
Fig. 12. t-SNE visualization of the evolution of feature embeddingsbefore and after Domain Aligner.
图12:领域对齐前后特征嵌入演变的t-SNE可视化。
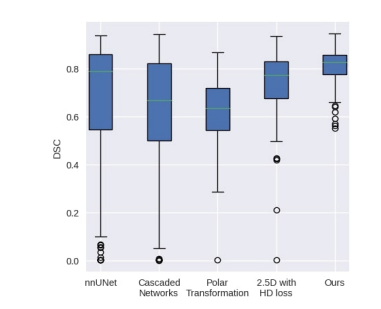
Fig. 13. Evaluation of segmentation performance of vessel wallsaffected by atherosclerosis. The boxplot presents the median, as wellas the 25th and 75th percentiles. The mean is indicated by “-”, and theoutliers are represented by “o”.
图13:动脉粥样硬化影响的血管壁分割性能评估。箱线图展示了中位数以及第25和第75百分位数。均值用“-”表示,离群值用“o”表示
Table
表
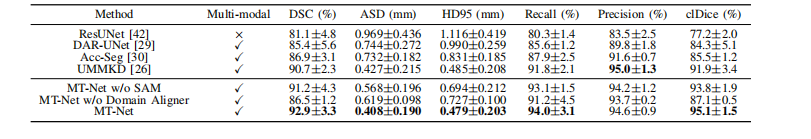
TABLE I qualitative results on vessel lumen segmentation on cosmos dataset (avg±std).
表 I COSMOS数据集上血管腔分割的定性结果(平均值±标准差)。
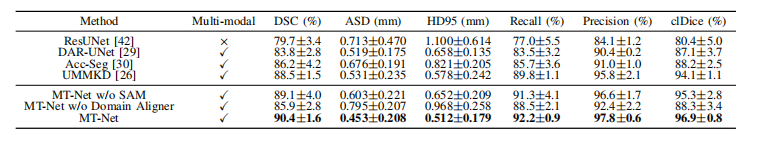
TABLE II qualitative results on vessel lumen segmentation on care-ii dataset (avg±std).
表 II CARE-II数据集上血管腔分割的定性结果(平均值±标准差)。
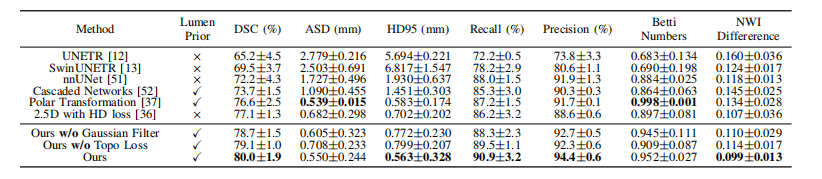
TABLE III qualitative results on vessel wall segmentation on cosmos dataset (avg±std).
表 III COSMOS数据集上血管壁分割的定性结果(平均值±标准差)。
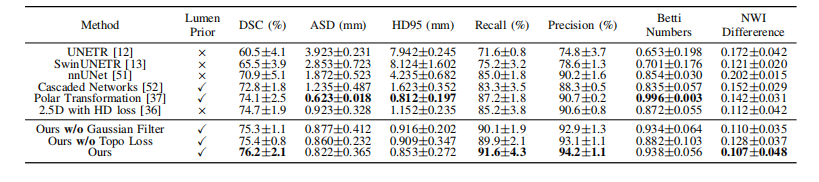
TABLE IV qualitative results on vessel wall segmentation on care-ii dataset (avg±std).
表 IV CARE-II数据集上血管壁分割的定性结果(平均值±标准差)。
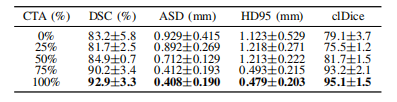
TABLE V performance evaluation of mt-net using different percentages of additional cta data on cosmos.
表 V使用不同百分比的额外CTA数据在COSMOS数据集上对MT-Net的性能评估。
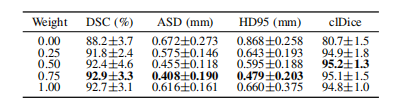
TABLE VI performance evaluation of mt-net using different weights of sam interpolation.
表VI 使用不同权重的SAMPLING插值算法对mt-net进行性能评估。