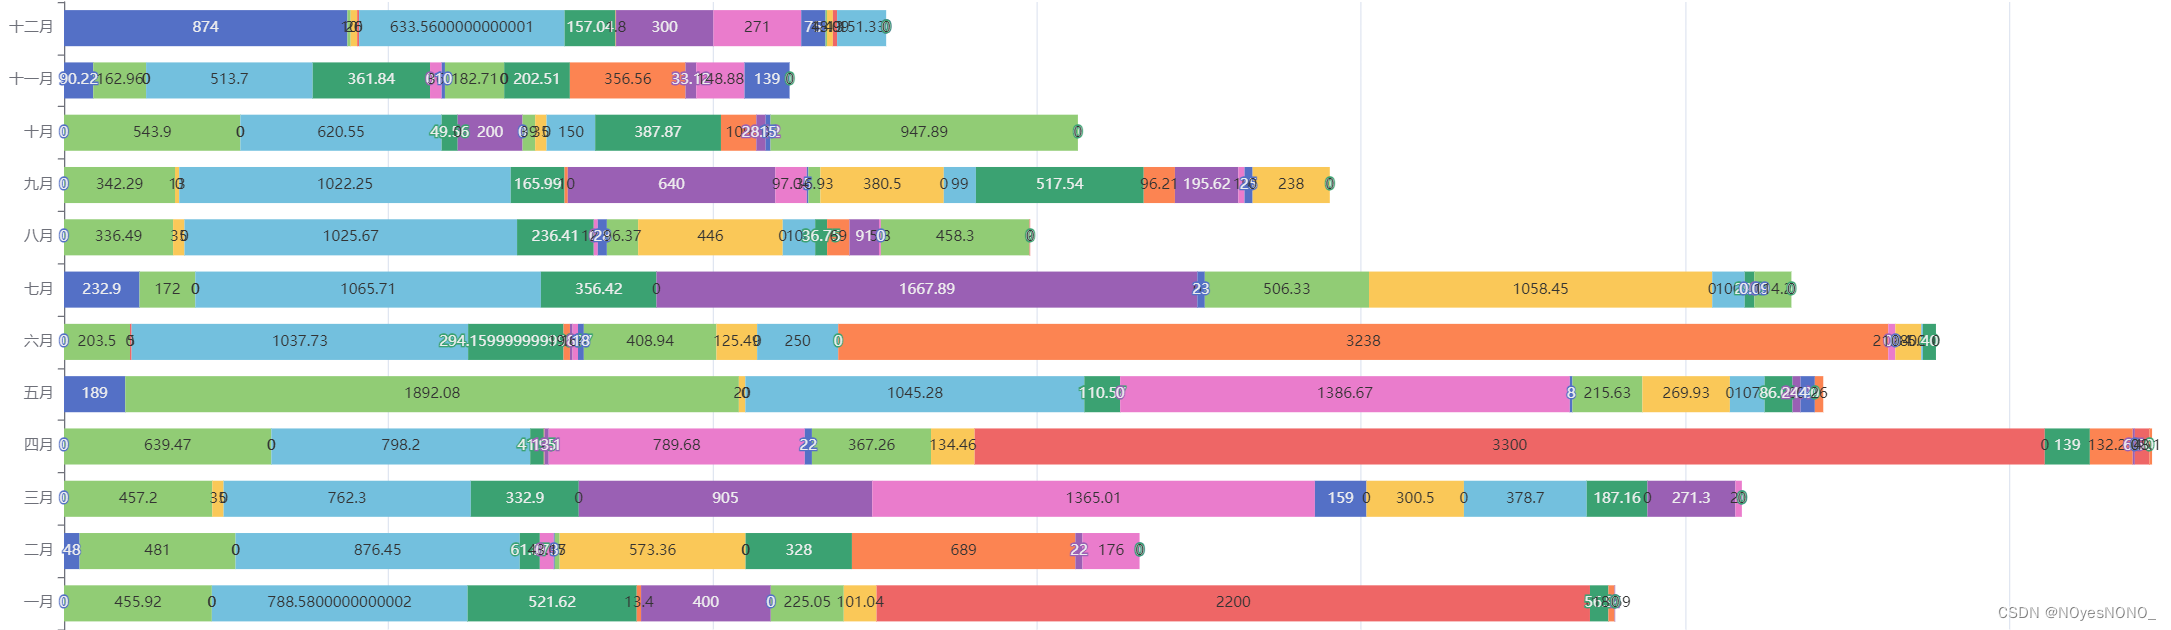
图片展示

此处内容为展示24年各个月份产品的创建数量。在后端统计24年各个月份产品数量后,以数组的格式发送给前端,前端负责展示。
后端
entity层:
@Data
@Schema(description = "月份统计")

public class MonthCount {
    private String month;
    private Integer count;
}
service层:
@Override
    public List<MonthCount> getCreateMonth() {
        DateTimeFormatter dateFormat = DateTimeFormatter.ofPattern("MM");
        // 查询 2024 年每个月的产品创建日期
        List<PlmProductEntity> productList = baseMapper.selectList(new QueryWrapper<PlmProductEntity>()
                .apply("YEAR(create_date) = 2024"));

        // 统计每个月份的产品数量
        Map<String, Long> countMap = productList.stream()
                .collect(Collectors.groupingBy(
                        product -> YearMonth.from(product.getCreateDate().toInstant().atZone(ZoneId.systemDefault()).toLocalDate()).format(dateFormat),
                        Collectors.counting()
                ));

        // 将统计结果转换为 MonthCount 对象列表
        List<MonthCount> monthCounts = new ArrayList<>();
        countMap.forEach((month, count) -> {
            MonthCount monthCount = new MonthCount();
            monthCount.setMonth(month);
            monthCount.setCount(count.intValue()); // 将 Long 类型的 count 转换为 int
            monthCounts.add(monthCount);
        });

        return monthCounts;
    }
controller层:
@GetMapping("/getCreateMonth")
    @Operation(summary = "得到创建月份")
    public Result<List<MonthCount>> getCreateMonth(){
        List<MonthCount> month = plmProductService.getCreateMonth();
        for (MonthCount monthCount :month){
            System.out.println(monthCount.getMonth());
        }
        return R2.ok(month);
    }
前端得到的数据响应格式为:
{
“type”: “success”,
“result”: [
{
“month”: “04”,
“count”: 1
},
{
“month”: “05”,
“count”: 1
}
],
“code”: 200,
“message”: “success”,
“timestamp”: “2024-07-14 14:20:39”
}
可以看到成功包装为数组。
前端
export const getCreateMonth = () => defHttp.get({ url: Api.GetCreateMonth });
此处defHttp为自己写的发送信息的方法,各位将其替换为axios发送的方式即可。
onMounted(async () => {
    const response = await getCreateMonth();
    console.log(response);
    try {
      // 构建月份数组和对应的产品创建数量数组
      const monthNames = ['01', '02', '03', '04', '05', '06', '07', '08', '09', '10', '11', '12'];
      const productCounts = monthNames.map((month) => {
        const monthData = response.find((item) => item.month === month);
        return monthData ? monthData.count : 0; // 如果没有数据,默认为0
      });
      // 设置图表的选项
      setOptions({
        tooltip: {
          trigger: 'axis',
          axisPointer: {
          lineStyle: {
            width: 1,
            color: '#019680',
          },
        },
      },
      xAxis: {
        type: 'category',
        boundaryGap: false,
        data: monthNames.map((month) => `${month}月`), // 添加月份单位
      },
      yAxis: {
        type: 'value',
      },
      grid: { left: '1%', right: '1%', top: '2%', bottom: 0, containLabel: true },
      series: [
        {
          data: productCounts,
          type: 'line',
          areaStyle: {},
        },
      ],
    });
    } catch (error) {
      console.error('Error fetching data:', error);
    }
  });
如果看到盒子被撑开但是一片空白,那么说明引入成功但数据格式输入不符上述代码的处理,这个时候就输出来看看得到的是什么样子的格式console.log(response);,再修改得到最终图形。


![【2024_CUMCM】中心对数变换(CLR)[附代码]](https://i-blog.csdnimg.cn/direct/04383a19e85f490699c4aa16761f4cb3.png)