图表配置:
import { EChartsOption, graphic } from 'echarts'
import rightCircle from '@/assets/imgs/index/right_circle.png'
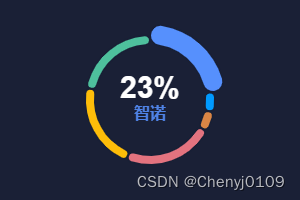
export const pieOption: EChartsOption = {
title: {
text: '100%',
subtext: '游客加量',
left: '19%',
top: '42%',
textStyle: {
fontSize: 24,
color: '#fff',
align: 'center',
fontWeight: 700
},
subtextStyle: {
fontSize: 16,
color: '#fff',
align: 'center',
fontWeight: 500
}
},
tooltip: {
trigger: 'item'
},
legend: {
orient: 'vertical',
top: '30%',
left: '60%', // left给成right,直接会出现在图表右侧,但是图例的色块也会出现在文字的右侧
textStyle: {
//图例中文字的样式
color: "#ffffff",
fontSize: 14,
fontWeight: 500,
lineHeight: 20
},
itemWidth: 12, // 设置图例颜色块的宽度
itemHeight: 12, // 设置图例颜色块的高度
itemStyle: {
borderRadius: 2
},
formatter: function (name) { // 设置图例展示方式
let target
let sum = 0
let durationArray = pieOption.series[0].data
for (let i = 0; i < durationArray.length; i++) {
sum += durationArray[i].value
if (durationArray[i].name == name) {
target = durationArray[i].value
}
}
let params = `${name} ${((target / sum) * 100).toFixed(2) + '%'}`
let tmp = params.split('\n')
let res = '' + params
for (let i in tmp) {
res = res.replace(tmp[i], ' ')
}
console.log('sdsd', res+params)
return res + params + '\n' + target + '人次'
}
},
graphic: [ // 设置图表外层背景
{
type: 'image',
left: '3%',
top: '16%',
z: -10,
bounding: 'raw',
rotation: 0, //旋转
// origin: [510, 100], //中心点
scale: [1.1, 1.1], //缩放
style: {
// 背景图
image: rightCircle,
opacity: 1
}
}
],
series: [
{
left: '-45%',
type: 'pie',
radius: ['50%', '40%'],
avoidLabelOverlap: false,
padAngle: 5,
itemStyle: {
borderRadius: 10
},
label: {
show: false,
position: 'center'
},
labelLine: {
show: false
},
data: [
{ value: 1048, name: '国内游客' },
{ value: 735, name: '国外游客' },
{ value: 580, name: '港澳台游客' }
]
}
]
}