在微服务架构中,服务之间的调用链路可能非常复杂,这使得问题定位和性能优化变得困难。为了解决这个问题,我们可以使用分布式跟踪系统来监控和诊断整个微服务架构中的请求链路。Zipkin和Spring Cloud Sleuth是两个非常流行的工具,它们可以帮助我们实现这一目标。
什么是Zipkin和Spring Cloud Sleuth?
- Zipkin 是一个分布式跟踪系统,它可以帮助我们收集微服务架构中的时序数据,以便于我们分析和监控系统的性能。
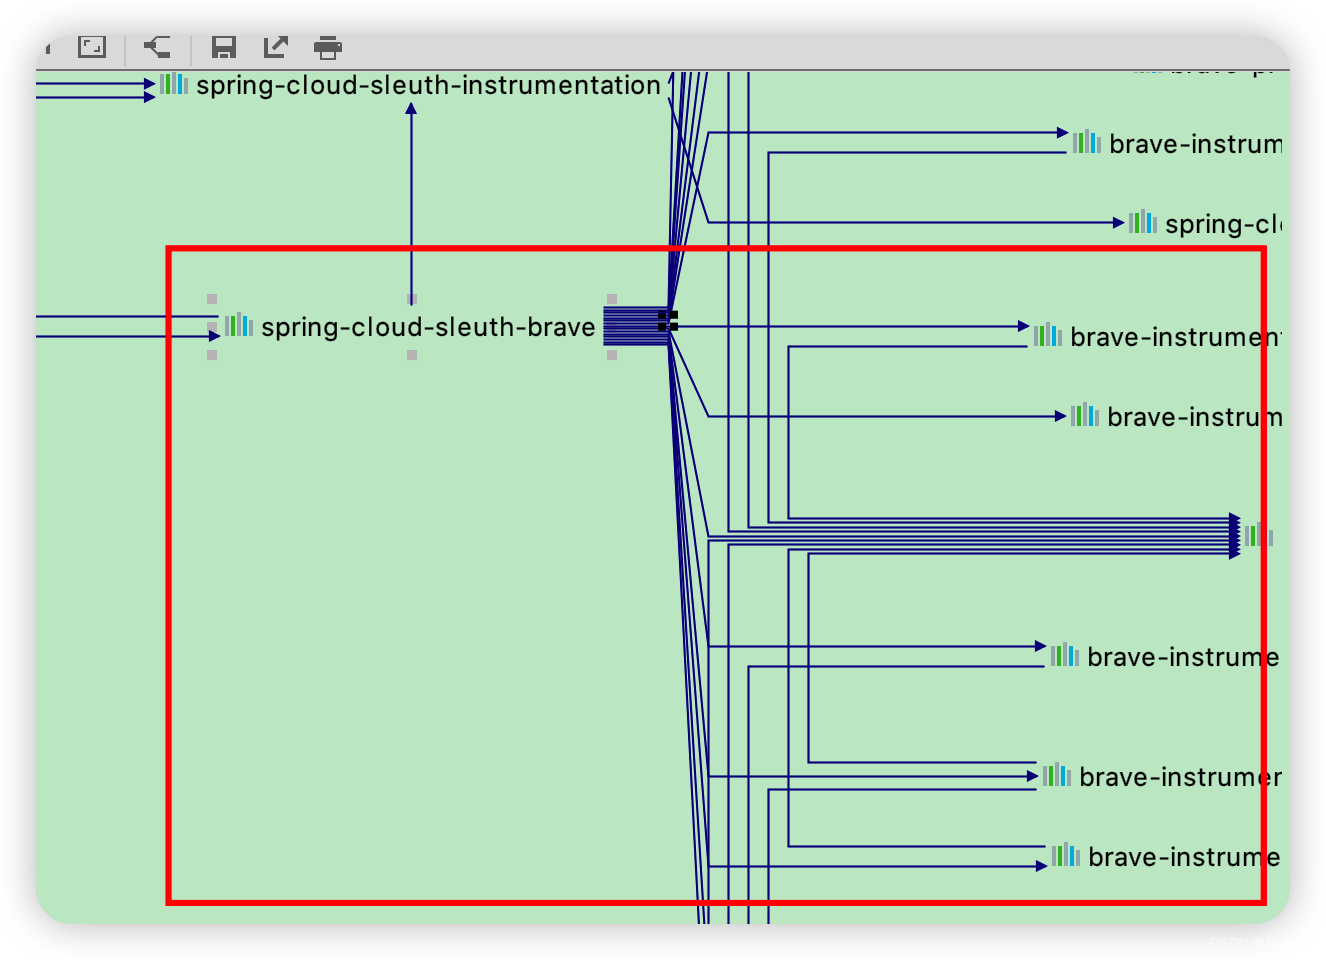
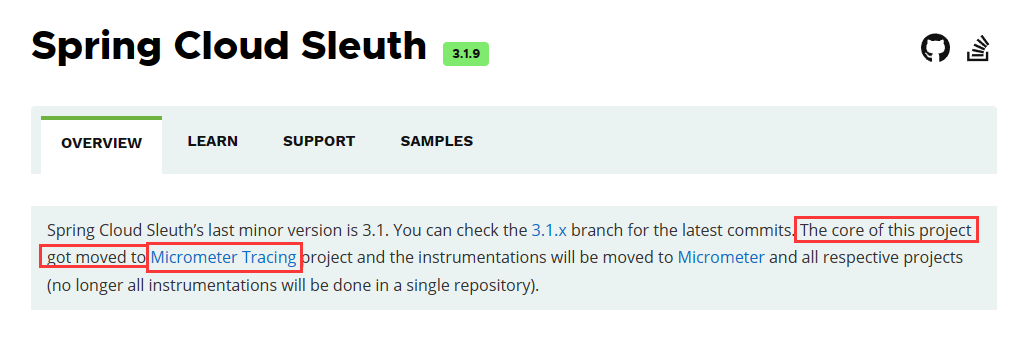
- Spring Cloud Sleuth 是一个Spring Cloud项目,它为Spring Boot应用提供了自动化的分布式跟踪功能,并且可以与Zipkin集成。
为什么需要分布式跟踪?
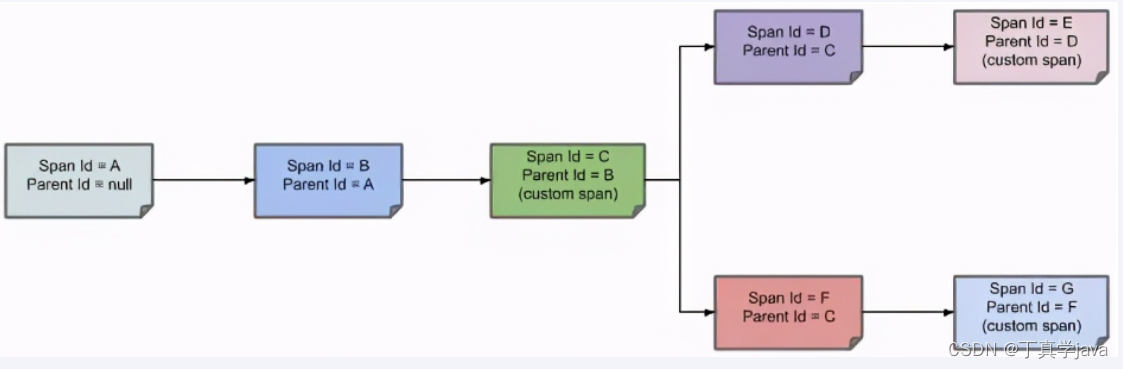
在微服务架构中,一个用户请求可能会经过多个服务的处理。如果没有分布式跟踪系统,当出现问题时,我们很难确定问题出在哪个服务,或者哪个服务调用链路中。分布式跟踪系统可以帮助我们:
- 快速定位性能瓶颈。
- 监控服务间的调用关系。
- 分析和优化系统性能。
集成Zipkin和Spring Cloud Sleuth
下面我们将通过一个简单的示例来展示如何在Spring Boot应用中集成Zipkin和Spring Cloud Sleuth。
1. 创建Spring Boot项目
首先,我们需要创建一个Spring Boot项目。你可以使用Spring Initializr来快速创建项目,并添加以下依赖:
<dependencies>
    <dependency>
        <groupId>org.springframework.boot</groupId>
        <artifactId>spring-boot-starter-web</artifactId>
    </dependency>
    <dependency>
        <groupId>org.springframework.cloud</groupId>
        <artifactId>spring-cloud-starter-sleuth</artifactId>
    </dependency>
    <dependency>
        <groupId>org.springframework.cloud</groupId>
        <artifactId>spring-cloud-starter-zipkin</artifactId>
    </dependency>
</dependencies>
2. 配置应用
在application.properties文件中添加以下配置:
spring.application.name=my-service
server.port=8080

spring.zipkin.base-url=http://localhost:9411
spring.sleuth.sampler.probability=1.0
spring.zipkin.base-url指定了Zipkin服务器的地址。spring.sleuth.sampler.probability设置为1.0表示记录所有跟踪数据。
3. 编写示例代码
创建一个简单的REST控制器来模拟服务调用:
import org.springframework.web.bind.annotation.GetMapping;
import org.springframework.web.bind.annotation.RestController;
import org.springframework.web.client.RestTemplate;

@RestController
public class MyController {

    private final RestTemplate restTemplate;

    public MyController(RestTemplate restTemplate) {
        this.restTemplate = restTemplate;
    }

    @GetMapping("/hello")
    public String hello() {
        String response = restTemplate.getForObject("http://localhost:8081/greeting", String.class);
        return "Hello, " + response;
    }
}
在这个示例中,/hello端点会调用另一个服务的/greeting端点。
4. 启动Zipkin服务器
你可以通过Docker来快速启动一个Zipkin服务器:
docker run -d -p 9411:9411 openzipkin/zipkin
5. 运行应用
启动你的Spring Boot应用,并访问http://localhost:8080/hello端点。此时,Spring Cloud Sleuth会自动为你的请求生成跟踪信息,并将这些信息发送到Zipkin服务器。
6. 查看跟踪信息
打开浏览器,访问http://localhost:9411,你将看到Zipkin的Web界面。在这里,你可以查看所有的跟踪信息,包括每个请求的耗时、调用链路等。
总结
通过集成Zipkin和Spring Cloud Sleuth,我们可以轻松地实现微服务架构中的分布式跟踪。这不仅有助于我们快速定位和解决问题,还能帮助我们优化系统性能。希望这篇博客能帮助你理解和使用这两个强大的工具。