✨ 关于 relation-graph
relation-graph是支持Vue2、Vue3、React的关系数据展示组件,支持通过【插槽】让使用者使用"普通HTML元素、Vue组件、React组件"来完全自定义图形元素,并提供实用的API接口让使用者轻松构建可交互的图形应用。
官网文档:https://www.relation-graph.com/#/index

✨ 基本使用:(Vue3.0)
第一步:在项目中安装对应的插件
npm install --save relation-graph-vue3
第二步:创建对应SFC组件
<template>
  <div>
    <div style="border: #efefef solid 1px; height: calc(100vh - 100px);width: 100%;">
      <relation-graph ref="graphRef$" :options="options" >
      			<template #node="{node}">
				<div class="node-item" @click="showNodeTips(node, $event)">
					//自定义节点中显示内容
					<div class="node-item-info">
						<div class="node-item-info-item">
							<div class="item-label">所属部门:</div>
							<div class="item-value">部门编号+部门名称</div>
						</div>
						<div class="node-item-info-item">
							<div class="item-label">工作电话:</div>
							<div class="item-value">00-1234 1234</div>
						</div>
						<div class="node-item-info-item">
							<div class="item-label">工作邮箱:</div>
							<div class="item-value">Pall.Lin.123@manpowergrc.com</div>
						</div>
						<div class="node-item-info-item">
							<div class="item-label">下属人数:</div>
							<div class="item-value">198人</div>
						</div>
					</div>
				</div>
			</template>
		</relation-graph>
    </div>
  </div>
</template>
<script setup name="RelationGraph">
import RelationGraph from 'relation-graph-vue3'
const options = {
  "backgroundImage": "https://ssl.relation-graph.com/images/relatioon-graph-canvas-bg.png",
  "backgroundImageNoRepeat": true,
  "disableDragNode": true,
  "defaultFocusRootNode": false,
  "disableNodeClickEffect": true,
  "disableLineClickEffect": true,
  "defaultExpandHolderPosition": "bottom",
  "defaultNodeBorderWidth": 1,
  "defaultNodeColor": "#ffffff",
  "defaultNodeBorderColor": "#D8D8D8",
  "defaultNodeFontColor": "#303133",
  "defaultLineColor": "#999",
  "checkedLineColor": null,
  "defaultLineShape": 4,
  "defaultNodeShape": 1,
  "defaultNodeWidth": 340,
  "defaultNodeHeight": 148,
  "defaultJunctionPoint": "tb",
  "layouts": [
    {
      "label": "中心",
      "layoutName": "tree",
      "centerOffset_x": 0,
      "centerOffset_y": 0,
      "distance_coefficient": 1,
      "layoutDirection": "v",
      "from": "top",
      "levelDistance": "",
      "min_per_width": "360",
      "max_per_width": 500,
      "min_per_height": "300",
      "max_per_height": 500
    }
  ]
}
const jsonData = {
    rootId: 'a',
    nodes: [
      { id: 'a', text: 'a', },
      { id: 'b', text: 'b', },
      { id: 'c', text: 'c', },
      { id: 'd', text: 'd', },
      { id: 'e', text: 'e', },
      { id: 'f', text: 'f', },
    ],
    lines: [
      { from: 'a', to: 'b', },
      { from: 'a', to: 'c', },
      { from: 'a', to: 'd', },
      { from: 'a', to: 'e', },
      { from: 'a', to: 'f', },
    ],
  }
//点击当前节点
const showNodeTips = (nodeObject, $event) => {
	isShowNodeTipsPanel.value = true
}
// 点击画布事件
const onCanvasClick = ($event) => {
	isShowNodeTipsPanel.value = false
}
onMounted(()=>{
//初始化画布
	const graphInstance = graphRef.value?.getInstance()
	if (graphInstance) {
			graphInstance.setOptions(options)
			graphInstance.setJsonData(jsonData)
			graphInstance.moveToCenter()
			graphInstance.zoomToFit()
		}
	})
第三步:自定义配置界面

基本配置json
const options = {
  "backgroundImage": "https://ssl.relation-graph.com/images/relatioon-graph-canvas-bg.png",
  "backgroundImageNoRepeat": true,
  "disableDragNode": true,
  "defaultFocusRootNode": false,
  "disableNodeClickEffect": true,
  "disableLineClickEffect": true,
  "defaultExpandHolderPosition": "bottom",
  "defaultNodeBorderWidth": 1,
  "defaultNodeColor": "#ffffff",
  "defaultNodeBorderColor": "#D8D8D8",
  "defaultNodeFontColor": "#303133",
  "defaultLineColor": "#999",
  "checkedLineColor": null,
  "defaultLineShape": 4,
  "defaultNodeShape": 1,
  "defaultNodeWidth": 340,
  "defaultNodeHeight": 148,
  "defaultJunctionPoint": "tb",
  "layouts": [
    {
      "label": "中心",
      "layoutName": "tree",
      "centerOffset_x": 0,
      "centerOffset_y": 0,
      "distance_coefficient": 1,
      "layoutDirection": "v",
      "from": "top",
      "levelDistance": "",
      "min_per_width": "360",
      "max_per_width": 500,
      "min_per_height": "300",
      "max_per_height": 500
    }
  ]
}
数据格式:
 const jsonData = {
    rootId: 'a',
    nodes: [
      { id: 'a', text: 'a', },
      { id: 'b', text: 'b', },
      { id: 'c', text: 'c', },
      { id: 'd', text: 'd', },
      { id: 'e', text: 'e', },
      { id: 'f', text: 'f', },
    ],
    lines: [
      { from: 'a', to: 'b', },
      { from: 'a', to: 'c', },
      { from: 'a', to: 'd', },
      { from: 'a', to: 'e', },
      { from: 'a', to: 'f', },
    ],
  }
数据赋值:
graphRef$.value.setJsonData(jsonData)
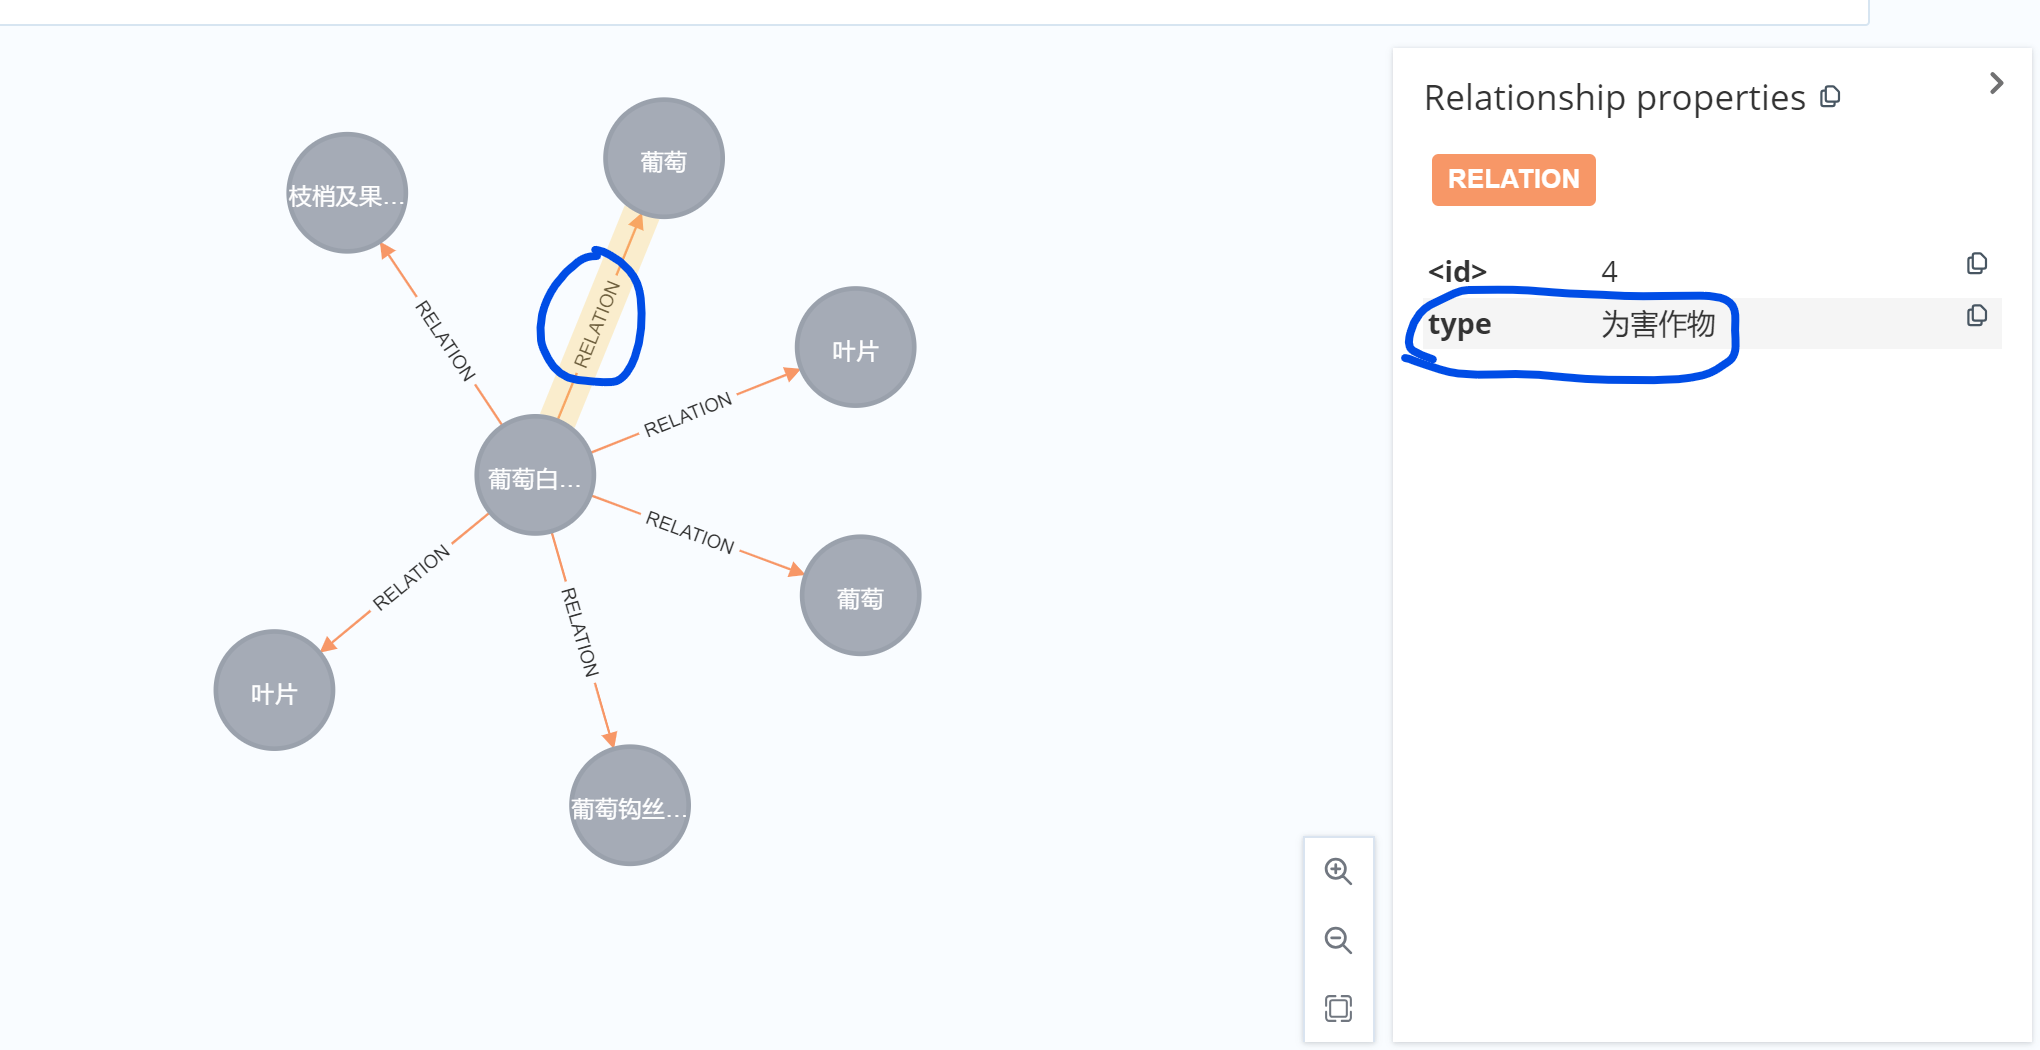
完成这些之后我们就可以得到一个基本的关系图谱


✨ 如何自定义图谱结构以及样式
1.配置界面进行可视化配置

2.完成之后点击此处,copy 出我们的json对象,替换到我们自定义组件中即可

3.具有丰富的事件与交互供大家使用

常用的事件:
- node-click 节点点击事件
- line-click 节点连线点击事件
- canvas-click 画布点击事件
4.自定义图表动画效果


![[R] <span style='color:red;'>Graphing</span> the <span style='color:red;'>relation</span> between two variables](https://img-blog.csdnimg.cn/direct/e0bb725c0e994d31931e1a11d24ab7ba.png)