目录
1. 作者介绍
侯硕,男,西安工程大学电子信息学院,2023级研究生
研究方向:机器视觉与人工智能
电子邮件:1302088912@qq.com
徐达,男,西安工程大学电子信息学院,2023级研究生,张宏伟人工智能课题组
研究方向:机器视觉与人工智能
电子邮件:1374455905@qq.com
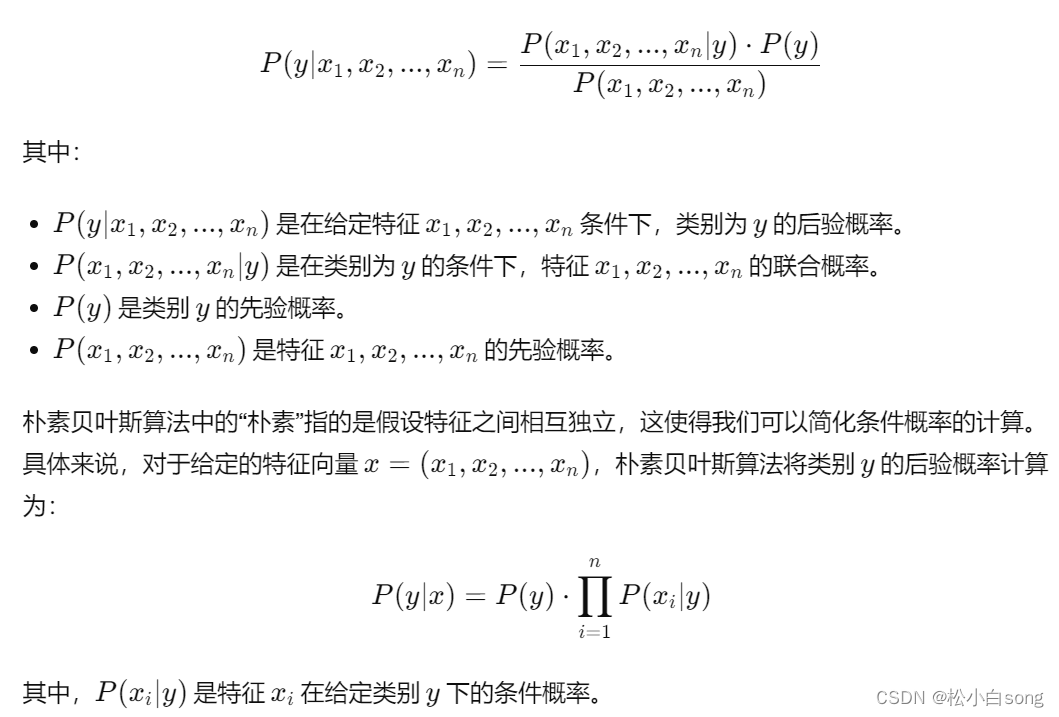
2. 关于理论方面的知识介绍
2.1 BP神经网络原理
BP神经网络是一种基于误差反向传播算法的人工神经网络,是应用最广泛的神经网络。可以用来解决分类、回归、模式识别、数据挖掘等多种问题。
它的基本思想是梯度下降法,利用梯度搜索技术,以期使网络的实际输出值和期望输出值的误差均方差为最小。BP神经网络由输入层、隐含层和输出层组成,其中隐含层可以包含多个神经元。

2.2 BP神经网络结构
BP神经网络的训练过程包括前向传播和反向传播两个步骤。
前向传播是将输入数据传递到网络的输入层,每个输入变量对应一个输入神经元,
输入数据经过输入层的加权和非线性变换,传递到网络下一层,直到数据传递到网络的输出层,计算出网络的输出结果。将输出结果与实际标签进行比较,计算误差。
反向传播是将输出结果与实际标签之间的误差传递回网络,计算误差值。根据误差值和链式法则,从输出层向输入层逐层计算每个神经元的梯度,根据得到的梯度信息,调整每个神经元的权重和偏置,以降低误差值,并提高网络的精度。
通过一次正向传播和一次反向传播,我们就可以将网络的参数更新一次,不断地更新网络的参数,最终使网络能够逼近真实的关系。
3. 关于实验过程的介绍,完整实验代码,测试结果
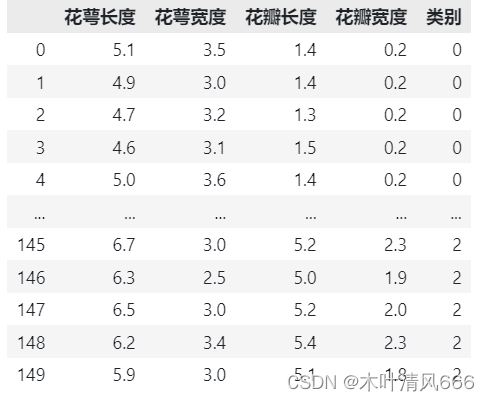
3.1 鸢尾花数据集介绍
鸢尾花数据集: 包含 3 类分别为山鸢尾(Iris-setosa)、变色鸢尾(Iris-versicolor)和维吉尼亚鸢尾(Iris-virginica),共 150 条数据,每类各 50 个数据,每条记录都有 4 项特征:花萼长度、花萼宽度、花瓣长度、花瓣宽度,通常可以通过这4个特征预测鸢尾花卉属于哪一品种。
from sklearn.datasets import load_iris
iris_dataset = load_iris()
输入上述两行代码就可以下载鸢尾花数据集

上述表中150是数据集中数据的总条数;4是特征值的类别数,即花萼长度、花萼宽度、花瓣长度、花瓣宽度;setosa、versicolor、virginica:三种鸢尾花名。
从第二行开始各列数据的意义:第一列为花萼长度值;第二列为花萼宽度值;第三列为花瓣长度值;第四列为花瓣宽度值;第五列对应是种类。

需要安装上述软件库
3.2 代码演示
import pandas as pd
import numpy as np
import matplotlib.pyplot as plt
from sklearn import datasets
from sklearn.model_selection import train_test_split
from sklearn.preprocessing import OneHotEncoder
plt.rcParams['font.sans-serif'] = ['SimHei']  # 设置中文字体
plt.rcParams['axes.unicode_minus'] = False  # 解决负号无法显示的问题
from pandas.plotting import radviz

# 初始化参数
def initialize_parameters(n_x, n_h, n_y):
    np.random.seed(2)
    w1 = np.random.randn(n_h, n_x) * np.sqrt(2 / n_x)
    w2 = np.random.randn(n_y, n_h) * np.sqrt(2 / n_h)
    b1 = np.zeros((n_h, 1))
    b2 = np.zeros((n_y, 1))
    parameters = {'w1': w1, 'b1': b1, 'w2': w2, 'b2': b2}
    return parameters

# 将X和参数进行前向传播计算,得到预测值和缓存的中间结果
def forward_propagation(X, parameters):
    w1, b1, w2, b2 = parameters['w1'], parameters['b1'], parameters['w2'], parameters['b2']
    z1 = np.dot(w1, X) + b1
    a1 = np.tanh(z1)
    z2 = np.dot(w2, a1) + b2
    a2 = 1 / (1 + np.exp(-z2))
    cache = {'z1': z1, 'a1': a1, 'z2': z2, 'a2': a2}
    return a2, cache

# 计算代价函数
def compute_cost(a2, Y, parameters, lambd=0.3):
    m = Y.shape[1]
    log_probs = np.multiply(np.log(a2), Y) + np.multiply((1 - Y), np.log(1 - a2))
    cross_entropy_cost = - np.sum(log_probs) / m
    w1, w2 = parameters['w1'], parameters['w2']
    l2_regularization_cost = (lambd / (2 * m)) * (np.sum(np.square(w1)) + np.sum(np.square(w2)))
    cost = cross_entropy_cost + l2_regularization_cost
    return cost

# 反向传播(计算神经网络的梯度值)
def backward_propagation(parameters, cache, X, Y, lambd=0.3):
    m = Y.shape[1]
    w1, w2, a1, a2 = parameters['w1'], parameters['w2'], cache['a1'], cache['a2']
    dz2 = a2 - Y
    dw2 = np.dot(dz2, a1.T) / m + (lambd / m) * w2
    db2 = np.mean(dz2, axis=1, keepdims=True)
    dz1 = np.dot(w2.T, dz2) * (1 - np.power(a1, 2))
    dw1 = np.dot(dz1, X.T) / m + (lambd / m) * w1
    db1 = np.mean(dz1, axis=1, keepdims=True)
    grads = {'dw1': dw1, 'db1': db1, 'dw2': dw2, 'db2': db2}
    return grads

#更新参数
def update_parameters_with_adam(parameters, grads, learning_rate=0.001, beta1=0.9, beta2=0.999, epsilon=1e-8):
    w1, b1, w2, b2 = parameters.values()
    dw1, db1, dw2, db2 = grads.values()
    vdW1, vdW2 = np.zeros_like(w1), np.zeros_like(w2)
    sdW1, sdW2 = np.zeros_like(w1), np.zeros_like(w2)
    vdb1, vdb2 = np.zeros_like(b1), np.zeros_like(b2)
    sdb1, sdb2 = np.zeros_like(b1), np.zeros_like(b2)
    vdW1 = beta1 * vdW1 + (1 - beta1) * dw1
    vdb1 = beta1 * vdb1 + (1 - beta1) * db1
    vdW2 = beta1 * vdW2 + (1 - beta1) * dw2
    vdb2 = beta1 * vdb2 + (1 - beta1) * db2
    sdW1 = beta2 * sdW1 + (1 - beta2) * np.square(dw1)
    sdb1 = beta2 * sdb1 + (1 - beta2) * np.square(db1)
    sdW2 = beta2 * sdW2 + (1 - beta2) * np.square(dw2)
    sdb2 = beta2 * sdb2 + (1 - beta2) * np.square(db2)
    w1 -= (learning_rate * vdW1) / (np.sqrt(sdW1) + epsilon)
    b1 -= (learning_rate * vdb1) / (np.sqrt(sdb1) + epsilon)
    w2 -= (learning_rate * vdW2) / (np.sqrt(sdW2) + epsilon)
    b2 -= (learning_rate * vdb2) / (np.sqrt(sdb2) + epsilon)
    parameters = {'w1': w1, 'b1': b1, 'w2': w2, 'b2': b2}
    return parameters

def predict(parameters, x_test, y_test):
    w1 = parameters['w1']
    b1 = parameters['b1']
    w2 = parameters['w2']
    b2 = parameters['b2']
    z1 = np.dot(w1, x_test) + b1
    a1 = np.tanh(z1)
    z2 = np.dot(w2, a1) + b2
    a2 = 1 / (1 + np.exp(-z2))
    output = np.where(a2 > 0.5, 1, 0)
    print('预测结果:')
    print(output)
    print("\n")
    print('真实结果:')
    print(y_test)
    accuracy = np.mean(np.all(output == y_test, axis=0)) * 100
    print('准确率:%.2f%%' % accuracy)
    return output

def nn_model(X, Y, n_h, n_input, n_output, num_iterations=10000, print_cost=False):
    np.random.seed(3)
    n_x = n_input
    n_y = n_output
    parameters = initialize_parameters(n_x, n_h, n_y)
    cost_history = []
    for i in range(1, num_iterations + 1):
        a2, cache = forward_propagation(X, parameters)
        cost = compute_cost(a2, Y, parameters)
        grads = backward_propagation(parameters, cache, X, Y)
        parameters = update_parameters_with_adam(parameters, grads)
        if i % 100 == 0:
            cost_history.append(cost)
        if print_cost and i % 1000 == 0:
            print('迭代第%i次     代价函数:%f' % (i, cost))
            print("-----------------------------------------------")
    return parameters, print_cost, cost_history

def plot_cost_history(cost_history):
    plt.figure('代价函数')
    plt.plot(cost_history)
    plt.title('Cost Function')
    plt.xlabel('Iterations (per 100)')
    plt.ylabel('Cost')
    plt.show()

def result_visualization(x_test, y_test, result):
    cols = y_test.shape[1]
    y = []
    pre = []
    labels = ['setosa', 'versicolor', 'virginica']
    y = [labels[np.argmax(y_test[:, i])] for i in range(y_test.shape[1])]
    pre = [labels[np.argmax(result[:, i])] if np.max(result[:, i]) > 0.5 else 'unknown' for i in range(result.shape[1])]
    y = pd.Series(y)
    pre = pd.Series(pre)
    real = np.concatenate((x_test.T, np.array(y).reshape(-1, 1)), axis=1)
    prediction = np.concatenate((x_test.T, np.array(pre).reshape(-1, 1)), axis=1)
    df_real = pd.DataFrame(real, columns=['Sepal Length', 'Sepal Width', 'Petal Length', 'Petal Width', 'Species'])
    df_prediction = pd.DataFrame(prediction, columns=['Sepal Length', 'Sepal Width', 'Petal Length', 'Petal Width', 'Species'])
    df_real[['Sepal Length', 'Sepal Width', 'Petal Length', 'Petal Width']] = df_real[['Sepal Length', 'Sepal Width', 'Petal Length', 'Petal Width']].astype(float)
    df_prediction[['Sepal Length', 'Sepal Width', 'Petal Length', 'Petal Width']] = df_prediction[['Sepal Length', 'Sepal Width', 'Petal Length', 'Petal Width']].astype(float)
    fig, axes = plt.subplots(1, 2, figsize=(14, 6))
    radviz(df_real, 'Species', color=['blue', 'green', 'red'], ax=axes[0])
    radviz(df_prediction, 'Species', color=['blue', 'green', 'red'], ax=axes[1])
    fig.suptitle('Real Results vs. Predictions')
    axes[0].title.set_text('Real Results')
    axes[1].title.set_text('Predictions')
    plt.show()

# 加载数据集
iris = datasets.load_iris()
X = iris.data
y = iris.target.reshape(-1, 1)

# One-hot编码
encoder = OneHotEncoder(sparse_output=False)
y_one_hot = encoder.fit_transform(y)

# 拆分数据集
X_train, X_test, y_train, y_test = train_test_split(X, y_one_hot, test_size=0.2, random_state=42)

# 转置数据集以适应神经网络的输入格式
X_train = X_train.T
X_test = X_test.T
y_train = y_train.T
y_test = y_test.T

# 设置神经网络参数
n_input = X_train.shape[0]
n_output = y_train.shape[0]
n_h = 10  # 隐藏层单元数
num_iterations = 10000  # 迭代次数

# 训练神经网络
parameters, print_cost, cost_history = nn_model(X_train, y_train, n_h, n_input, n_output, num_iterations, print_cost=True)

# 预测并评估结果
result = predict(parameters, X_test, y_test)

# 绘制代价函数变化
plot_cost_history(cost_history)

# 结果可视化
result_visualization(X_test, y_test, result)
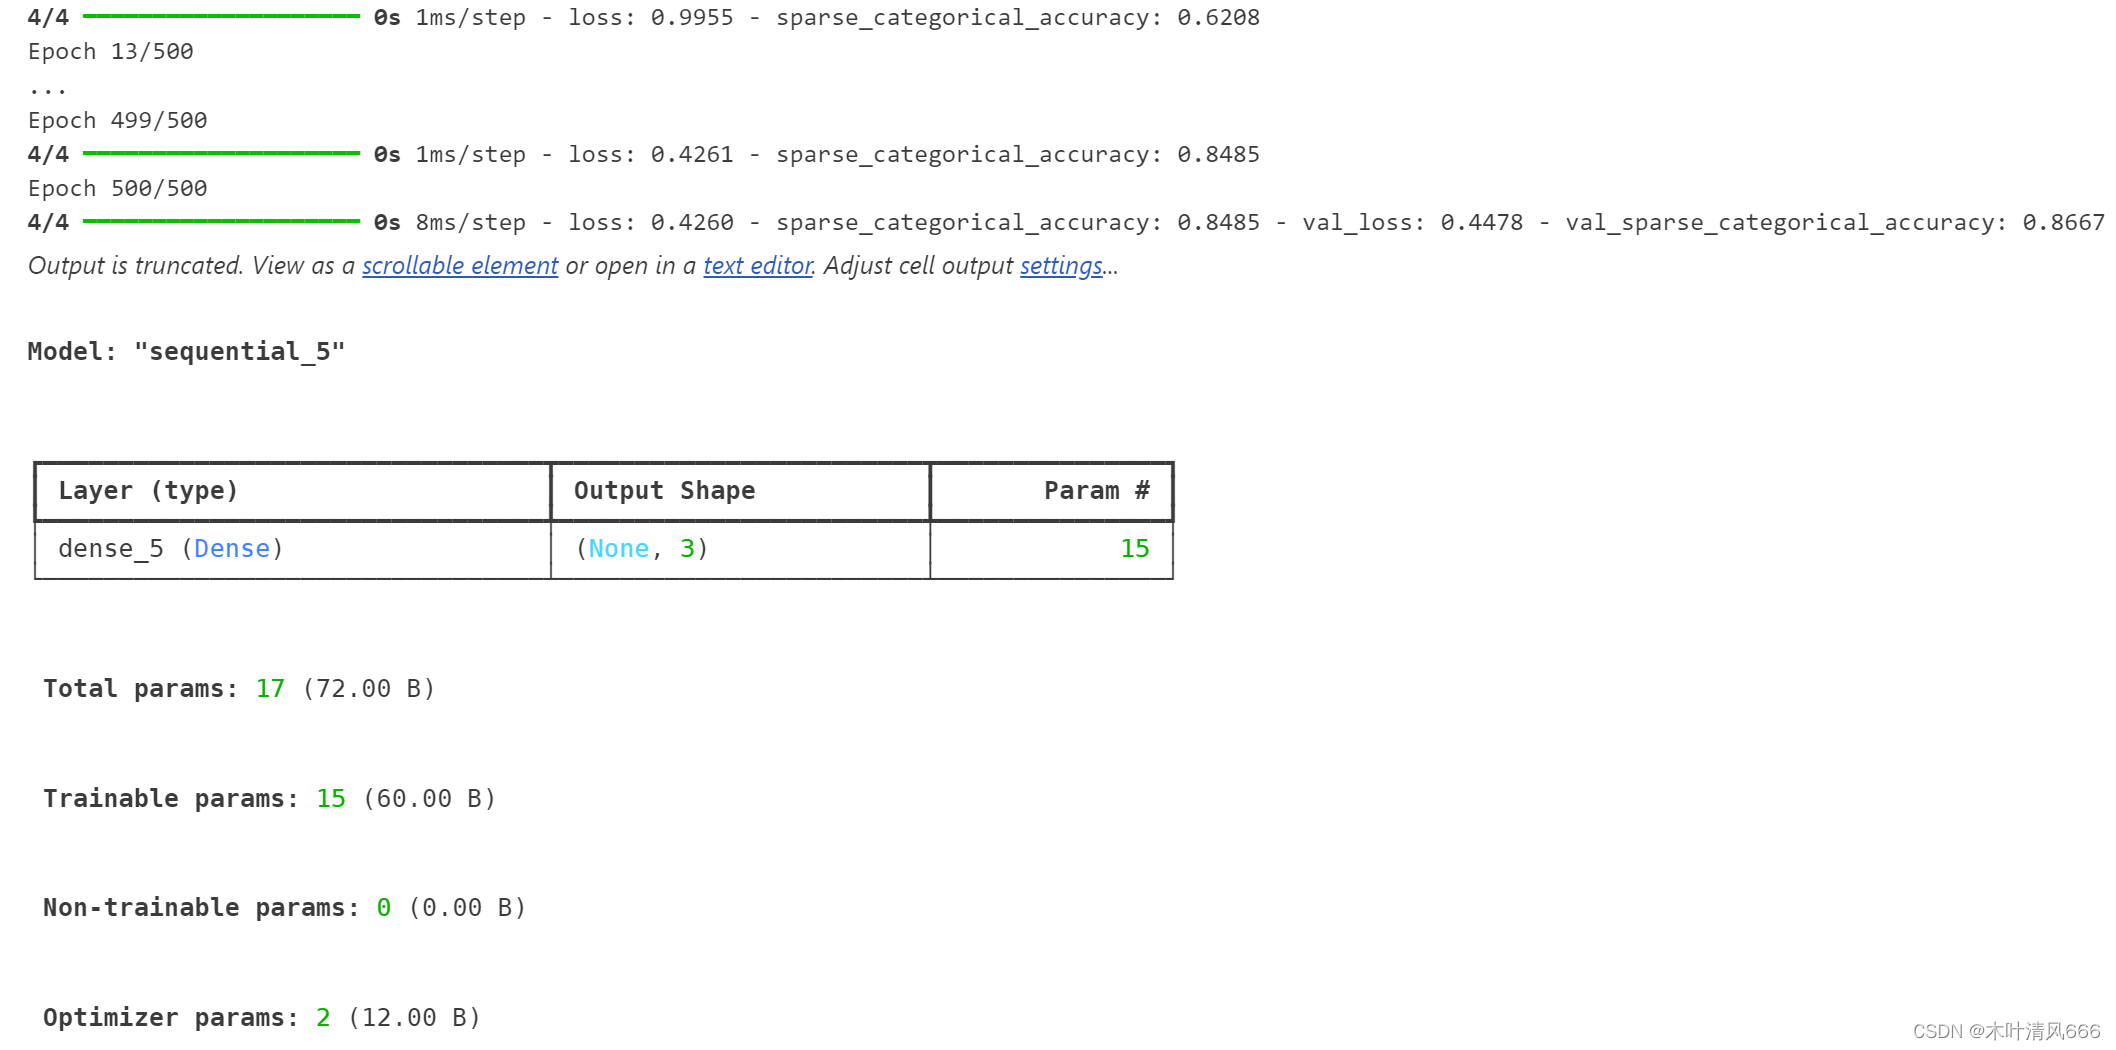
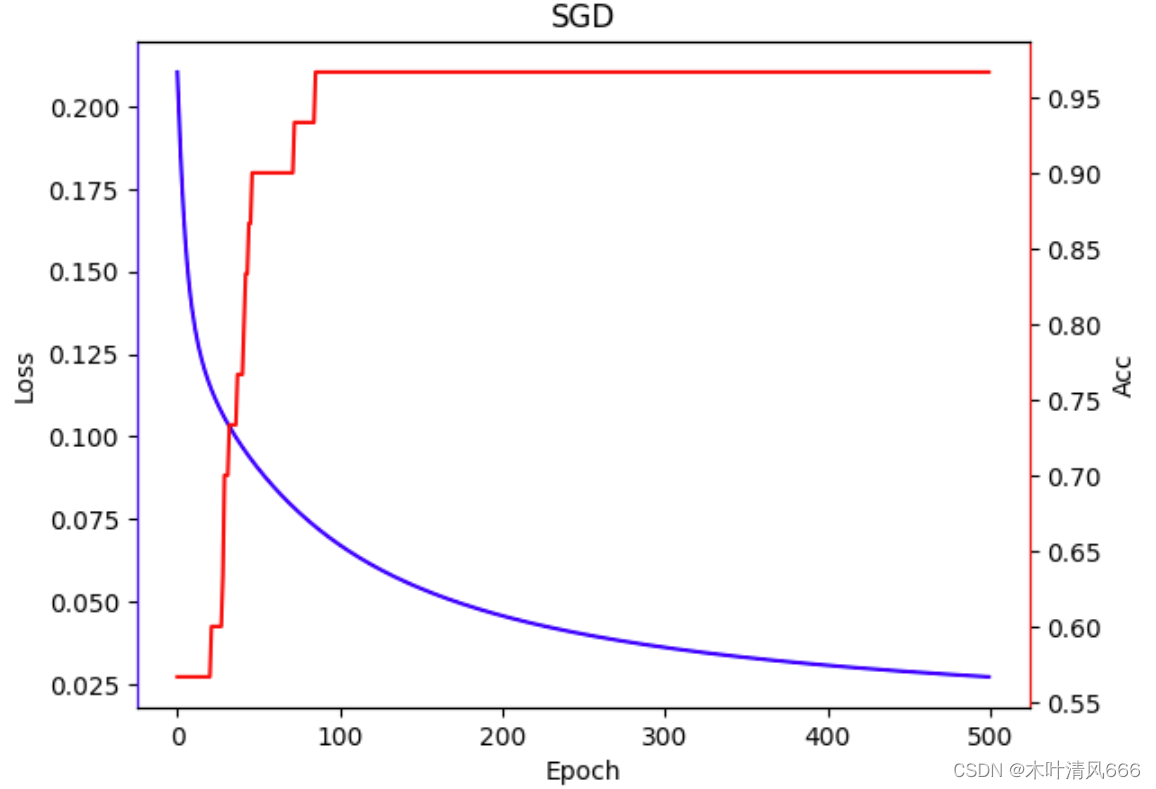
3.3 结果演示


4. 问题与分析

升级该库使用命令 pip install --upgrade scikit-learn

或者使用旧版本参数 spare=False