动画是一种高效的可视化工具,能够提升用户的吸引力和视觉体验,有助于以富有意义的方式呈现数据可视化。本文的主要介绍在Python中两种简单制作动图的方法。其中一种方法是使用matplotlib的Animations模块绘制动图,另一种方法是基于Pillow生成GIF动图。
python学习资料已打包好,需要的小伙伴可以戳这里【python资料】
1 Animations模块
Matplotlib的Animations模块提供了FuncAnimation和ArtistAnimation类来创建matplotlib绘图动画,FuncAnimation和ArtistAnimation都是Animation类的子类。它们的区别在于实现动画的方式和使用场景不同。FuncAnimation适用于根据时间更新图形状态的动画效果,且更加灵活和常用。而ArtistAnimation适用于将已有的静态图像序列组合成动画的效果。具体区别如下:
FuncAnimation:FuncAnimation是基于函数的方法来创建动画的。它使用用户提供的一个或多个函数来更新图形的状态,并按照一定的时间间隔连续地调用这些函数,从而实现动画效果。用户需要定义一个更新函数,该函数在每个时间步长上更新图形对象的属性,然后FuncAnimation会根据用户指定的帧数、时间间隔等参数来自动计算动画的帧序列。这种方法适用于需要根据时间变化来更新图形状态的动画效果。ArtistAnimation:ArtistAnimation是基于静态图像的方法来创建动画的。它要求用户提供一系列的静态图像,称为艺术家对象。这些图像可以是通过Matplotlib创建的任何类型的可视化对象,例如Figure、Axes、Line2D等。用户需要将这些静态图像存储在一个列表中,然后通过ArtistAnimation来显示这些图像的序列。ArtistAnimation会按照用户指定的时间间隔逐帧地显示这些图像,从而实现动画效果。这种方法适用于已经有一系列静态图像需要组合成动画的场景。
本节将通过几个示例来介绍Animations模块的使用,所介绍的示例出自:gallery-animation。
1.1 FuncAnimation类
FuncAnimation构造函数的参数含义如下:
fig:要绘制动画的Figure对象。func:用于更新每一帧的函数,该函数接受一个参数frame,表示当前待绘制的数据帧。frames:用于产生待绘制的数据,可以是整数、生成器函数或迭代器。init_func:在绘制动画之前调用的初始化函数。fargs:传递给func函数的附加参数(可选)。save_count:指定动画中缓存的帧数量(可选),默认为100。注意该参数用于确定最后生成动图和视频所用图像的数量。interval:每一帧之间的时间间隔,以毫秒为单位,默认为200。repeat:控制动画是否重复播放,默认为True。repeat_delay:重复动画之间的延迟时间(以毫秒为单位),默认为0。blit:指定是否使用blitting技术来进行绘制优化,默认为False。cache_frame_data:指定是否缓存帧数据,默认为True。
示例-生成动态的正弦波动画
import itertools |
|
import matplotlib.pyplot as plt |
|
import numpy as np |
|
import matplotlib.animation as animation |
|
# 定义生成数据的函数 |
|
def data_gen(max_range): |
|
# 使用itertools.count()生成无限递增的计数器 |
|
for cnt in itertools.count(): |
|
# 当计数器超过最大范围时停止生成数据 |
|
if cnt > max_range: |
|
break |
|
print(cnt) |
|
# 计算时间t和对应的y值,使用np.sin()计算sin函数,np.exp()计算指数函数 |
|
t = cnt / 10 |
|
yield t, np.sin(2*np.pi*t) * np.exp(-t/10.) |
|
# 初始化函数,设置坐标轴范围和清空数据 |
|
def init(): |
|
ax.set_ylim(-1.1, 1.1) |
|
ax.set_xlim(0, 1) |
|
del xdata[:] |
|
del ydata[:] |
|
line.set_data(xdata, ydata) |
|
return line, |
|
# 创建图形对象以及子图对象 |
|
fig, ax = plt.subplots() |
|
# 创建线条对象 |
|
line, = ax.plot([], [], lw=2) |
|
# 创建文本对象用于显示 x 和 y 值 |
|
text = ax.text(0., 0., '', transform=ax.transAxes) |
|
# 设置文本位置 |
|
text.set_position((0.7, 0.95)) |
|
# 将文本对象添加到图形中 |
|
ax.add_artist(text) |
|
ax.grid() |
|
xdata, ydata = [], [] |
|
# 更新函数,将新的数据添加到图形中 |
|
def run(data): |
|
# 获取传入的数据 |
|
t, y = data |
|
# 将时间和对应的y值添加到xdata和ydata中 |
|
xdata.append(t) |
|
ydata.append(y) |
|
# 获取当前坐标轴的范围 |
|
xmin, xmax = ax.get_xlim() |
|
# 更新文本对象的值 |
|
text.set_text('x = {:.2f}, y = {:.2f}'.format(t, y)) |
|
# 如果时间t超过当前范围,更新坐标轴范围 |
|
if t >= xmax: |
|
ax.set_xlim(xmin, 2*xmax) |
|
# 重绘图形 |
|
ax.figure.canvas.draw() |
|
# 更新线条的数据 |
|
line.set_data(xdata, ydata) |
|
return line, text |
|
# 创建动画对象 |
|
# fig:图形对象 |
|
# run:更新函数,用于更新图形中的数据 |
|
# data_gen(20):生成器函数,产生数据的最大范围为20 |
|
# interval=100:每帧动画的时间间隔为100毫秒 |
|
# init_func=init:初始化函数,用于设置图形的初始状态 |
|
# repeat=True:动画重复播放 |
|
ani = animation.FuncAnimation(fig, run, data_gen(20), interval=100, init_func=init, repeat=True) |
|
# 显示图形 |
|
plt.show() |
示例-创建动态散点图与折线图
import matplotlib.pyplot as plt |
|
import numpy as np |
|
import matplotlib.animation as animation |
|
# 创建一个图形窗口和坐标轴 |
|
fig, ax = plt.subplots() |
|
# 创建时间数组 |
|
t = np.linspace(0, 3, 50) |
|
# 自由落体加速度 |
|
g = -9.81 |
|
# 初始速度 |
|
v0 = 12 |
|
# 计算高度 |
|
z = g * t**2 / 2 + v0 * t |
|
# 第二个初始速度 |
|
v02 = 5 |
|
# 计算第二个高度 |
|
z2 = g * t**2 / 2 + v02 * t |
|
# 创建散点图 |
|
scat = ax.scatter(t[0], z[0], c="b", s=5, label=f'v0 = {v0} m/s') |
|
# 创建线图 |
|
line2 = ax.plot(t[0], z2[0], label=f'v0 = {v02} m/s')[0] |
|
# 设置坐标轴范围和标签 |
|
ax.set(xlim=[0, 3], ylim=[-4, 10], xlabel='Time [s]', ylabel='Z [m]') |
|
# 添加图例 |
|
ax.legend() |
|
def update(frame): |
|
x = t[:frame] |
|
y = z[:frame] |
|
# 更新散点图 |
|
data = np.stack([x, y]).T |
|
# 更新散点图中每个点的位置 |
|
scat.set_offsets(data) |
|
# 更新线图 |
|
line2.set_xdata(t[:frame]) |
|
line2.set_ydata(z2[:frame]) |
|
return (scat, line2) |
|
# 创建动画 |
|
# frames为数值表示动画的总帧数,即每次更新参数传入当前帧号 |
|
ani = animation.FuncAnimation(fig=fig, func=update, frames=40, interval=30) |
|
# 显示图形 |
|
plt.show() |
示例-贝叶斯更新动画
import math |
|
import matplotlib.pyplot as plt |
|
import numpy as np |
|
from matplotlib.animation import FuncAnimation |
|
# 定义分布概率密度函数 |
|
def beta_pdf(x, a, b): |
|
return (x**(a-1) * (1-x)**(b-1) * math.gamma(a + b) |
|
/ (math.gamma(a) * math.gamma(b))) |
|
# 更新分布类,用于更新动态图 |
|
class UpdateDist: |
|
def __init__(self, ax, prob=0.5): |
|
self.success = 0 |
|
self.prob = prob |
|
self.line, = ax.plot([], [], 'k-') |
|
self.x = np.linspace(0, 1, 200) |
|
self.ax = ax |
|
# 设置图形参数 |
|
self.ax.set_xlim(0, 1) |
|
self.ax.set_ylim(0, 10) |
|
self.ax.grid(True) |
|
# 这条竖直线代表了理论值,图中的分布应该趋近于这个值 |
|
self.ax.axvline(prob, linestyle='--', color='black') |
|
def __call__(self, i): |
|
# 这样图形可以连续运行,我们只需不断观察过程的新实现 |
|
if i == 0: |
|
self.success = 0 |
|
self.line.set_data([], []) |
|
return self.line, |
|
# 根据超过阈值与均匀选择来选择成功 |
|
if np.random.rand() < self.prob: |
|
self.success += 1 |
|
y = beta_pdf(self.x, self.success + 1, (i - self.success) + 1) |
|
self.line.set_data(self.x, y) |
|
return self.line, |
|
# 设置随机状态以便再现结果 |
|
np.random.seed(0) |
|
# 创建图形和坐标轴对象 |
|
fig, ax = plt.subplots() |
|
# 创建更新分布对象,并应该收敛到的理论值为0.7 |
|
ud = UpdateDist(ax, prob=0.7) |
|
# 创建动画对象 |
|
anim = FuncAnimation(fig, ud, frames=100, interval=100, |
|
blit=True, repeat_delay=1000) |
|
# 显示动画 |
|
plt.show() |
示例-模拟雨滴
import matplotlib.pyplot as plt |
|
import numpy as np |
|
from matplotlib.animation import FuncAnimation |
|
# 设置随机种子以确保可复现性 |
|
np.random.seed(0) |
|
# 创建画布和坐标轴对象 |
|
fig = plt.figure(figsize=(7, 7)) |
|
# 在画布上添加一个坐标轴对象。 |
|
# [0, 0, 1, 1]参数指定了坐标轴的位置和大小,分别表示左下角的 x 坐标、左下角的 y 坐标、宽度和高度。 |
|
# frameon=False参数表示不显示坐标轴的边框 |
|
ax = fig.add_axes([0, 0, 1, 1], frameon=False) |
|
ax.set_xlim(0, 1), ax.set_xticks([]) |
|
ax.set_ylim(0, 1), ax.set_yticks([]) |
|
# 创建雨滴数据 |
|
n_drops = 50 |
|
rain_drops = np.zeros(n_drops, dtype=[('position', float, (2,)), |
|
('size', float), |
|
('growth', float), |
|
('color', float, (4,))]) |
|
# 随机初始化雨滴的位置和生长速率 |
|
rain_drops['position'] = np.random.uniform(0, 1, (n_drops, 2)) |
|
rain_drops['growth'] = np.random.uniform(50, 200, n_drops) |
|
# 创建散点图对象,用于在动画中更新雨滴的状态 |
|
scat = ax.scatter(rain_drops['position'][:, 0], rain_drops['position'][:, 1], |
|
s=rain_drops['size'], lw=0.5, edgecolors=rain_drops['color'], |
|
facecolors='none') |
|
def update(frame_number): |
|
# 获取一个索引,用于重新生成最旧的雨滴 |
|
current_index = frame_number % n_drops |
|
# 随着时间的推移,使所有雨滴的颜色更加透明 |
|
rain_drops['color'][:, 3] -= 1.0 / len(rain_drops) |
|
rain_drops['color'][:, 3] = np.clip(rain_drops['color'][:, 3], 0, 1) |
|
# 所有雨滴变大 |
|
rain_drops['size'] += rain_drops['growth'] |
|
# 为最旧的雨滴选择一个新的位置,重置其大小、颜色和生长速率 |
|
rain_drops['position'][current_index] = np.random.uniform(0, 1, 2) |
|
rain_drops['size'][current_index] = 5 |
|
rain_drops['color'][current_index] = (0, 0, 0, 1) |
|
rain_drops['growth'][current_index] = np.random.uniform(50, 200) |
|
# 使用新的颜色、大小和位置更新散点图对象 |
|
scat.set_edgecolors(rain_drops['color']) |
|
scat.set_sizes(rain_drops['size']) |
|
scat.set_offsets(rain_drops['position']) |
|
# 创建动画,并将update函数作为动画的回调函数 |
|
animation = FuncAnimation(fig, update, interval=10, save_count=100) |
|
plt.show() |
示例-跨子图动画
import matplotlib.pyplot as plt |
|
import numpy as np |
|
import matplotlib.animation as animation |
|
from matplotlib.patches import ConnectionPatch |
|
# 创建一个包含左右两个子图的图形对象 |
|
fig, (axl, axr) = plt.subplots( |
|
ncols=2, # 指定一行中子图的列数为2,即创建两个子图 |
|
sharey=True, # 共享y轴刻度 |
|
figsize=(6, 2), |
|
# width_ratios=[1, 3]指定第二个子图的宽度为第一个子图的三倍 |
|
# wspace=0 设置子图之间的水平间距为0 |
|
gridspec_kw=dict(width_ratios=[1, 3], wspace=0), |
|
) |
|
# 设置左侧子图纵横比为1,即使得它的宽度和高度相等 |
|
axl.set_aspect(1) |
|
# 设置右侧子图纵横比为1/3,即高度是宽度的三分之一 |
|
axr.set_box_aspect(1 / 3) |
|
# 右子图不显示y轴刻度 |
|
axr.yaxis.set_visible(False) |
|
# 设置右子图x轴刻度以及对应的标签 |
|
axr.xaxis.set_ticks([0, np.pi, 2 * np.pi], ["0", r"$\pi$", r"$2\pi$"]) |
|
# 在左子图上绘制圆 |
|
x = np.linspace(0, 2 * np.pi, 50) |
|
axl.plot(np.cos(x), np.sin(x), "k", lw=0.3) |
|
# 在左子图上绘制初始点 |
|
point, = axl.plot(0, 0, "o") |
|
# 在右子图上绘制完整的正弦曲线,以设置视图限制 |
|
sine, = axr.plot(x, np.sin(x)) |
|
# 绘制连接两个图表的连线 |
|
con = ConnectionPatch( |
|
(1, 0), # 连接线的起始点坐标 |
|
(0, 0), # 连接线的终点坐标 |
|
"data", |
|
"data", |
|
axesA=axl, # 指定连接线的起始点所在的坐标轴 |
|
axesB=axr, # 指定连接线的终点所在的坐标轴 |
|
color="red", |
|
ls="dotted", # 连接线类型 |
|
) |
|
fig.add_artist(con) |
|
# 定义动画函数 |
|
def animate(i): |
|
x = np.linspace(0, i, int(i * 25 / np.pi)) |
|
sine.set_data(x, np.sin(x)) |
|
x, y = np.cos(i), np.sin(i) |
|
point.set_data([x], [y]) |
|
con.xy1 = x, y |
|
con.xy2 = i, y |
|
return point, sine, con |
|
# 创建动画对象 |
|
ani = animation.FuncAnimation( |
|
fig, |
|
animate, |
|
interval=50, |
|
blit=False, # 不使用blitting技术,这里Figure artists不支持blitting |
|
frames=x, |
|
repeat_delay=100, # 动画重复播放延迟100毫秒 |
|
) |
|
# 展示动画 |
|
plt.show() |
示例-动态示波器
import matplotlib.pyplot as plt |
|
import numpy as np |
|
import matplotlib.animation as animation |
|
from matplotlib.lines import Line2D |
|
# 创建一个 Scope 类用于绘制动态图形 |
|
class Scope: |
|
def __init__(self, ax, maxt=2, dt=0.02): |
|
""" |
|
:param ax: Matplotlib 的坐标轴对象 |
|
:param maxt: 时间的最大值,默认为2 |
|
:param dt: 时间步长,默认为0.02 |
|
""" |
|
self.ax = ax |
|
self.dt = dt |
|
self.maxt = maxt |
|
self.tdata = [0] # 时间数据的列表 |
|
self.ydata = [0] # y轴数据的列表 |
|
self.line = Line2D(self.tdata, self.ydata) # 创建一条线对象 |
|
self.ax.add_line(self.line) # 将线对象添加到坐标轴上 |
|
self.ax.set_ylim(-.1, 1.1) # 设置y轴范围 |
|
self.ax.set_xlim(0, self.maxt) # 设置x轴范围 |
|
def update(self, y): |
|
""" |
|
更新图形数据 |
|
:param y: 新的y轴数据 |
|
:return: 更新后的线对象 |
|
""" |
|
lastt = self.tdata[-1] |
|
if lastt >= self.tdata[0] + self.maxt: # 如果当前时间超过了最大时间,重新设置数组 |
|
self.tdata = [self.tdata[-1]] |
|
self.ydata = [self.ydata[-1]] |
|
self.ax.set_xlim(self.tdata[0], self.tdata[0] + self.maxt) |
|
self.ax.figure.canvas.draw() |
|
# 进行时间的计算 |
|
t = self.tdata[0] + len(self.tdata) * self.dt |
|
self.tdata.append(t) |
|
self.ydata.append(y) |
|
self.line.set_data(self.tdata, self.ydata) |
|
return self.line, |
|
def emitter(p=0.1): |
|
"""以概率p(范围为[0, 1))返回一个随机值,否则返回0""" |
|
while True: |
|
v = np.random.rand() |
|
if v > p: |
|
yield 0. |
|
else: |
|
yield np.random.rand() |
|
np.random.seed(0) |
|
fig, ax = plt.subplots() # 创建一个图形窗口和一对坐标轴 |
|
scope = Scope(ax) # 创建一个Scope对象,用于绘制动态图 |
|
# 使用scope的类函数update作为更新函数 |
|
ani = animation.FuncAnimation(fig, scope.update, emitter, interval=50, blit=True, save_count=100) |
|
plt.show() |
示例-世界主要城市的人口数量动态展示
本示例代码和数据来自于: how-to-create-animations-in-python。这段代码支持展示自1500年到2020年期间人口数排名靠前的城市的变化趋势。该示例只是介绍简单的动态条形图绘制,更加精美的条形图绘制可使用:bar_chart_race或pandas_alive。
import pandas as pd |
|
import matplotlib.pyplot as plt |
|
import matplotlib.ticker as ticker |
|
from matplotlib.animation import FuncAnimation |
|
import matplotlib.patches as mpatches |
|
# 定义一个函数,用于生成颜色列表 |
|
def generate_colors(string_list): |
|
num_colors = len(string_list) |
|
# 使用tab10调色板,可以根据需要选择不同的调色板 |
|
colormap = plt.cm.get_cmap('tab10', num_colors) |
|
colors = [] |
|
for i in range(num_colors): |
|
color = colormap(i) |
|
colors.append(color) |
|
return colors |
|
# 读取CSV文件,并选择所需的列 |
|
# 数据地址:https://media.geeksforgeeks.org/wp-content/cdn-uploads/20210901121516/city_populations.csv |
|
df = pd.read_csv('city_populations.csv', usecols=[ |
|
'name', 'group', 'year', 'value']) |
|
# 将年份列转换为整数型 |
|
df['year'] = df['year'].astype(int) |
|
# 将人口数量列转换为浮点型 |
|
df['value'] = df['value'].astype(float) |
|
# 获取城市分组列表 |
|
group = list(set(df.group)) |
|
# 生成城市分组对应的颜色字典 |
|
group_clolor = dict(zip(group, generate_colors(group))) |
|
# 创建城市名称与分组的字典 |
|
group_name = df.set_index('name')['group'].to_dict() |
|
# 定义绘制柱状图的函数 |
|
def draw_barchart(year): |
|
# 根据年份筛选数据,并按人口数量进行降序排序,取出最大范围的数据 |
|
df_year = df[df['year'].eq(year)].sort_values( |
|
by='value', ascending=True).tail(max_range) |
|
ax.clear() |
|
# 绘制水平柱状图,并设置颜色 |
|
ax.barh(df_year['name'], df_year['value'], color=[ |
|
group_clolor[group_name[x]] for x in df_year['name']]) |
|
# 在柱状图上方添加文字标签 |
|
dx = df_year['value'].max() / 200 |
|
for i, (value, name) in enumerate(zip(df_year['value'], df_year['name'])): |
|
# 城市名 |
|
ax.text(value-dx, i, name, |
|
size=12, weight=600, |
|
ha='right', va='bottom') |
|
ax.text(value-dx, i-0.25, group_name[name], |
|
size=10, color='#333333', |
|
ha='right', va='baseline') |
|
# 地区名 |
|
ax.text(value+dx, i, f'{value:,.0f}', |
|
size=12, ha='left', va='center') |
|
# 设置其他样式 |
|
ax.text(1, 0.2, year, transform=ax.transAxes, |
|
color='#777777', size=46, ha='right', |
|
weight=800) |
|
ax.text(0, 1.06, 'Population (thousands)', |
|
transform=ax.transAxes, size=12, |
|
color='#777777') |
|
# 添加图例 |
|
handles = [] |
|
for name, color in group_clolor.items(): |
|
patch = mpatches.Patch(color=color, label=name) |
|
handles.append(patch) |
|
ax.legend(handles=handles, fontsize=12, loc='center', bbox_to_anchor=( |
|
0.5, -0.03), ncol=len(group_clolor), frameon=False) |
|
# x轴的主要刻度格式化,不保留小数 |
|
ax.xaxis.set_major_formatter(ticker.StrMethodFormatter('{x:,.0f}')) |
|
# 将x轴的刻度位置设置在图的顶部 |
|
ax.xaxis.set_ticks_position('top') |
|
# 设置x轴的刻度颜色为灰色(#777777),字体大小为16 |
|
ax.tick_params(axis='x', colors='#777777', labelsize=16) |
|
# 清除y轴的刻度标签 |
|
ax.set_yticks([]) |
|
# 在x轴和y轴上设置0.01的边距 |
|
ax.margins(0, 0.01) |
|
# 在x轴上绘制主要网格线,线条样式为实线 |
|
ax.grid(which='major', axis='x', linestyle='-') |
|
# 设置网格线绘制在图像下方 |
|
ax.set_axisbelow(True) |
|
# 添加绘图信息 |
|
ax.text(0, 1.10, f'The {max_range} most populous cities in the world from {start_year} to {end_year}', |
|
transform=ax.transAxes, size=24, weight=600, ha='left') |
|
ax.text(1, 0, 'Produced by luohenyueji', |
|
transform=ax.transAxes, ha='right', color='#777777', |
|
bbox=dict(facecolor='white', alpha=0.8, edgecolor='white')) |
|
plt.box(False) |
|
# 创建绘图所需的figure和axes |
|
fig, ax = plt.subplots(figsize=(12, 8)) |
|
start_year = 2000 |
|
end_year = 2020 |
|
# 设置最多显示城市数量 |
|
max_range = 15 |
|
# 获取数据中的最小年份和最大年份,并进行校验 |
|
min_year, max_year = min(set(df.year)), max(set(df.year)) |
|
assert min_year <= start_year, f"end_year cannot be lower than {min_year}" |
|
assert end_year <= max_year, f"end_year cannot be higher than {max_year}" |
|
# 创建动画对象,调用draw_barchart函数进行绘制 |
|
ani = FuncAnimation(fig, draw_barchart, frames=range( |
|
start_year, end_year+1), repeat_delay=1000, interval=200) |
|
fig.subplots_adjust(left=0.04, right=0.94, bottom=0.05) |
|
# 显示图形 |
|
plt.show() |
结果如下:
1.2 ArtistAnimation类
ArtistAnimation构造函数的参数含义如下:
fig:要绘制动画的Figure对象。artists:包含了一系列绘图对象的列表,这些绘图对象将被作为动画的帧。interval:每一帧之间的时间间隔,以毫秒为单位,默认为200。repeat:控制动画是否重复播放,默认为True。repeat_delay:重复动画之间的延迟时间(以毫秒为单位),默认为0。blit:指定是否使用blitting技术来进行绘制优化,默认为False。
示例-ArtistAnimation简单使用
import matplotlib.pyplot as plt |
|
import numpy as np |
|
import matplotlib.animation as animation |
|
fig, ax = plt.subplots() |
|
# 定义函数 f(x, y),返回 np.sin(x) + np.cos(y) |
|
def f(x, y): |
|
return np.sin(x) + np.cos(y) |
|
# 生成 x 和 y 的取值范围 |
|
x = np.linspace(0, 2 * np.pi, 120) |
|
y = np.linspace(0, 2 * np.pi, 100).reshape(-1, 1) |
|
# ims 是一个列表的列表,每一行是当前帧要绘制的艺术品列表; |
|
# 在这里我们只在每一帧动画中绘制一个艺术家,即图像 |
|
ims = [] |
|
# 循环生成动画的每一帧,并存入一个列表 |
|
for i in range(60): |
|
# 更新 x 和 y 的取值 |
|
x += np.pi / 15 |
|
y += np.pi / 30 |
|
# 调用函数 f(x, y),并绘制其返回的图像 |
|
im = ax.imshow(f(x, y), animated=True) |
|
if i == 0: |
|
# 首先显示一个初始的图像 |
|
ax.imshow(f(x, y)) |
|
# 将当前帧添加到ims中 |
|
ims.append([im]) |
|
# 基于ims中的绘图对象绘制动图 |
|
ani = animation.ArtistAnimation(fig, ims, interval=50, blit=True, |
|
repeat_delay=1000) |
|
# 显示动画 |
|
plt.show() |
示例-创建动态柱状图
import matplotlib.pyplot as plt |
|
import numpy as np |
|
import matplotlib.animation as animation |
|
fig, ax = plt.subplots() |
|
rng = np.random.default_rng(0) |
|
# # 创建一个包含5个元素的数组,表示数据集 |
|
data = np.array([20, 20, 20, 20,20]) |
|
# 创建一个包含5个字符串的列表,表示数据集的标签 |
|
x = ["A", "B", "C", "D","E"] |
|
# 创建一个空列表,用于存储图形对象 |
|
artists = [] |
|
# 创建一个包含5个颜色值的列表,用于绘制图形 |
|
colors = ['tab:blue', 'tab:red', 'tab:green', 'tab:purple', 'tab:orange'] |
|
for i in range(20): |
|
# 随机生成一个与data形状相同的数组,并将其加到data中 |
|
data += rng.integers(low=0, high=10, size=data.shape) |
|
# 创建一个水平条形图,并设置颜色 |
|
container = ax.barh(x, data, color=colors) |
|
# 设置x轴范围 |
|
ax.set_xlim(0,150) |
|
# 将创建的图形对象添加到列表中 |
|
artists.append(container) |
|
# 创建一个ArtistAnimation对象,指定图形窗口和图形对象列表以及动画间隔时间 |
|
ani = animation.ArtistAnimation(fig=fig, artists=artists, interval=200) |
|
plt.show() |
1.3 动画保存
Matplotlib通过plot方法创建和显示动画。为了保存动画为动图或视频,Animation类提供了save函数。save函数的常见参数如下:
filename:保存文件的路径和名称。writer:指定要使用的写入器(Writer)。如果未指定,则默认使用ffmpeg写入器。fps:设置帧速率(每秒显示多少帧),默认值为None,表示使用Animation对象中的interval属性作为帧速率。dpi:设置输出图像的分辨率,默认值为None,表示使用系统默认值。codec:指定视频编解码器,仅当writer为ffmpeg_writer时有效。bitrate:设置比特率,仅当writer为ffmpeg_writer时有效。extra_args:用于传递给写入器的额外参数。metadata:包含文件元数据的字典。extra_anim:与主要动画同时播放的其他动画。savefig_kwargs:传递给savefig()的关键字参数。progress_callback:用于在保存过程中更新进度的回调函数。
writer写入器可以指定使用各种多媒体写入程序(例如:Pillow、ffpmeg、imagemagik)保存到本地,如下所示:
| Writer | Supported Formats |
|---|---|
~matplotlib.animation.PillowWriter |
.gif, .apng, .webp |
~matplotlib.animation.HTMLWriter |
.htm, .html, .png |
~matplotlib.animation.FFMpegWriter |
All formats supported by ffmpeg: ffmpeg -formats |
~matplotlib.animation.ImageMagickWriter |
All formats supported by imagemagick: magick -list format |
保存动图和视频的代码如下:
# 动图 |
|
ani.save(filename="pillow_example.gif", writer="pillow") |
|
ani.save(filename="pillow_example.apng", writer="pillow") |
|
# 视频,需要安装ffmpeg |
|
ani.save(filename="ffmpeg_example.mkv", writer="ffmpeg") |
|
ani.save(filename="ffmpeg_example.mp4", writer="ffmpeg") |
|
ani.save(filename="ffmpeg_example.mjpeg", writer="ffmpeg") |
需要注意的是动图构建对象时所设置的参数不会影响save函数,如下所示,在FuncAnimation中设置repeat=False,即动图只播放一次。但是保存的gif文件却循环播放。这是因为save函数调用了其他第三库的动图或者视频保持函数,需要重新设置参数。
import numpy as np |
|
import matplotlib.pyplot as plt |
|
from matplotlib.animation import FuncAnimation |
|
# 创建画布和坐标轴 |
|
fig, ax = plt.subplots() |
|
xdata, ydata = [], [] |
|
ln, = plt.plot([], [], 'r-') |
|
def init(): |
|
ax.set_xlim(0, 2*np.pi) |
|
ax.set_ylim(-1, 1) |
|
return ln, |
|
def update(frame): |
|
x = np.linspace(0, 2*np.pi, 100) |
|
y = np.sin(x + frame/10) |
|
ln.set_data(x, y) |
|
return ln, |
|
# 创建动画对象 |
|
ani = FuncAnimation(fig, update, frames=100, interval=100, |
|
init_func=init, blit=True, repeat=False) |
|
ani.save(filename="pillow_example.gif", writer=writer, dpi=150) |
要解决保存动画问题,需要自定义动画保存类,如下所示:
import numpy as np |
|
import matplotlib.pyplot as plt |
|
from matplotlib.animation import FuncAnimation |
|
from matplotlib import animation |
|
# 创建画布和坐标轴 |
|
fig, ax = plt.subplots() |
|
xdata, ydata = [], [] |
|
ln, = plt.plot([], [], 'r-') |
|
def init(): |
|
ax.set_xlim(0, 2*np.pi) |
|
ax.set_ylim(-1, 1) |
|
return ln, |
|
def update(frame): |
|
x = np.linspace(0, 2*np.pi, 100) |
|
y = np.sin(x + frame/10) |
|
ln.set_data(x, y) |
|
return ln, |
|
# 创建动画对象 |
|
ani = FuncAnimation(fig, update, frames=100, interval=100, |
|
init_func=init, blit=True, repeat=False) |
|
# 创建自定义的动画写入类 |
|
class SubPillowWriter(animation.PillowWriter): |
|
def __init__(self, loop=1, **kwargs): |
|
super().__init__(**kwargs) |
|
# 将loop设置为0,表示无限循环播放;如果设置为一个大于0的数值,表示循环播放指定次数 |
|
self.loop = loop |
|
# 定义播放结束时,保存图片的代码 |
|
def finish(self): |
|
# 调用了pillow包 |
|
self._frames[0].save(self.outfile, save_all=True, append_images=self._frames[1:], duration=int( |
|
1000 / self.fps), loop=self.loop) |
|
# 创建动画写入对象 |
|
# fps=15:每秒帧数,表示动画的播放速度为每秒 15 帧。 |
|
# metadata=dict(artist='luohenyueji'):元数据信息,包括艺术家信息,将被添加到生成的GIF文件中。 |
|
writer = SubPillowWriter(fps=15, metadata=dict(artist='luohenyueji')) |
|
ani.save(filename="pillow_example.gif", writer=writer, dpi=150) |
2 基于Pillow库生成动图
使用Pillow库生成动图非常简单。首先,准备一个包含一系列图像帧的列表。这些图像帧可以是连续的图片,每张图片表示动画的一个时间点。接下来,使用Pillow库中的save()方法将这些图像帧保存为一个gif文件。在保存动图时,还可以设置一些参数来控制动画效果。参考以下示例,可获取具体的使用说明。
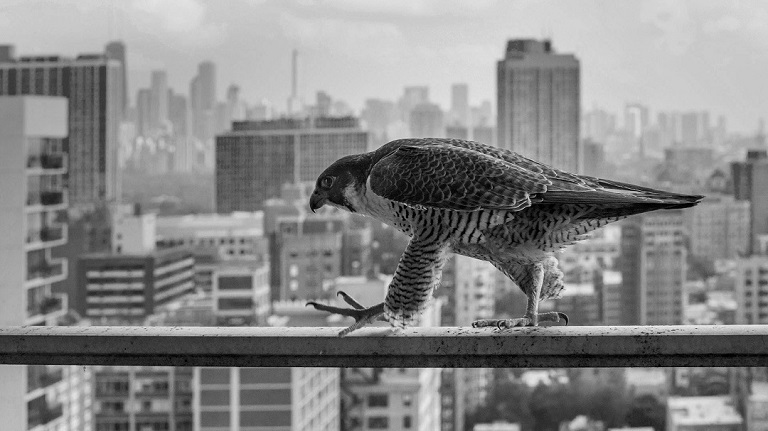
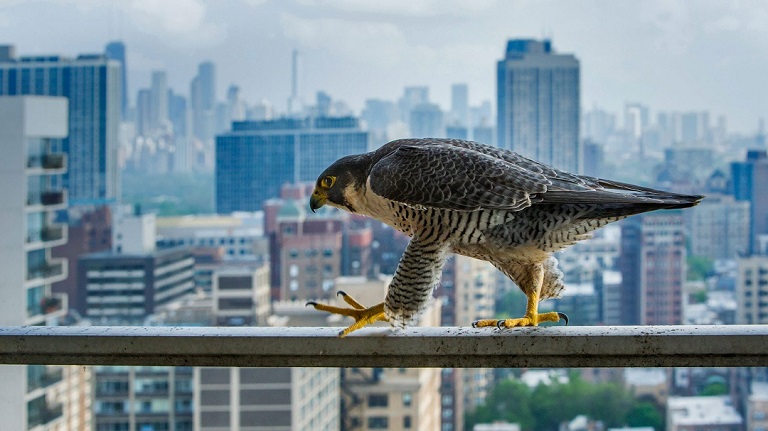
示例-滑动动图
该示例展示了一种图像滑动展示的动画效果,即通过滑动渐变的方式逐步将起始黑白图片转变为目标彩色图片。所示起始图片和目标图片如下所示:
动画结果如下所示:
本示例所提供代码主要可调参数介绍如下:
span(int): 分割步长,默认为100。此参数用于控制图片合并过程中的分割步长,即每次移动的距离。save(bool): 是否保存中间帧图像,默认为False。如果设置为True,则会将生成的每一帧图像保存到指定的文件夹中。orient(str): 合并方向,默认水平。可选值为'horizontal'(水平方向)或'vertical'(垂直方向)。用于控制图像的合并方向。loop(int): 循环次数,默认为0(无限循环)。设置为正整数时,动画会循环播放指定次数;设置为0时,动画会无限循环播放。duration(int): 帧持续时间(毫秒),默认为100。用于设置每一帧图像在动画中的显示时间。repeat_delay(int): 循环之间的延迟时间(毫秒),默认为500。用于设置每次循环之间的延迟时间。save_name(str): 保存动画的文件名,默认为"output"。用于设置生成的动画文件的名称。
以下是代码实现的示例。该代码首先读取起始图片和目标图片,然后指定分割位置以设置图片两侧的效果。最后,通过调整分割位置来实现滑动渐变效果。
from PIL import Image, ImageDraw |
|
import os |
|
def merge_image(in_img, out_img, pos, orient="horizontal"): |
|
""" |
|
合并图像的函数 |
|
参数: |
|
in_img (PIL.Image): 输入图像 |
|
out_img (PIL.Image): 输出图像 |
|
pos (int): 分割位置 |
|
orient (str): 图像合并方向,默认水平horizontal,可选垂直vertical |
|
返回: |
|
result_image (PIL.Image): 合并后的图像 |
|
""" |
|
if orient == "horizontal": |
|
# 将图像分为左右两部分 |
|
left_image = out_img.crop((0, 0, pos, out_img.size[1])) |
|
right_image = in_img.crop((pos, 0, in_img.size[0], in_img.size[1])) |
|
# 合并左右两部分图像 |
|
result_image = Image.new( |
|
'RGB', (left_image.size[0] + right_image.size[0], left_image.size[1])) |
|
result_image.paste(left_image, (0, 0)) |
|
result_image.paste(right_image, (left_image.size[0], 0)) |
|
# 添加滑动线条 |
|
draw = ImageDraw.Draw(result_image) |
|
draw.line([(left_image.size[0], 0), (left_image.size[0], |
|
left_image.size[1])], fill=(0, 255, 255), width=3) |
|
elif orient == 'vertical': |
|
# 将图像分为上下两部分 |
|
top_image = out_img.crop((0, 0, out_img.size[0], pos)) |
|
bottom_image = in_img.crop((0, pos, in_img.size[0], in_img.size[1])) |
|
# 合并上下两部分图像 |
|
result_image = Image.new( |
|
'RGB', (top_image.size[0], top_image.size[1] + bottom_image.size[1])) |
|
result_image.paste(top_image, (0, 0)) |
|
result_image.paste(bottom_image, (0, top_image.size[1])) |
|
# 添加滑动线条 |
|
draw = ImageDraw.Draw(result_image) |
|
draw.line([(0, top_image.size[1]), (top_image.size[0], |
|
top_image.size[1])], fill=(0, 255, 255), width=3) |
|
return result_image |
|
def main(img_in_path, img_out_path, span=100, save=False, orient='horizontal', loop=0, duration=100, repeat_delay=500, save_name="output"): |
|
""" |
|
主函数 |
|
参数: |
|
img_in_path (str): 起始图片路径 |
|
img_out_path (str): 目标图片路径 |
|
span (int): 分割步长,默认为100 |
|
save (bool): 是否保存中间帧图像,默认为False |
|
orient (str): 合并方向,默认水平 |
|
loop (int): 循环次数,默认为0(无限循环) |
|
duration (int): 帧持续时间(毫秒),默认为100 |
|
repeat_delay (int): 循环之间的延迟时间(毫秒),默认为500 |
|
save_name (str): 保存动画的文件名,默认为"output" |
|
""" |
|
# 读取原始图像 |
|
img_in = Image.open(img_in_path).convert("RGB") |
|
img_out = Image.open(img_out_path).convert("RGB") |
|
assert img_in.size == img_out.size, "Unequal size of two input images" |
|
if save: |
|
output_dir = 'output' |
|
os.makedirs(output_dir, exist_ok=True) |
|
frames = [] |
|
frames.append(img_in) |
|
span_end = img_in.size[0] if orient == 'horizontal' else img_in.size[1] |
|
# 逐张生成gif图片每一帧 |
|
for pos in range(span, span_end, span): |
|
print(pos) |
|
result_image = merge_image(img_in, img_out, pos, orient) |
|
if save: |
|
result_image.save(f"output/{pos:04}.jpg") |
|
frames.append(result_image) |
|
if save: |
|
img_in.save("output/0000.jpg") |
|
img_out.save(f"output/{img_in.size[0]:04}.jpg") |
|
# 添加过渡效果 |
|
durations = [duration]*len(frames) |
|
durations.append(repeat_delay) |
|
frames.append(img_out) |
|
# 生成动图 |
|
# frames[0].save:表示将frames列表中的第一张图片作为输出GIF动画的第一帧 |
|
# '{save_name}.gif':表示将输出的GIF动画保存在当前目录下并命名为{save_name}.gif |
|
# format='GIF':表示输出的文件格式为GIF格式 |
|
# append_images=frames[1:]:表示将frames列表中除了第一张图片以外的剩余图片作为输出GIF动画的后续帧 |
|
# save_all=True:表示将所有的帧都保存到输出的GIF动画中 |
|
# duration:表示每一帧的持续时间duration,可以是数值也可以是列表。如果是列表则单独表示每一帧的时间 |
|
# loop=0:表示循环播放次数为0,即无限循环播放 |
|
# optimize=True:表示优化图片生成 |
|
frames[0].save(f'{save_name}.gif', format='GIF', append_images=frames[1:], |
|
save_all=True, duration=durations, loop=loop, optimize=True) |
|
if __name__ == "__main__": |
|
# 起始图片路径 |
|
img_in_path = 'in.jpg' |
|
# 目标图片路径 |
|
img_out_path = 'out.jpg' |
|
# 调用 main 函数,并传入相应的参数 |
|
main( |
|
img_in_path, # 起始图片路径 |
|
img_out_path, # 目标图片路径 |
|
save=True, # 是否保存中间结果 |
|
span=150, # 分割步长,默认为 150 |
|
orient='horizontal', # 合并方向,默认为水平(可选值为 'horizontal' 或 'vertical') |
|
duration=500, # 帧持续时间(毫秒),默认为500 |
|
save_name="output", # 保存动画的文件名,默认为 "output" |
|
repeat_delay=2000 # 循环之间的延迟时间(毫秒)默认为 500 |
|
) |
上述代码演示了一种直接生成动图的方法。此外,还可以通过读取磁盘中的图片集合来生成动图。以下是示例代码,用于读取之前保存的中间图片并生成动图:
from PIL import Image |
|
import os |
|
# 图片文件夹路径 |
|
image_folder = 'output' |
|
# 保存的动图路径及文件名 |
|
animated_gif_path = 'output.gif' |
|
# 获取图片文件列表 |
|
image_files = [f for f in os.listdir(image_folder) if f.endswith('.jpg') or f.endswith('.png')] |
|
image_files.sort() |
|
# 创建图片帧列表 |
|
frames = [] |
|
for file_name in image_files: |
|
image_path = os.path.join(image_folder, file_name) |
|
img = Image.open(image_path) |
|
frames.append(img) |
|
# 保存为动图 |
|
frames[0].save(animated_gif_path, format='GIF', append_images=frames[1:], save_all=True, duration=200, loop=0) |


![[NCTF 2018]flask真香](https://img-blog.csdnimg.cn/direct/c5a1e7647f10487d91d87f7866110a94.png)