Title
题目
Latent Correlation Representation Learning for Brain Tumor Segmentation With Missing MRI Modalities
《缺失MRI模态下的脑肿瘤分割的潜在相关表示学习》
01
文献速递介绍
脑肿瘤是世界上最具侵略性的癌症之一,脑肿瘤的早期诊断在临床评估和治疗规划中起着重要作用。
手稿于2020年4月7日收到,分别于2020年9月2日和2021年2月8日修订,于2021年3月30日接受。出版日期为2021年4月8日;当前版本日期为2021年4月14日。本工作部分得到欧洲联盟的支持,资助来自欧洲区域发展基金(ERDF),项目编号为18P03390/18E01750/18P02733;部分资助来自M2SINUM项目,由上诺曼底地区议会提供;部分资助来自中国国家留学基金委员会(CSC)。负责审核和批准本手稿发表的副编辑是刘佳颖教授。(通讯作者:苏软)
周同学隶属于法国鲁昂INSA的LITIS-Apprentissage,邮编76800,也隶属于鲁昂大学的LITIS-QuantIF,邮编76183,法国(电子邮件:tongxue.zhou@insa-rouen.fr)。
Stéphane Canu就职于法国鲁昂INSA的LITIS实验室,隶属于上诺曼底大学,法国鲁昂,哈佛大学,哈佛大学港口,邮编76183(电子邮件:stephane.canu@insa-rouen.fr)。
皮埃尔·韦拉就职于法国鲁昂的亨利·贝克雷尔癌症中心核医学科,邮编76038,也隶属于鲁昂大学的LITIS QuantIF,邮编76183,法国(电子邮件:pierre.vera@chb.unicancer.fr)。
苏软就职于法国鲁昂大学的LITIS-QuantIF,邮编76183,法国(电子邮件:su.ruan@univ-rouen.fr)。
数字对象标识符为10.1109/TIP.2021.3070752。
脑肿瘤的早期诊断对于临床评估和治疗规划至关重要。核磁共振成像(MRI)是一种广泛使用的成像技术,用于评估脑肿瘤,因为它提供了良好的软组织对比度而无需辐射。常用的序列包括T1加权、增强T1加权(T1c)、T2加权和液体衰减反转恢复(FLAIR)图像。不同的序列可以提供互补信息,用于分析胶质瘤的不同亚区。例如,T2和FLAIR突出了具有肿瘤周围水肿的肿瘤,被称为整个肿瘤。T1和T1c突出了没有肿瘤周围水肿的肿瘤核心,被称为肿瘤核心。在T1c中还可以观察到肿瘤核心的增强区域,具有高信号强度,被称为增强肿瘤核心。在这项工作中,我们将不同序列的这些图像称为模态。因此,应用多模态图像可以减少信息不确定性,并提高临床诊断和分割准确性。图1展示了四种MRI模态和相关的地面真实情况,我们可以看到FLAIR可以提供关于整个肿瘤的重要信息,而T1c可以提供关于肿瘤核心的更多信息(包括增强肿瘤和Net&Ncr区域)。
Abstract
摘要
Magnetic Resonance Imaging (MRI) is a widely used imaging technique to assess brain tumor. Accurately seg*menting brain tumor from MR images is the key to clinicaldiagnostics and treatment planning. In addition, multi-modalMR images can provide complementary information for accuratebrain tumor segmentation. However, it’s common to miss someimaging modalities in clinical practice. In this paper, we present anovel brain tumor segmentation algorithm with missing modalities. Since it exists a strong correlation between multi-modalities,a correlation model is proposed to specially represent the latent**multi-source correlation. Thanks to the obtained correlationrepresentation, the segmentation becomes more robust in thecase of missing modality. First, the individual representation**produced by each encoder is used to estimate the modalityindependent parameter. Then, the correlation model transformsall the individual representations to the latent multi-source cor**relation representations. Finally, the correlation representationsacross modalities are fused via attention mechanism into a sharedrepresentation to emphasize the most important features forsegmentation. We evaluate our model on BraTS 2018 and BraTS2019 dataset, it outperforms the current state-of-the-art methodsand produces robust results when one or more modalities aremissing.
核磁共振成像(MRI)是一种广泛使用的成像技术,用于评估脑肿瘤。准确地从MR图像中分割脑肿瘤是临床诊断和治疗规划的关键。此外,多模态MR图像可以提供互补信息,以实现准确的脑肿瘤分割。然而,在临床实践中通常会缺少一些成像模态。在本文中,我们提出了一种新颖的具有缺失模态的脑肿瘤分割算法。由于多模态之间存在强相关性,因此提出了一个相关模型,专门用于表示潜在的多源相关性。由于获得了相关表示,因此在缺失模态的情况下,分割结果变得更加鲁棒。首先,每个编码器产生的个体表示用于估计模态无关参数。然后,相关模型将所有个体表示转换为潜在的多源相关表示。最后,通过注意机制将跨模态的相关表示融合成共享表示,以强调分割所需的最重要特征。我们在BraTS 2018和BraTS 2019数据集上评估了我们的模型,它优于当前的最先进方法,并且在一个或多个模态缺失时产生稳健的结果。
Method
方法
Our network is based on the U-Net architecture ,in which we integrate our fusion strategy and correlationmodel. To be robust to the absence of modalities, we adaptit to multi-encoder based framework. It first takes 3D available modalities as inputs in each encoder. The independentencoders can not only learn modality-specific feature representation, but also can avoid the false-adaptation betweenmodalities. To take into account the strong correlation betweenmulti modalities, we propose a correlation model, namedCM, to discover the correlation between modalities. Thenthe correlation representations across modalities are fusedvia attention mechanism, named Fusion, to emphasize themost discriminative representation for segmentation. Finally,the fused latent representation is decoded to form the final segmentation result. The network architecture scheme is depictedin Fig.
2.我们的网络基于U-Net架构,在其中我们集成了我们的融合策略和相关模型。为了使网络对模态缺失具有鲁棒性,我们将其调整为基于多编码器的框架。每个编码器首先将3D可用模态作为输入。独立的编码器不仅可以学习特定于模态的特征表示,还可以避免模态之间的误适应。为了考虑多模态之间的强相关性,我们提出了一个称为CM的相关模型来发现模态之间的相关性。然后,通过注意机制将跨模态的相关表示进行融合,称为融合,以强调分割的最具判别性的表示。最后,融合的潜在表示被解码以形成最终的分割结果。网络架构示意图如图2所示。
Conclusion
结论
In this paper, we have presented a novel brain tumor segmentation network to deal with the absence of imaging modalities. To the best of our knowledge, this is the first segmentationmethod which is capable of describing the latent multi-sourcecorrelation representation between modalities and allows tohelp segmentation on missing modalities. Since most currentsegmentation networks are single-encoder based and thus can’ttake advantage of the correlated information available betweendifferent modalities. To this end, we designed a multi-encoderbased segmentation network composed of four parts: encoder,correlation model, fusion block and decoder. The encoders aredesigned to obtain the individual feature representations fromthe input images, to learn the contributions of the obtainedfeature representations for the segmentation, we propose afusion block based on attention mechanism, which allows toselectively emphasize feature representations along channelattention and spatial attention. In addition, the proposedcorrelation model is used to discover the latent correlationsbetween the feature representations of the four modalities,which making the segmentation robust when the modalitiesare gradually missing. We carried out extensive experimentsto evaluate our proposed method. The quantitative andqualitative analysis on BraTS 2018 and BraTS 2019 datasetdemonstrate the effectiveness of our proposed method.To analyze the impact of the proposed components ofour network, several ablation experiments are implementedwith regard to the fusion block, reconstruction decoder, andcorrelation model. The comparison results demonstrate theproposed strategies can aid the network gradually refine thesegmentation results until to achieve the best results. We alsocompared our method with the state-of-the-art approacheson full and missing modalities on BraTS 2018 and BraTS2019 dataset. Although we didn’t surpass the best method onfull modalities, while our results are still competitive for thesegmentation. Since this work is presented to cope with thesegmentation on missing modalities, and both the quantitativeand qualitative results have demonstrated that our method canachieve a better result compared to the state-of-the-art methodwhen the modalities are gradually missing.In the future, we would like to investigate more complexmodel to describe the multi-source correlation representationand adapt it to missing data issue.
在本文中,我们提出了一种新颖的脑肿瘤分割网络,以应对成像模态缺失的情况。据我们所知,这是第一种能够描述模态之间潜在多源相关性表示的分割方法,并允许在缺失模态上帮助分割的方法。由于大多数当前的分割网络都是基于单编码器的,因此无法利用不同模态之间可用的相关信息。为此,我们设计了一个基于多编码器的分割网络,由四个部分组成:编码器、相关模型、融合块和解码器。编码器被设计用于从输入图像中获取个体特征表示,为了学习获得的特征表示对分割的贡献,我们提出了一个基于注意力机制的融合块,它可以通过通道注意力和空间注意力选择性地强调特征表示。此外,提出的相关模型用于发现四种模态的特征表示之间的潜在相关性,从而使得在模态逐渐缺失时分割更加稳健。我们进行了大量实验来评估我们提出的方法。在BraTS 2018和BraTS 2019数据集上的定量和定性分析证明了我们提出的方法的有效性。为了分析我们网络的提出组件的影响,针对融合块、重建解码器和相关模型进行了几种消融实验。比较结果表明,提出的策略可以帮助网络逐渐优化分割结果,直到达到最佳结果。我们还将我们的方法与BraTS 2018和BraTS 2019数据集上完整和缺失模态的最新方法进行了比较。尽管我们没有超越完整模态上的最佳方法,但我们的结果仍然在分割方面具有竞争力。由于本工作旨在应对缺失模态上的分割,并且定量和定性结果都表明,与当模态逐渐缺失时,我们的方法相比,可以达到更好的结果。
在未来,我们希望研究更复杂的模型来描述多源相关性表示,并将其适应于缺失数据问题。
Figure
图
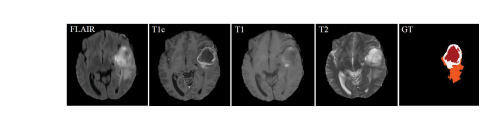
Fig. 1. Example of data from a training subject. The first four imagesfrom left to right show the MRI modalities: Fluid attenuation inversionrecovery (FLAIR), contrast enhanced T1-weighted (T1c), T1-weighted (T1),T2-weighted (T2) images, and the fifth image is the ground truth labels,Net&Ncr is shown in red, edema in orange and enhancing tumor in white,Net refers non-enhancing tumor and Ncr necrotic tumor.
图1. 训练对象数据示例。从左到右的前四幅图像显示了MRI模态:液体衰减反转恢复(FLAIR)、增强T1加权(T1c)、T1加权(T1)、T2加权(T2)图像,第五幅图像是地面真实标签,Net&Ncr以红色显示,水肿以橙色显示,增强肿瘤以白色显示,Net代表非增强肿瘤,Ncr代表坏死性肿瘤。
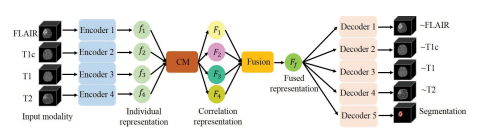
Fig. 2. A schematic overview of our network. Each input modality is encodedby individual encoder to obtain the individual representation. The proposedcorrelation model (CM) and fusion block (Fusion) project the individualrepresentations into a fused representation, which is finally decoded to formthe reconstruction modalities and the segmentation result. Full details of eachcomponent are given in the main text.
图2. 我们网络的示意概览。每个输入模态都由独立的编码器编码,以获得个体表示。提出的相关模型(CM)和融合模块(Fusion)将个体表示投影到一个融合表示中,最终解码以形成重建模态和分割结果。每个组件的详细信息在正文中给出。
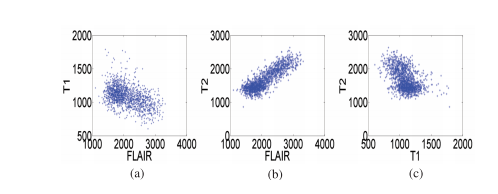
Fig. 3. Joint intensity distribution of MR images: (a) FLAIR-T1, (b) FLAIR T2 and (c) T1-T2.
图3. MR图像的联合强度分布:(a) FLAIR-T1,(b) FLAIR-T2,(c) T1-T2。
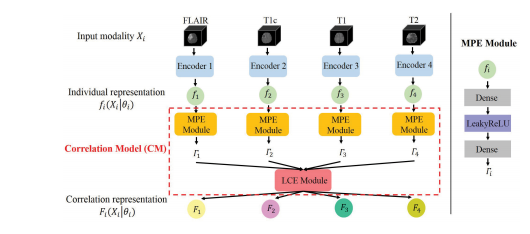
Fig. 4. Architecture of correlation model. MPE Module first maps the indi vidual representation fi(Xi|θi) to a set of independent parameters i , underthese parameters, LCE Module transforms all the individual representationsto form a latent multi-source correlation representation Fi(Xi|θi).
Fig. 4. 相关模型的架构。MPE模块首先将个体表示 fi(Xi|θi) 映射到一组独立参数 θi ,在这些参数下,LCE模块将所有个体表示转换为形成潜在的多源相关表示 Fi(Xi|θi)。
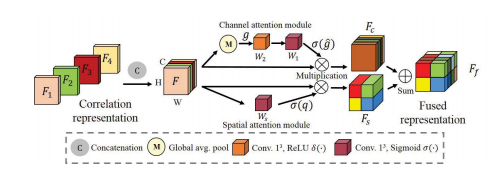
Fig. 5. The architecture of fusion block. The correlation representations(F1, F2, F3, F4) are first concatenated as the input of the attentionmechanism F. Then, they are recalibrated along channel attention and spatialattention modules to achieve the F**c and Fs. Finally, they are added to obtainthe fused representation Ff .
Fig. 5. 融合模块的架构。首先将相关表示(F1,F2,F3,F4)连接作为注意机制 F 的输入。然后,它们通过通道注意力和空间注意力模块进行重新校准,以获得 Fc 和 Fs。最后,它们相加以获得融合表示 F**f。
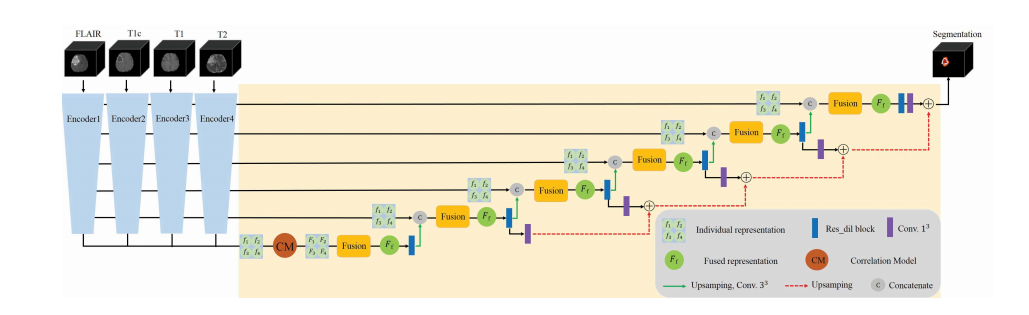
Fig. 6. Proposed segmentation network framework. Each imaging modality (FLAIR, T1, T1c, T2) is first encoded by individual encoder to obtain themodality-specific representation ( f1, f2, f3, f4). Then these individual representations are transformed by CM to form the dependent representation (F1, F2,F*3, F4), which are integrated by the following fusion block. Finally, the fused latent representation F**f is decoded to form the final segmentation. Here onlyfour encoders and the target segmentation decoder are shown.
g. 6. 提出的分割网络框架。每个成像模态(FLAIR、T1、T1c、T2)首先由独立编码器编码,以获得模态特定表示(f1、f2、f3、f4)。然后,这些个体表示通过CM进行转换,形成依赖表示(F1、F2、F3、F4),然后通过下面的融合块进行整合。最后,融合的潜在表示 Ff 被解码以形成最终的分割。这里仅显示了四个编码器和目标分割解码器。
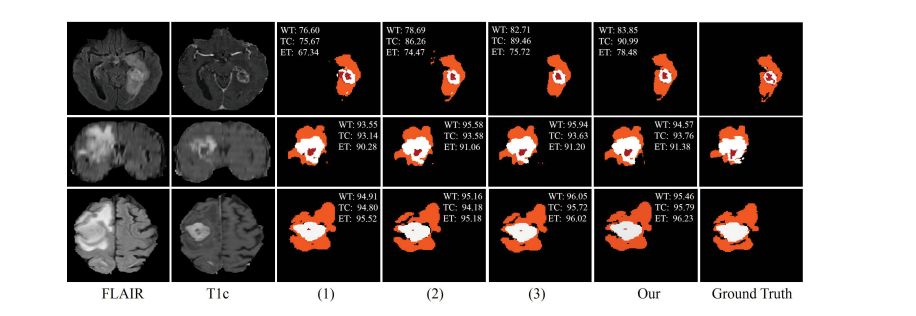
Fig. 7. Examples of the segmentation results on full modalities on BraTS 2018 dataset. (1) denotes the baseline, (2) denotes the baseline with fusion block,(3) denotes our method without CM. Red: necrotic and non-enhancing tumor core; Orange: edema; White: enhancing tumor.
图7。在BraTS 2018数据集上展示完整模态的分割结果示例。(1) 表示基线,(2) 表示具有融合块的基线,(3) 表示我们的方法没有使用CM。红色:坏死和非增强肿瘤核心;橙色:水肿;白色:增强肿瘤。
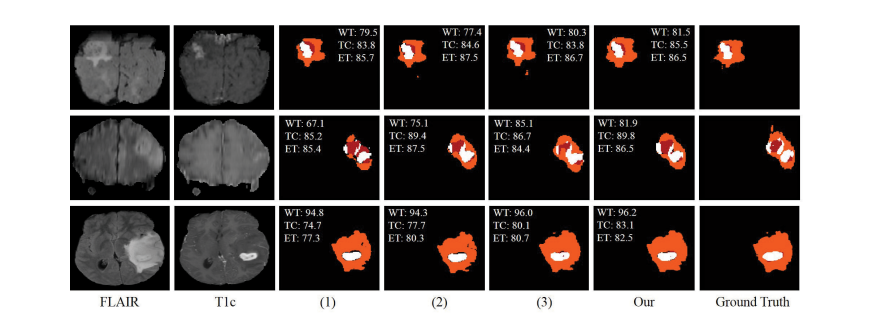
Fig. 8. Examples of the segmentation results on full modalities on BraTS 2019 dataset. (1) denotes the baseline, (2) denotes the baseline with fusion block,(3) denotes our method without CM. Red: necrotic and non-enhancing tumor core; Orange: edema; White: enhancing tumor.
图8。在BraTS 2019数据集上展示完整模态的分割结果示例。(1) 表示基线,(2) 表示具有融合块的基线,(3) 表示我们的方法没有使用CM。红色:坏死和非增强肿瘤核心;橙色:水肿;白色:增强肿瘤。
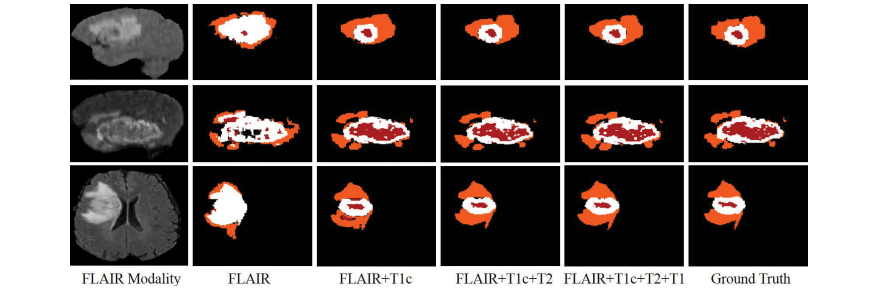
Fig. 9. Examples of the segmentation results on missing modalities. Red: necrotic and non-enhancing tumor core; Orange: edema; White: enhancing tumor.
图9。缺失模态的分割结果示例。红色:坏死和非增强肿瘤核心;橙色:水肿;白色:增强肿瘤。
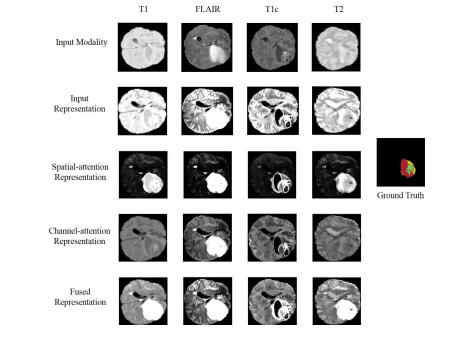
Fig. 10. Visualization of feature maps of the attention based fusionblock. Red: necrotic and non-enhancing tumor core; Yellow: edema; Green:enhancing tumor.
图10。基于注意力的融合块特征图的可视化。红色:坏死和非增强肿瘤核心;黄色:水肿;绿色:增强肿瘤。
Table
表

TABLE I ievaluation of our proposed method on brats 2018 training set, ↑ denotes the improvement compared to the previous method, bold results show the best scores for each tumor region
表 I 我们提出的方法在 BRATS 2018 训练集上的评估,↑ 表示与之前方法相比的改进,粗体结果显示每个肿瘤区域的最佳得分
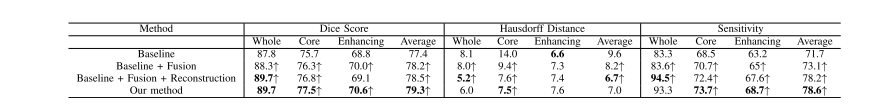
TABLE II evaluation of our proposed method on brats 2019 training set, ↑ denotes the improvement compared to the previous method, bold results show the best scores for each tumor region
表 II 我们提出的方法在 BRATS 2019 训练集上的评估,↑ 表示与之前方法相比的改进,粗体结果显示每个肿瘤区域的最佳得分
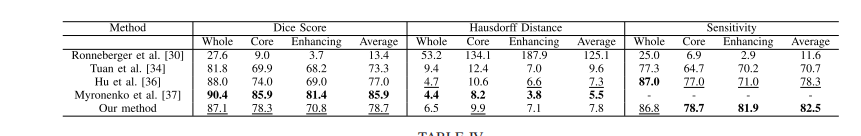
TABLE III comparison of different methods on brats 2018 validation set, fields with (−) are not mentioned in the published work, bold results show the best scores for each tumor region, and underline results refer the second best results
表 III 不同方法在 BRATS 2018 验证集上的比较,带有 (−) 的字段在已发表的工作中未提及,粗体结果显示每个肿瘤区域的最佳得分,而下划线结果指的是第二好的结果
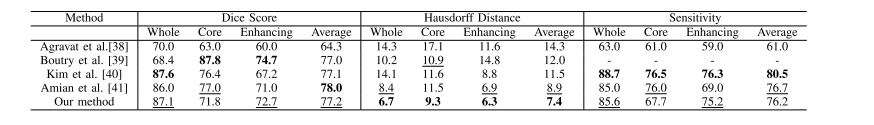
TABLE IV comparison of different methods on brats 2019 validation set, fields with (−) are not mentioned in the published work, bold results show the best scores for each tumor region, and underline results refer the second best results
表 IV 不同方法在 BRATS 2019 验证集上的比较,带有 (−) 的字段在已发表的工作中未提及,粗体结果显示每个肿瘤区域的最佳得分,而下划线结果指的是第二好的结果
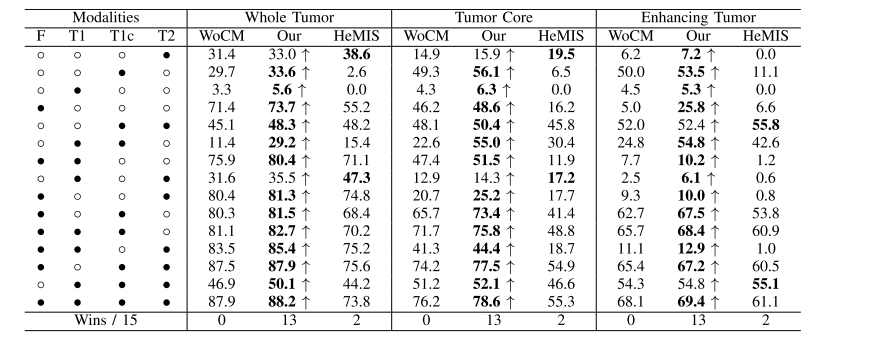
TABLE Vrobust comparison of different methods (dice %) for different combinations of available modalities on brats 2018 dataset,◦ denotes the missing modality and • denotes the present modality, ↑ denotes the improvement of cm, wocm denotes our method without cm, our denotes our method with cm, bold results denotes the best score
表V 对BRATS 2018数据集上不同可用模态的不同组合进行了不同方法(Dice %)的稳健比较,◦表示缺失的模态,•表示存在的模态,↑表示CM的改进,WOCM表示我们的方法没有CM,OUR表示我们的方法使用了CM,粗体结果表示最佳得分。
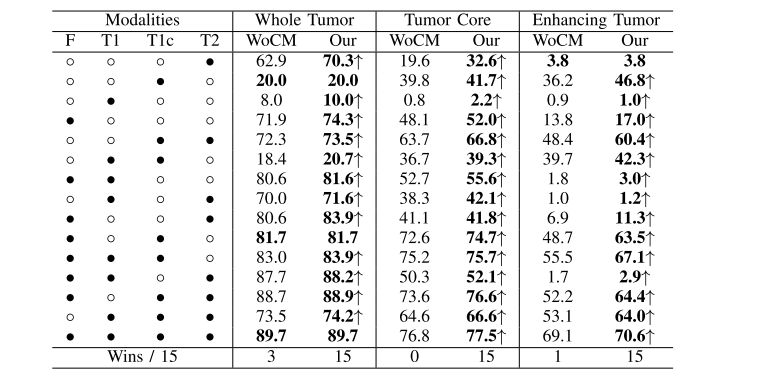
TABLE VI robust comparison of different methods (dice %) for different combinations of available modalities on brats 2019 dataset, ◦denotes the missing modality and • denotes the present modality, ↑ denotes the improvement of cm, wocm denotes our method without cm, our denotes our method with cm, bold results denotes the best score
表VI 在BRATS 2019数据集上,对不同可用模态的不同组合进行了不同方法(Dice %)的稳健比较,◦表示缺失的模态,•表示存在的模态,↑表示CM的改进,WOCM表示我们的方法没有CM,OUR表示我们的方法使用了CM,粗体结果表示最佳得分。


![流批一体计算引擎-10-[Flink]中的常用算子和DataStream转换](https://img-blog.csdnimg.cn/direct/e19bf7a04ac149f9a8ffb6aeb5472fc2.png)