[matlab]折线图之多条折线如何绘制实心圆作为标记点

使用MarkerFaceColor是标记点填充的颜色,b,表示blue,蓝色

plot(x, a, 'd--', 'MarkerFaceColor', 'b'); % 绘制仿真结果的曲线

如果一张图多条曲线那么每条曲线需要单独调用一次plot,每个plot间用hold on 连接

plot(x, a, 'd--', 'MarkerFaceColor', 'b'); % 绘制仿真结果的曲线
hold on; % 保持图形打开状态
plot(x, b, '-or','MarkerFaceColor', 'r'); % 绘制实验结果的曲线
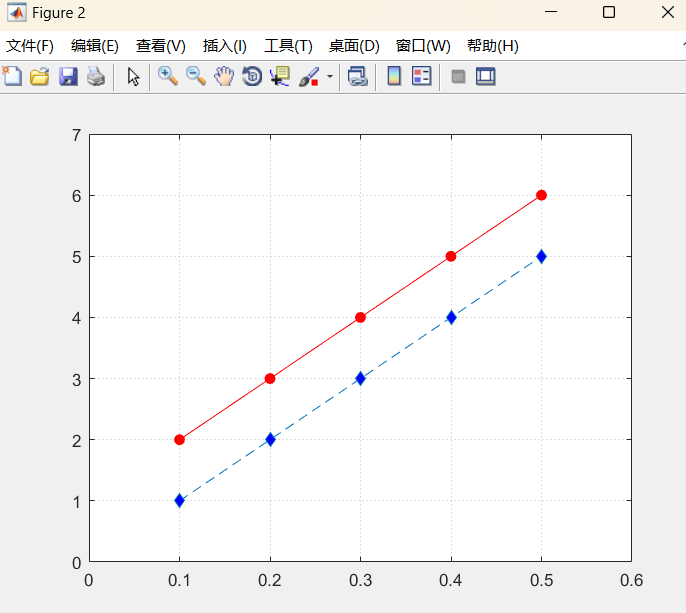
下面举一个具体例子:

x = 0.1:0.1:0.5;
 y1=[1,2,3,4,5]; 
 y2=[2,3,4,5,6]; 
 figure;
plot(x, y1, 'd--', 'MarkerFaceColor', 'b'); 
hold on; % 保持图形打开状态
plot(x, y2, '-or','MarkerFaceColor', 'r'); 
axis([0,0.6,0,7])  %确定x轴与y轴框图大小
grid on;  %开启网格线
set(gca, 'GridLineStyle', ':','LineWidth',0.5,'GridAlpha',0.3);  % 设置网格线参数、类别、宽度
box on;  %图像边框开启

image.png

相关推荐

最近更新

  1. TCP协议是安全的吗?

    2024-06-07 17:46:03       18 阅读
  2. 阿里云服务器执行yum,一直下载docker-ce-stable失败

    2024-06-07 17:46:03       19 阅读
  3. 【Python教程】压缩PDF文件大小

    2024-06-07 17:46:03       18 阅读
  4. 通过文章id递归查询所有评论(xml)

    2024-06-07 17:46:03       20 阅读

热门阅读

  1. 一起学习 ABP (1) 项目入口

    2024-06-07 17:46:03       8 阅读
  2. Go基础编程 - 04 - 基本类型、常量和变量

    2024-06-07 17:46:03       9 阅读
  3. SpringBoot整合AES+RSA加密(含前端代码)

    2024-06-07 17:46:03       9 阅读
  4. Python AI相关库介绍及使用指南

    2024-06-07 17:46:03       9 阅读
  5. Spring Boot(七十八):实现API 多版本控制

    2024-06-07 17:46:03       10 阅读
  6. CentOS Stream release 9安装docker

    2024-06-07 17:46:03       7 阅读
  7. 什么是RPA自动化办公?

    2024-06-07 17:46:03       7 阅读