1.对CPU的监控函数
function GetCpu(){
        cpu_num=`grep -c "model name" /proc/cpuinfo`
        cpu_user=`top -b -n 1 | grep Cpu | awk '{print $2}' | cut -f 1 -d "%"`
        cpu_system=`top -b -n 1 | grep Cpu | awk '{print $4}' | cut -f 1 -d "%"`
        cpu_idle=`top -b -n 1 | grep Cpu | awk '{print $8}' | cut -f 1 -d "%"`
        cpu_iowait=`top -b -n 1 | grep Cpu | awk '{print $10}' | cut -f 1 -d "%"`
        cpu_interrupt=`vmstat -n 1 1 | sed -n 3p | awk '{print $11}'`
        cpu_context_switch=`vmstat -n 1 1 | sed -n 3p | awk '{print $12}'`
        cpu_load_15min=`uptime | awk '{print $12}' | cut -f 1 -d ','`
        cpu_load_5min=`uptime | awk '{print $11}' | cut -f 1 -d ','`
        cpu_load_1min=`uptime | awk '{print $10}' | cut -f 1 -d ','`
        color "cpu总核数:" "$cpu_num"
        color "用户空间占用CPU百分比:" "$cpu_user"
        color "内核空间占用CPU百分比:" "$cpu_system"
        color "空闲CPU百分比:" "$cpu_idle"
        color "等待输入输出占CPU百分比:" "$cpu_iowait"
        color "CPU中断次数:" "$cpu_interrupt"
        color "CPU上下文切换次数:" "$cpu_context_switch"
        color "CPU 15分钟前到现在的负载平均值:" "$cpu_load_15min"
        color "CPU 5分钟前到现在的负载平均值:" "$cpu_load_5min"
        color "CPU 1分钟前到现在的负载平均值:" "$cpu_load_1min"
}
2.对内存的监控函数
function GetMem(){
        mem_total=`free | grep Mem | awk '{print $2}'`
        mem_sys_used=`free | grep Mem | awk '{print $3}'`
        mem_sys_free=`free | grep Mem | awk '{print $4}'`
        mem_user_used=`free | sed -n 3p | awk '{print $3}'`
        mem_user_free=`free | sed -n 3p | awk '{print $4}'`
        mem_swap_total=`free | grep Swap | awk '{print $2}'`
        mem_swap_used=`free | grep Swap | awk '{print $3}'`
        mem_swap_free=`free | grep Swap | awk '{print $4}'`
        color "物理内存总量:" "$mem_total"
        color "已使用内存总量(操作系统):" "$mem_sys_used"
        color "剩余内存总量(操作系统):" "$mem_sys_free"
        color "已使用内存总量(应用程序):" "$mem_user_used"
        color "剩余内存总量(应用程序):" "$mem_user_free"
        color "交换分区总大小:" "$mem_swap_total"
        color "已使用交换分区大小:" "$mem_swap_used"
        color "剩余交换分区大小:" "$mem_swap_free"
}
3.对磁盘IO的监控函数
function GetDiskIo(){
        disk=sda
        read -p "请输入指定磁盘:(eg:sda)" input_disk
        if [ -z "$input_disk" ]; then
                echo "用户未输入,使用默认值 $disk"
                input_disk="$disk"  # 由于未赋值,这里相当于保持默认
        else
                echo "用户输入的disk路径: $input_disk"
        fi
        echo "指定设备($input_disk)的统计信息"
        disk_sda_rs=`iostat -kx | grep $input_disk| awk '{print $4}'`
        disk_sda_ws=`iostat -kx | grep $input_disk| awk '{print $5}'`
        disk_sda_avgqu_sz=`iostat -kx | grep $input_disk| awk '{print $9}'`
        disk_sda_await=`iostat -kx | grep $input_disk| awk '{print $10}'`
        disk_sda_svctm=`iostat -kx | grep $input_disk| awk '{print $11}'`
        disk_sda_util=`iostat -kx | grep $input_disk| awk '{print $12}'`
        color "每秒向设备发起的读请求次数:" "$disk_sda_rs"
        color "每秒向设备发起的写请求次数:" "$disk_sda_ws"
        color "向设备发起的I/O请求队列长度平均值:" "$disk_sda_avgqu_sz"
        color "每次向设备发起的I/O请求平均时间:" "$disk_sda_await"
        color "向设备发起的I/O服务时间均值:" "$disk_sda_svctm"
        color "向设备发起I/O请求的CPU时间百分占比:" "$disk_sda_util"
}
4.对线程状态的监控函数
function GetPidstat(){
        #初始化变量
        Ptotal=0
        Rtotal=0
        Stotal=0
        Ttotal=0
        Dtotal=0
        Ztotal=0
        for pid in /proc/[1-9]*
        do
                #获取进程状态
                let Ptotal=Ptotal+1
                stat=$(cd $pid && cat stat| awk '{print $3}')
                case $stat in
                R)
                let Rtotal=Rtotal+1
                ;;
                S)
                let Stotal=Stotal+1
                ;;
                T)
                let Ttotal=Ttotal+1
                ;;
                D)
                let Dtotal=Dtotal+1
                ;;
                Z)
                let Ztotal=Ztotal+1
                ;;
                esac
        done
        color "当前进程总数为:" "$Ptotal"
        color "其中Running进程数为:" "$Rtotal"
        color "其中Sleeping进程数为:" "$Stotal"
        color "其中Stopped进程数为:" "$Ttotal"
        color "其中Disk sleep进程数为:" "$Dtotal"
        color "其中Zombies进程数为:" "$Ztotal"
}
5.对网卡流量的监控函数
function GetNet(){
        eth_name=`sar -n DEV 1 1|grep ens|awk 'NR==2{print $2}'`
        rxpck_num=`sar -n DEV 1 1|grep ens|awk 'NR==2{print $3}'`
        txpck_num=`sar -n DEV 1 1|grep ens|awk 'NR==2{print $4}'`
        rxkB_num=`sar -n DEV 1 1|grep ens|awk 'NR==2{print $5}'`
        txkB_num=`sar -n DEV 1 1|grep ens|awk 'NR==2{print $6}'`
        rxcmp_num=`sar -n DEV 1 1|grep ens|awk 'NR==2{print $7}'`
        txcmp_num=`sar -n DEV 1 1|grep ens|awk 'NR==2{print $8}'`
        rxmcst_num=`sar -n DEV 1 1|grep ens|awk 'NR==2{print $9}'`
        color "$eth_name每秒钟接收的数据包:" "$rxpck_num"
        color "$eth_name每秒钟发送的数据包:" "$txpck_num"
        color "$eth_name每秒钟接收的字节数:" "$rxkB_num"
        color "$eth_name每秒钟发送的字节数:" "$txkB_num"
        color "$eth_name每秒钟接收的压缩数据包:" "$rxcmp_num"
        color "$eth_name每秒钟发送的压缩数据包:" "$txcmp_num"
        color "$eth_name每秒钟接收的多播数据包:" "$rxmcst_num"
}
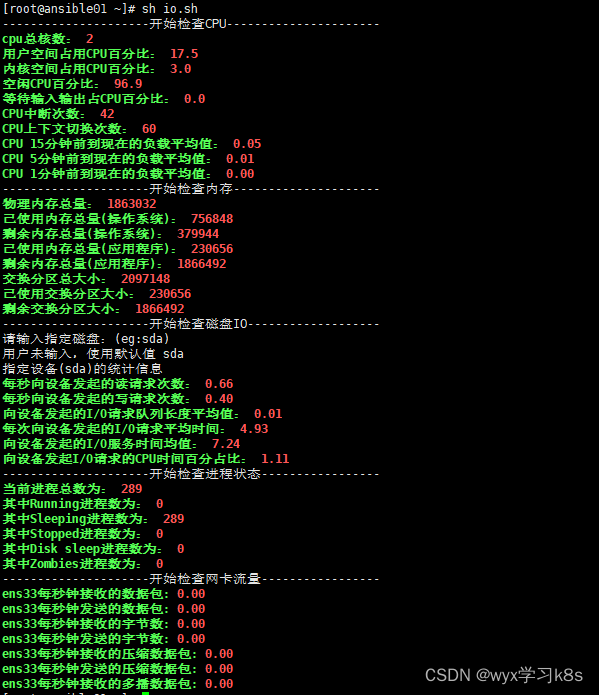
6.实现效果
#!/bin/bash
function color() {
        local a=$1
        local b=$2
        echo -e "\033[1;32m$a\033[0m \033[1;31m$b\033[0m"
}
function GetIp(){
        IP=`ifconfig | grep inet | grep -vE 'inet6|127.0.0.1' | awk '{print $2}'`
        echo "IP地址:"$IP
}
#检查CPU利用率
function GetCpu(){
        cpu_num=`grep -c "model name" /proc/cpuinfo`
        cpu_user=`top -b -n 1 | grep Cpu | awk '{print $2}' | cut -f 1 -d "%"`
        cpu_system=`top -b -n 1 | grep Cpu | awk '{print $4}' | cut -f 1 -d "%"`
        cpu_idle=`top -b -n 1 | grep Cpu | awk '{print $8}' | cut -f 1 -d "%"`
        cpu_iowait=`top -b -n 1 | grep Cpu | awk '{print $10}' | cut -f 1 -d "%"`
        cpu_interrupt=`vmstat -n 1 1 | sed -n 3p | awk '{print $11}'`
        cpu_context_switch=`vmstat -n 1 1 | sed -n 3p | awk '{print $12}'`
        cpu_load_15min=`uptime | awk '{print $12}' | cut -f 1 -d ','`
        cpu_load_5min=`uptime | awk '{print $11}' | cut -f 1 -d ','`
        cpu_load_1min=`uptime | awk '{print $10}' | cut -f 1 -d ','`
        color "cpu总核数:" "$cpu_num"
        color "用户空间占用CPU百分比:" "$cpu_user"
        color "内核空间占用CPU百分比:" "$cpu_system"
        color "空闲CPU百分比:" "$cpu_idle"
        color "等待输入输出占CPU百分比:" "$cpu_iowait"
        color "CPU中断次数:" "$cpu_interrupt"
        color "CPU上下文切换次数:" "$cpu_context_switch"
        color "CPU 15分钟前到现在的负载平均值:" "$cpu_load_15min"
        color "CPU 5分钟前到现在的负载平均值:" "$cpu_load_5min"
        color "CPU 1分钟前到现在的负载平均值:" "$cpu_load_1min"
}
#检查内存使用率
function GetMem(){
        mem_total=`free | grep Mem | awk '{print $2}'`
        mem_sys_used=`free | grep Mem | awk '{print $3}'`
        mem_sys_free=`free | grep Mem | awk '{print $4}'`
        mem_user_used=`free | sed -n 3p | awk '{print $3}'`
        mem_user_free=`free | sed -n 3p | awk '{print $4}'`
        mem_swap_total=`free | grep Swap | awk '{print $2}'`
        mem_swap_used=`free | grep Swap | awk '{print $3}'`
        mem_swap_free=`free | grep Swap | awk '{print $4}'`
        color "物理内存总量:" "$mem_total"
        color "已使用内存总量(操作系统):" "$mem_sys_used"
        color "剩余内存总量(操作系统):" "$mem_sys_free"
        color "已使用内存总量(应用程序):" "$mem_user_used"
        color "剩余内存总量(应用程序):" "$mem_user_free"
        color "交换分区总大小:" "$mem_swap_total"
        color "已使用交换分区大小:" "$mem_swap_used"
        color "剩余交换分区大小:" "$mem_swap_free"
}

#检查磁盘IO状态
function GetDiskIo(){
        disk=sda
        read -p "请输入指定磁盘:(eg:sda)" input_disk
        if [ -z "$input_disk" ]; then
                echo "用户未输入,使用默认值 $disk"
                input_disk="$disk"  # 由于未赋值,这里相当于保持默认
        else
                echo "用户输入的disk路径: $input_disk"
        fi
        echo "指定设备($input_disk)的统计信息"
        disk_sda_rs=`iostat -kx | grep $input_disk| awk '{print $4}'`
        disk_sda_ws=`iostat -kx | grep $input_disk| awk '{print $5}'`
        disk_sda_avgqu_sz=`iostat -kx | grep $input_disk| awk '{print $9}'`
        disk_sda_await=`iostat -kx | grep $input_disk| awk '{print $10}'`
        disk_sda_svctm=`iostat -kx | grep $input_disk| awk '{print $11}'`
        disk_sda_util=`iostat -kx | grep $input_disk| awk '{print $12}'`
        color "每秒向设备发起的读请求次数:" "$disk_sda_rs"
        color "每秒向设备发起的写请求次数:" "$disk_sda_ws"
        color "向设备发起的I/O请求队列长度平均值:" "$disk_sda_avgqu_sz"
        color "每次向设备发起的I/O请求平均时间:" "$disk_sda_await"
        color "向设备发起的I/O服务时间均值:" "$disk_sda_svctm"
        color "向设备发起I/O请求的CPU时间百分占比:" "$disk_sda_util"
}
function GetPidstat(){
        #初始化变量
        Ptotal=0
        Rtotal=0
        Stotal=0
        Ttotal=0
        Dtotal=0
        Ztotal=0
        for pid in /proc/[1-9]*
        do
                #获取进程状态
                let Ptotal=Ptotal+1
                stat=$(cd $pid && cat stat| awk '{print $3}')
                case $stat in
                R)
                let Rtotal=Rtotal+1
                ;;
                S)
                let Stotal=Stotal+1
                ;;
                T)
                let Ttotal=Ttotal+1
                ;;
                D)
                let Dtotal=Dtotal+1
                ;;
                Z)
                let Ztotal=Ztotal+1
                ;;
                esac
        done
        color "当前进程总数为:" "$Ptotal"
        color "其中Running进程数为:" "$Rtotal"
        color "其中Sleeping进程数为:" "$Stotal"
        color "其中Stopped进程数为:" "$Ttotal"
        color "其中Disk sleep进程数为:" "$Dtotal"
        color "其中Zombies进程数为:" "$Ztotal"
}
function GetNet(){
        eth_name=`sar -n DEV 1 1|grep ens|awk 'NR==2{print $2}'`
        rxpck_num=`sar -n DEV 1 1|grep ens|awk 'NR==2{print $3}'`
        txpck_num=`sar -n DEV 1 1|grep ens|awk 'NR==2{print $4}'`
        rxkB_num=`sar -n DEV 1 1|grep ens|awk 'NR==2{print $5}'`
        txkB_num=`sar -n DEV 1 1|grep ens|awk 'NR==2{print $6}'`
        rxcmp_num=`sar -n DEV 1 1|grep ens|awk 'NR==2{print $7}'`
        txcmp_num=`sar -n DEV 1 1|grep ens|awk 'NR==2{print $8}'`
        rxmcst_num=`sar -n DEV 1 1|grep ens|awk 'NR==2{print $9}'`
        color "$eth_name每秒钟接收的数据包:" "$rxpck_num"
        color "$eth_name每秒钟发送的数据包:" "$txpck_num"
        color "$eth_name每秒钟接收的字节数:" "$rxkB_num"
        color "$eth_name每秒钟发送的字节数:" "$txkB_num"
        color "$eth_name每秒钟接收的压缩数据包:" "$rxcmp_num"
        color "$eth_name每秒钟发送的压缩数据包:" "$txcmp_num"
        color "$eth_name每秒钟接收的多播数据包:" "$rxmcst_num"
}
echo "---------------------开始检查CPU----------------------"
GetCpu
echo "---------------------开始检查内存---------------------"
GetMem
echo "---------------------开始检查磁盘IO-------------------"
GetDiskIo
echo "---------------------开始检查进程状态-----------------"
GetPidstat
echo "---------------------开始检查网卡流量-----------------"
GetNet