一、引言
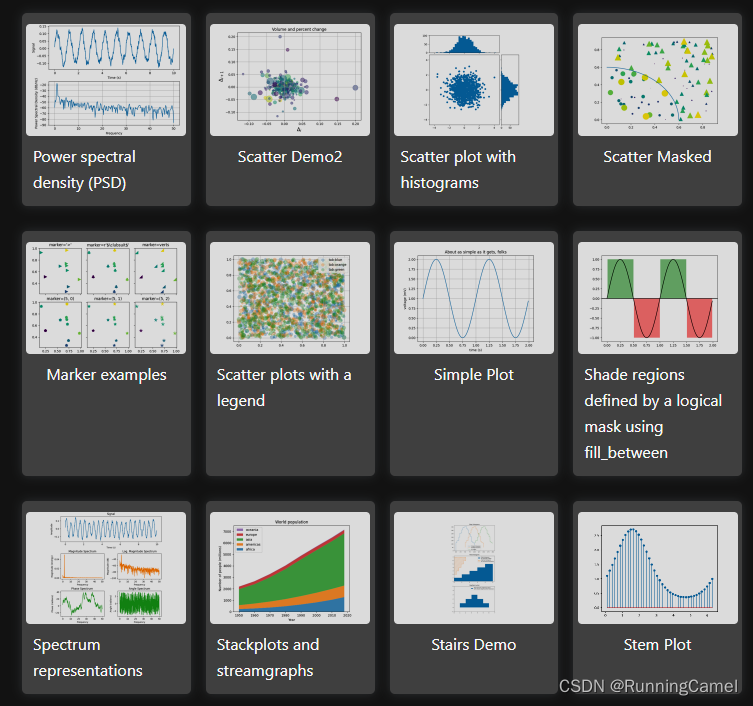
接着上一文章【数据可视化01】matplotlib实例介绍1继续介绍matplotlib的实例。
二、实例介绍
在matplotlib中,常用的图形类型包括:
- 箱线图(Box plot):用于展示连续变量的分布情况、异常值和离群点。
- 热力图(Heatmap):用于展示两个类别型变量之间的关系,通过颜色深浅来表示不同数值的大小。
- 3D图(3D plot):用于展示三维数据的分布情况,可以通过不同颜色或形状来表示不同数值或类别。
下面介绍集中常用的图形绘制方法。
1.箱线图
该图说明了如何创建两种类型的框图(矩形和缺口),以及如何通过访问框图的艺术家的属性来使用自定义颜色填充它们。此外,labels参数用于为每个样本提供x-tick标签。。
import matplotlib.pyplot as plt
import numpy as np

# Random test data
np.random.seed(19680801)
all_data = [np.random.normal(0, std, size=100) for std in range(1, 4)]
labels = ['x1', 'x2', 'x3']

fig, (ax1, ax2) = plt.subplots(nrows=1, ncols=2, figsize=(9, 4))

# rectangular box plot
bplot1 = ax1.boxplot(all_data,
                     vert=True,  # vertical box alignment
                     patch_artist=True,  # fill with color
                     labels=labels)  # will be used to label x-ticks
ax1.set_title('Rectangular box plot')

# notch shape box plot
bplot2 = ax2.boxplot(all_data,
                     notch=True,  # notch shape
                     vert=True,  # vertical box alignment
                     patch_artist=True,  # fill with color
                     labels=labels)  # will be used to label x-ticks
ax2.set_title('Notched box plot')

# fill with colors
colors = ['pink', 'lightblue', 'lightgreen']
for bplot in (bplot1, bplot2):
    for patch, color in zip(bplot['boxes'], colors):
        patch.set_facecolor(color)

# adding horizontal grid lines
for ax in [ax1, ax2]:
    ax.yaxis.grid(True)
    ax.set_xlabel('Three separate samples')
    ax.set_ylabel('Observed values')

plt.show()

2.热力图
通常需要将依赖于两个独立变量的数据显示为彩色编码图像图。这通常被称为热图。如果数据是分类的,则称为分类热图。Matplotlib的imshow函数使得生成这样的图特别容易。下面的示例展示了如何创建带有注释的热图。我们将从一个简单的示例开始,并将其扩展为可用的通用函数。
import matplotlib.pyplot as plt
import numpy as np

import matplotlib
import matplotlib as mpl


vegetables = ["cucumber", "tomato", "lettuce", "asparagus",
              "potato", "wheat", "barley"]
farmers = ["Farmer Joe", "Upland Bros.", "Smith Gardening",
           "Agrifun", "Organiculture", "BioGoods Ltd.", "Cornylee Corp."]

harvest = np.array([[0.8, 2.4, 2.5, 3.9, 0.0, 4.0, 0.0],
                    [2.4, 0.0, 4.0, 1.0, 2.7, 0.0, 0.0],
                    [1.1, 2.4, 0.8, 4.3, 1.9, 4.4, 0.0],
                    [0.6, 0.0, 0.3, 0.0, 3.1, 0.0, 0.0],
                    [0.7, 1.7, 0.6, 2.6, 2.2, 6.2, 0.0],
                    [1.3, 1.2, 0.0, 0.0, 0.0, 3.2, 5.1],
                    [0.1, 2.0, 0.0, 1.4, 0.0, 1.9, 6.3]])


fig, ax = plt.subplots()
im = ax.imshow(harvest)

# Show all ticks and label them with the respective list entries
ax.set_xticks(np.arange(len(farmers)), labels=farmers)
ax.set_yticks(np.arange(len(vegetables)), labels=vegetables)

# Rotate the tick labels and set their alignment.
plt.setp(ax.get_xticklabels(), rotation=45, ha="right",
         rotation_mode="anchor")

# Loop over data dimensions and create text annotations.
for i in range(len(vegetables)):
    for j in range(len(farmers)):
        text = ax.text(j, i, harvest[i, j],
                       ha="center", va="center", color="w")

ax.set_title("Harvest of local farmers (in tons/year)")
fig.tight_layout()
plt.show()

3.线条形式
演示一个基本的3D散点图。
import matplotlib.pyplot as plt
import numpy as np

# Fixing random state for reproducibility
np.random.seed(19680801)

def randrange(n, vmin, vmax):
    """
    Helper function to make an array of random numbers having shape (n, )
    with each number distributed Uniform(vmin, vmax).
    """
    return (vmax - vmin)*np.random.rand(n) + vmin

fig = plt.figure()
ax = fig.add_subplot(projection='3d')

n = 100

# For each set of style and range settings, plot n random points in the box
# defined by x in [23, 32], y in [0, 100], z in [zlow, zhigh].
for m, zlow, zhigh in [('o', -50, -25), ('^', -30, -5)]:
    xs = randrange(n, 23, 32)
    ys = randrange(n, 0, 100)
    zs = randrange(n, zlow, zhigh)
    ax.scatter(xs, ys, zs, marker=m)

ax.set_xlabel('X Label')
ax.set_ylabel('Y Label')
ax.set_zlabel('Z Label')

plt.show()

E N D ! \color{#4285f4}{\mathbf{E}}\color{#ea4335}{\mathbf{N}}\color{#fbbc05}{\mathbf{D}}\color{#4285f4}{\mathbf{!}} END!


![[机器学习-<span style='color:red;'>02</span>] <span style='color:red;'>数据</span><span style='color:red;'>可</span><span style='color:red;'>视</span><span style='color:red;'>化</span>神器:<span style='color:red;'>Matplotlib</span>和Seaborn工具包<span style='color:red;'>实战</span>图形大全](https://img-blog.csdnimg.cn/direct/c1b47828028642e59cb81b6df5f83aab.png)