<template>
<div
id="main"
style="width: 600px; height: 400px;"
></div>
</template>
<script>
import * as echarts from 'echarts';
export default {
mounted () {
this.init()
window.handleClick = this.formatter
},
methods: {
formatter () {
console.log(", ticket, callback:");
},
init () {
var chartDom = document.getElementById('main');
var myChart = echarts.init(chartDom);
var option;
option = {
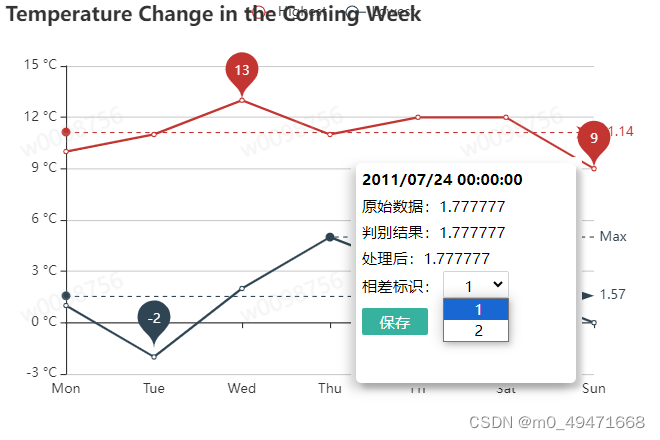
title: {
text: 'Temperature Change in the Coming Week'
},
tooltip: {
trigger: 'item',
triggerOn: 'mousemove',
enterable: true,
backgroundColor: 'white',
formatter: function (arg, ticket, callback) {
var options = ['1', '2'] // 假设arg是一个对象,其中包含一个名为options的数组,用于存储自定义选项
var selectOptions = '';
for (var i = 0; i < options.length; i++) {
selectOptions += '<option value="' + options[i] + '">' + options[i] + '</option>';
}
var res = `
<div style="color:black;width: 200px;height: 200px; box-shadow: 5px 5px 5px rgba(0, 0, 0, 0.2), -5px 5px 10px rgba(0, 0, 0, 0.2);border-radius:5px;padding:5px">
<div style="font-weight:bold;color:black">2011/07/24 00:00:00</div>
<div style="color:black;margin-top:3px">原始数据:1.777777</div>
<div style="color:black;margin-top:3px">判别结果:1.777777</div>
<div style="color:black;margin-top:3px">处理后:1.777777</div>
<span >相差标识:</span>
<select onchange="handleClick()" style="display: inline-block;width:60px;height:25px;background-color: white;border: 1px solid #D3D3D3 ;color:black;padding:3px;border-radius:2px;text-align:center;line-height:20px">
${selectOptions}
</select>
<div style="margin-top:8px">
<div style="display: inline-block;width:60px;height:25px;background-color: rgb(55, 178, 158);border-color: rgb(55, 178, 158);color:white;padding:3px;border-radius:2px;text-align:center;line-height:20px" onclick="handleClick()">
保存
</div>
<div style="margin-left:10px;display: inline-block;width:60px;height:25px;background-color: white;border: 1px solid #D3D3D3 ;color:black;padding:3px;border-radius:2px;text-align:center;line-height:20px" onclick="handleClick()">
取消
</div>
<div>
</div>
`
return res
}
},
legend: {},
toolbox: {
show: true
},
xAxis: {
type: 'category',
boundaryGap: false,
data: ['Mon', 'Tue', 'Wed', 'Thu', 'Fri', 'Sat', 'Sun']
},
yAxis: {
type: 'value',
axisLabel: {
formatter: '{value} °C'
}
},
series: [
{
name: 'Highest',
type: 'line',
data: [10, 11, 13, 11, 12, 12, 9],
markPoint: {
data: [
{ type: 'max', name: 'Max' },
{ type: 'min', name: 'Min' }
]
},
markLine: {
data: [{ type: 'average', name: 'Avg' }]
}
},
{
name: 'Lowest',
type: 'line',
data: [1, -2, 2, 5, 3, 2, 0],
markPoint: {
data: [{ name: '周最低', value: -2, xAxis: 1, yAxis: -1.5 }]
},
markLine: {
data: [
{ type: 'average', name: 'Avg' },
[
{
symbol: 'none',
x: '90%',
yAxis: 'max'
},
{
symbol: 'circle',
label: {
position: 'start',
formatter: 'Max'
},
type: 'max',
name: '最高点'
}
]
]
}
}
]
};
option && myChart.setOption(option);
}
}
};
</script>