kaggle(4) Regression with an Abalone Dataset 鲍鱼数据集的回归

import pandas as pd
import numpy as np

import xgboost
import lightgbm
import optuna
import catboost

from sklearn.model_selection import train_test_split
from sklearn.metrics import mean_squared_log_error
from sklearn.compose import TransformedTargetRegressor
from sklearn.ensemble import VotingRegressor, StackingRegressor
from sklearn.pipeline import make_pipeline
from sklearn.preprocessing import OneHotEncoder

import seaborn as sns
import matplotlib.pyplot as plt

import warnings
warnings.filterwarnings("ignore")
PROJECT DESCRIPTION
Predicting the age of abalone from physical measurements. The age of abalone is determined by cutting the shell through the cone, staining it, and counting the number of rings through a microscope
PHYSICAL ATTRIBUTES
SEX: Male/Female/Infant
LENGTH: Longest shell measurement
DIAMETER: Diameter of the Abalone
HEIGHT: Height of the Abalone
WHOLE WEIGHT: Weight of the whole abalone
SHUCKED WEIGHT: Weight of the meat
VISCERA WEIGHT: Gut Weight - Interal Organs
SHELL WEIGHT: Shell Weight after drying
RINGS: Number of rings +1.5 gives Age of the Abalone
项目介绍
通过物理测量预测鲍鱼的年龄。 鲍鱼的年龄是通过将鲍鱼壳从锥体上切开、染色并通过显微镜计算环数来确定的。
物理属性
性别:男/女/婴儿
长度:最长外壳测量值
直径:鲍鱼的直径
高度:鲍鱼的高度
整体重量:整个鲍鱼的重量
去壳重量:肉的重量
内脏重量:肠道重量 - 内脏器官
壳重:干燥后的壳重
环:环数+1.5给出鲍鱼的年龄
Load the Datasets 加载数据集
# original = pd.read_csv("/kaggle/input/abalone-dataset/abalone.csv")
# train = pd.read_csv("/kaggle/input/playground-series-s4e4/train.csv")
# test = pd.read_csv("/kaggle/input/playground-series-s4e4/test.csv")
original = pd.read_csv("./data/abalone.csv")
train = pd.read_csv("./data/train.csv")
test = pd.read_csv("./data/test.csv")
Make the data ready for tuning 准备好数据进行调整
train = train.drop("id", axis=1)
train=train.rename(columns={'Whole weight':'Whole weight','Whole weight.1':'Shucked weight', 'Whole weight.2':'Viscera weight', 'Shell weight':'Shell weight'})
test=test.rename(columns={'Whole weight':'Whole weight','Whole weight.1':'Shucked weight', 'Whole weight.2':'Viscera weight', 'Shell weight':'Shell weight'})
train = pd.concat([train, original], axis=0)
Get familier with the Data 熟悉数据
train.head()
| Sex | Length | Diameter | Height | Whole weight | Shucked weight | Viscera weight | Shell weight | Rings | |
|---|---|---|---|---|---|---|---|---|---|
| 0 | F | 0.550 | 0.430 | 0.150 | 0.7715 | 0.3285 | 0.1465 | 0.2400 | 11 |
| 1 | F | 0.630 | 0.490 | 0.145 | 1.1300 | 0.4580 | 0.2765 | 0.3200 | 11 |
| 2 | I | 0.160 | 0.110 | 0.025 | 0.0210 | 0.0055 | 0.0030 | 0.0050 | 6 |
| 3 | M | 0.595 | 0.475 | 0.150 | 0.9145 | 0.3755 | 0.2055 | 0.2500 | 10 |
| 4 | I | 0.555 | 0.425 | 0.130 | 0.7820 | 0.3695 | 0.1600 | 0.1975 | 9 |
print(f"The shape of training dataset is : {train.shape}")
print(f"The shape of testing dataset is : {test.shape}")
The shape of training dataset is : (94792, 9)
The shape of testing dataset is : (60411, 9)
test.head()
| id | Sex | Length | Diameter | Height | Whole weight | Shucked weight | Viscera weight | Shell weight | |
|---|---|---|---|---|---|---|---|---|---|
| 0 | 90615 | M | 0.645 | 0.475 | 0.155 | 1.2380 | 0.6185 | 0.3125 | 0.3005 |
| 1 | 90616 | M | 0.580 | 0.460 | 0.160 | 0.9830 | 0.4785 | 0.2195 | 0.2750 |
| 2 | 90617 | M | 0.560 | 0.420 | 0.140 | 0.8395 | 0.3525 | 0.1845 | 0.2405 |
| 3 | 90618 | M | 0.570 | 0.490 | 0.145 | 0.8740 | 0.3525 | 0.1865 | 0.2350 |
| 4 | 90619 | I | 0.415 | 0.325 | 0.110 | 0.3580 | 0.1575 | 0.0670 | 0.1050 |
train.groupby("Sex").count()["Length"]
Sex
F    27802
I    34435
M    32555
Name: Length, dtype: int64
test.groupby("Sex").count()["Length"]
Sex
F    17387
I    22241
M    20783
Name: Length, dtype: int64
np.sort(pd.unique(train.Rings))
array([ 1,  2,  3,  4,  5,  6,  7,  8,  9, 10, 11, 12, 13, 14, 15, 16, 17,
       18, 19, 20, 21, 22, 23, 24, 25, 26, 27, 29], dtype=int64)
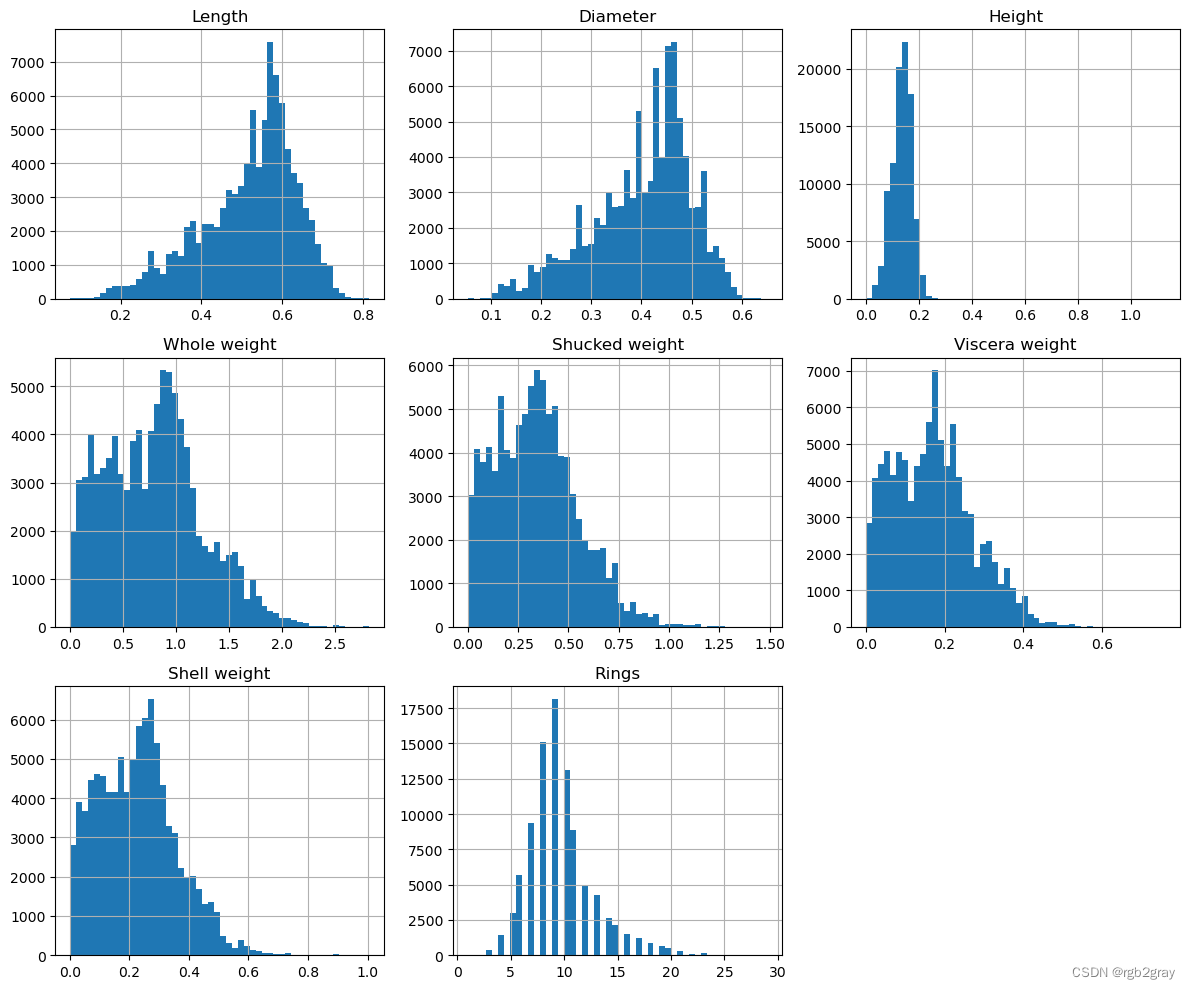
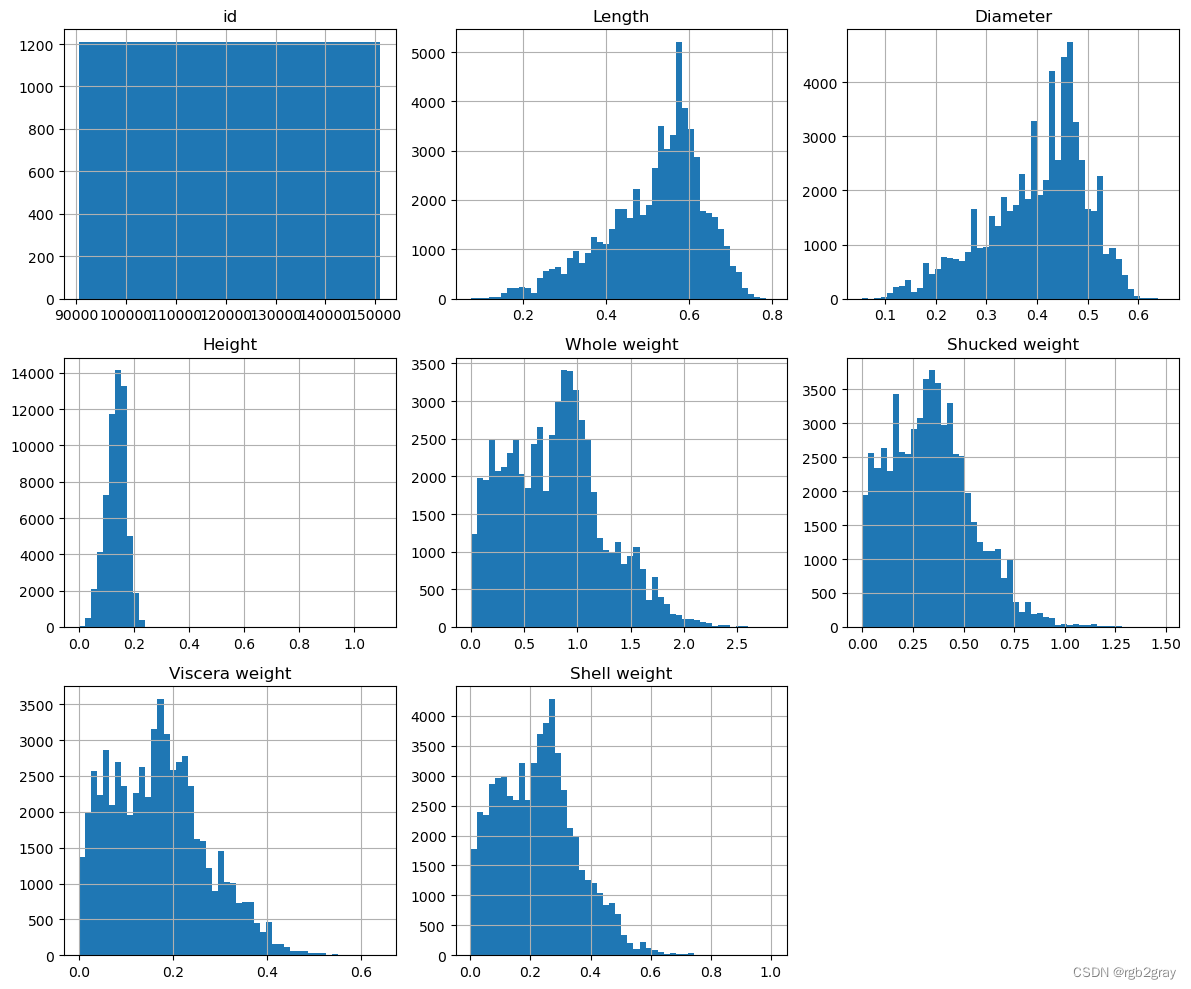
View the Distribution 查看分布
train.hist(figsize=(12, 10), grid=True, bins=50)
plt.tight_layout()
plt.axis("off")
(0.0, 1.0, 0.0, 1.0)
test.hist(figsize=(12, 10), grid=True, bins=50)
plt.tight_layout()
plt.axis("off")
(0.0, 1.0, 0.0, 1.0)
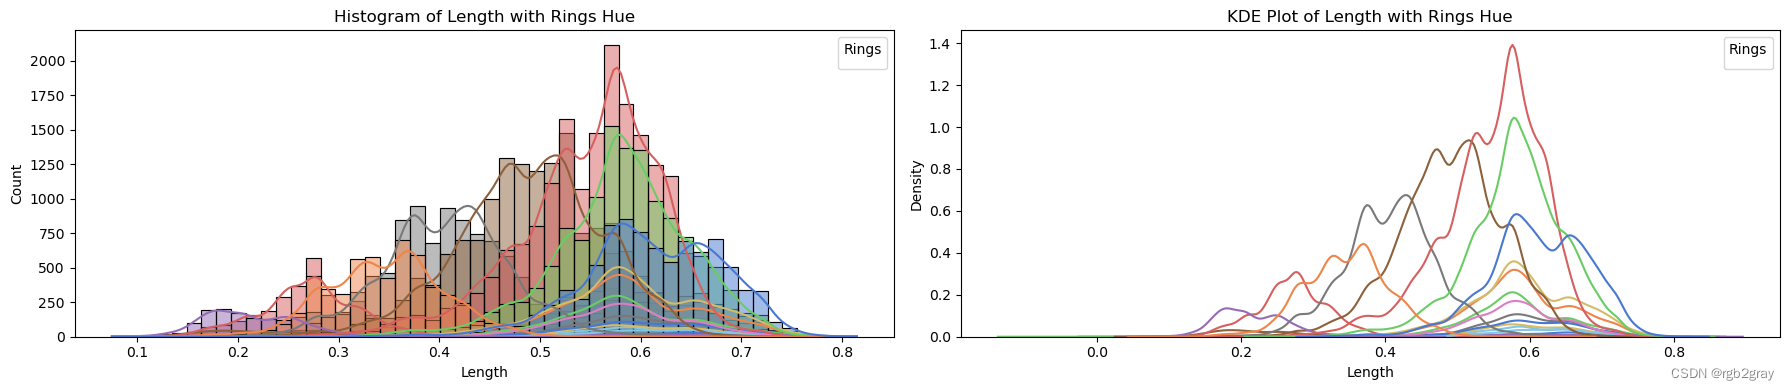
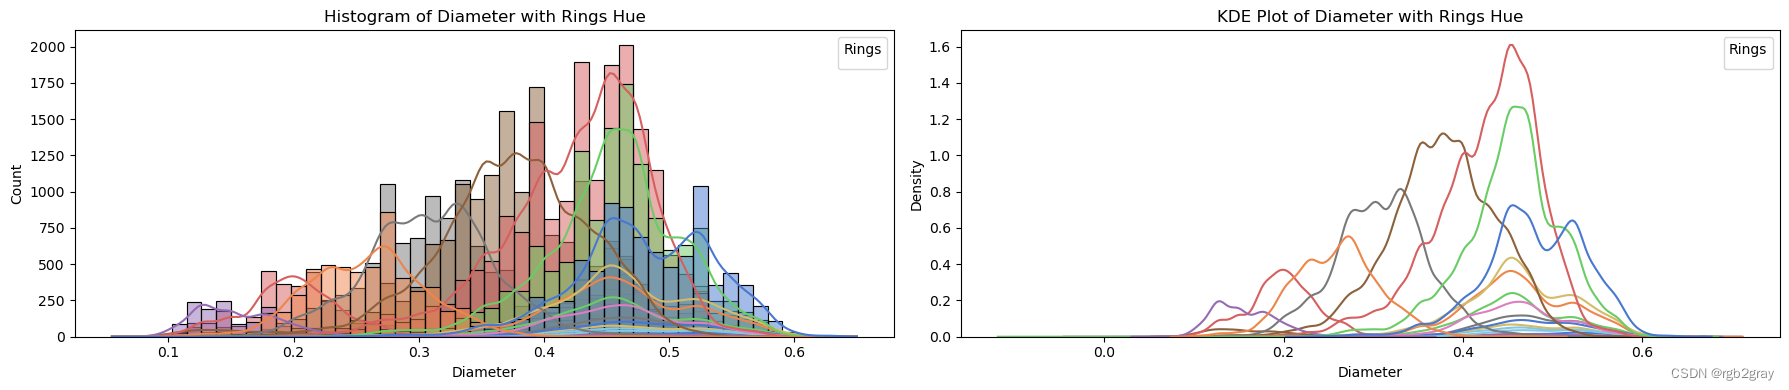
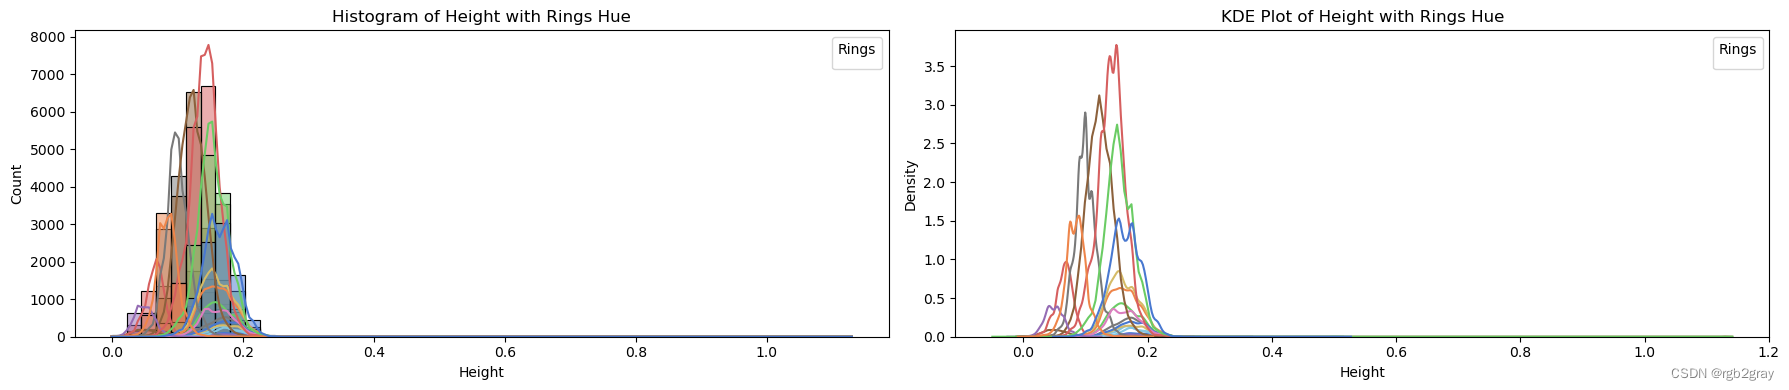
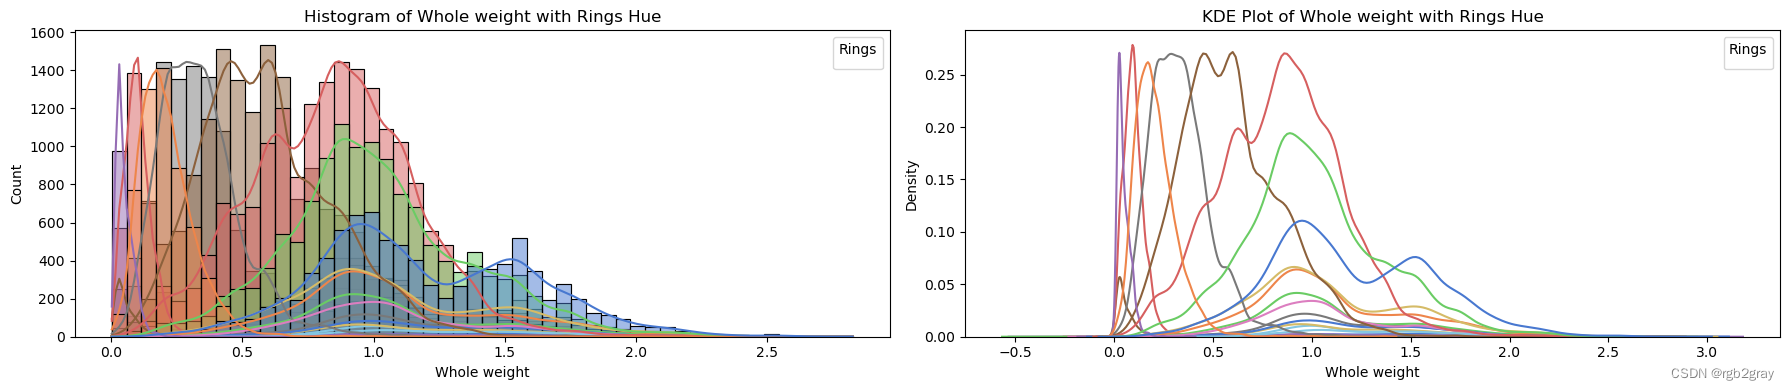
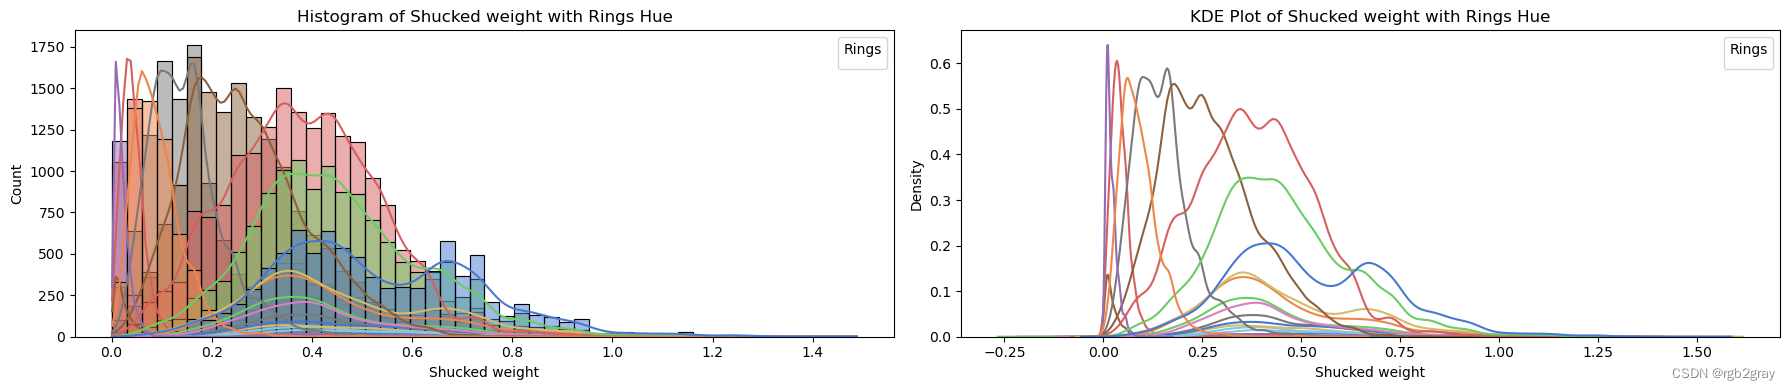
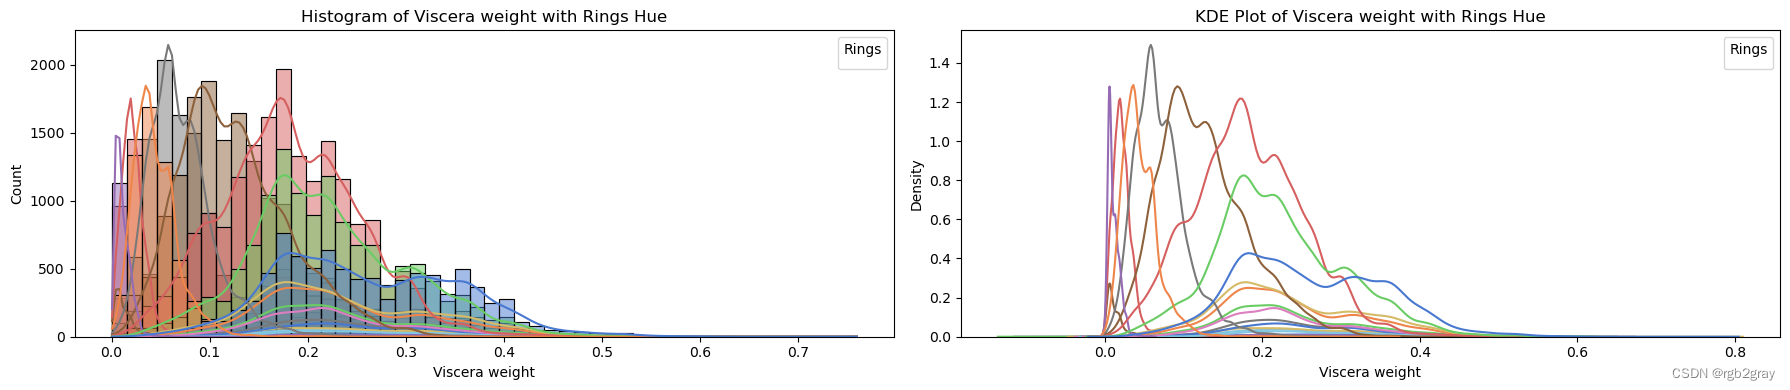
CONTINUOUS COLUMN ANALYSIS 连续柱分析
# Set up warnings to be ignored (optional)
warnings.filterwarnings("ignore")
pd.set_option('mode.use_inf_as_na', False)

train_str = train
train_str['Rings'] = train_str['Rings'].astype(str)

# List of continuous variables in your dataset
continuous_vars = ['Length', 'Diameter', 'Height', 'Whole weight', 'Shucked weight', 'Viscera weight', 'Shell weight']

# Set hue to your target column
target_column = 'Rings'

for column in continuous_vars:
    fig, axes = plt.subplots(1, 2, figsize=(18, 4))  # Create subplots with 1 row and 2 columns

    # Plot histogram with hue and explicit labels
    sns.histplot(data=train_str, x=column, hue=target_column, bins=50, kde=True, ax=axes[0], palette='muted', legend=False)
    axes[0].set_title(f'Histogram of {column} with {target_column} Hue')
    axes[0].set_xlabel(column)
    axes[0].set_ylabel('Count')
    axes[0].legend(title=target_column, loc='upper right')

    # Plot KDE plot with hue and explicit labels
    sns.kdeplot(data=train_str, x=column, hue=target_column, ax=axes[1], palette='muted', legend=False)
    axes[1].set_title(f'KDE Plot of {column} with {target_column} Hue')
    axes[1].set_xlabel(column)
    axes[1].set_ylabel('Density')
    axes[1].legend(title=target_column, loc='upper right')

    plt.tight_layout()  # Adjust spacing between subplots
    plt.show()

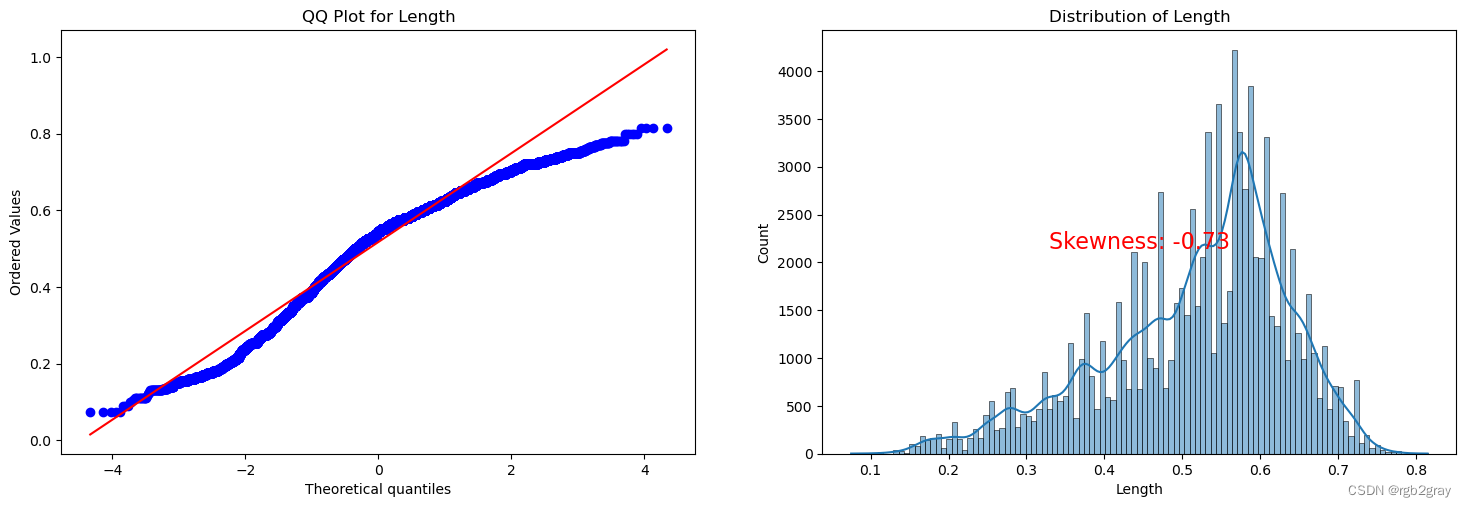
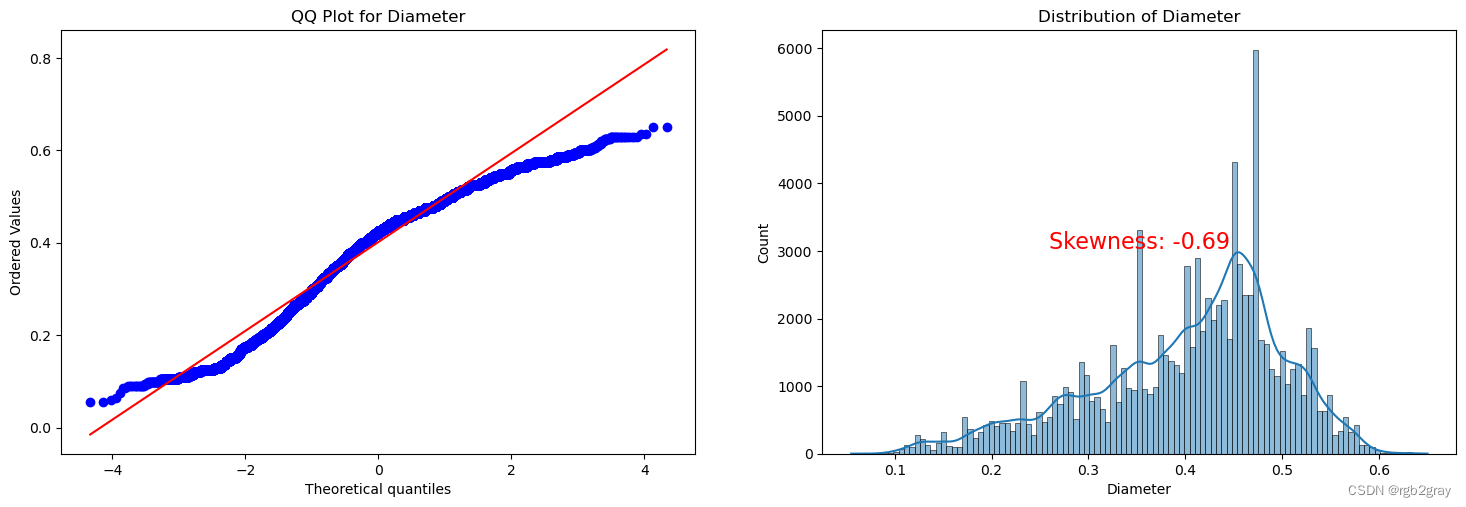
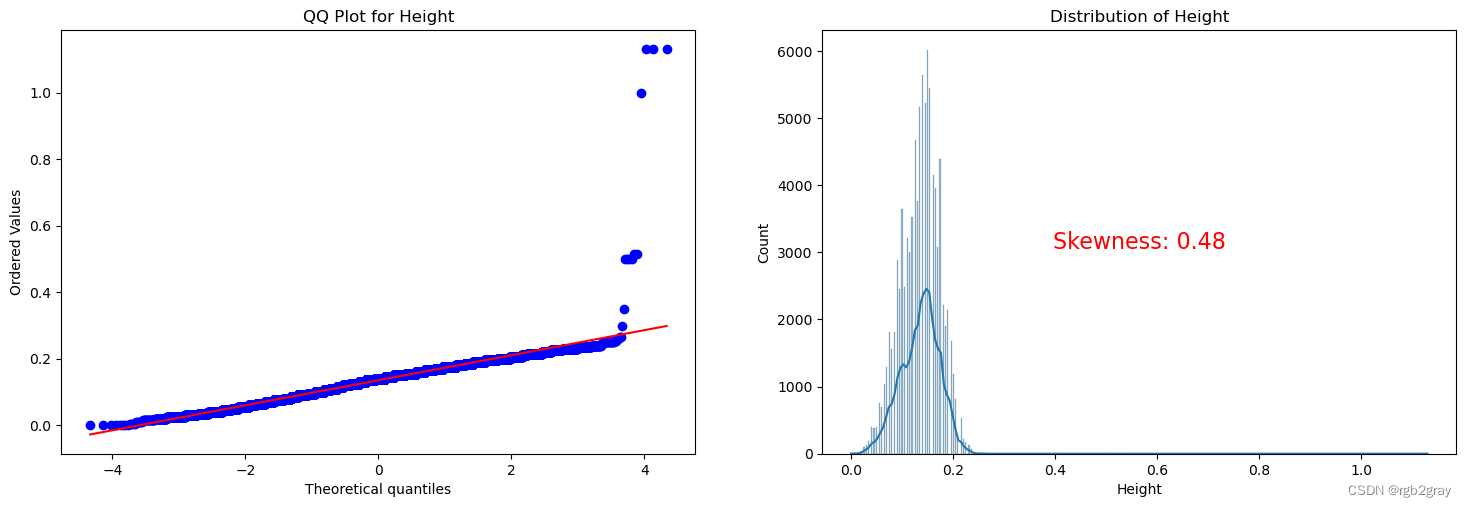
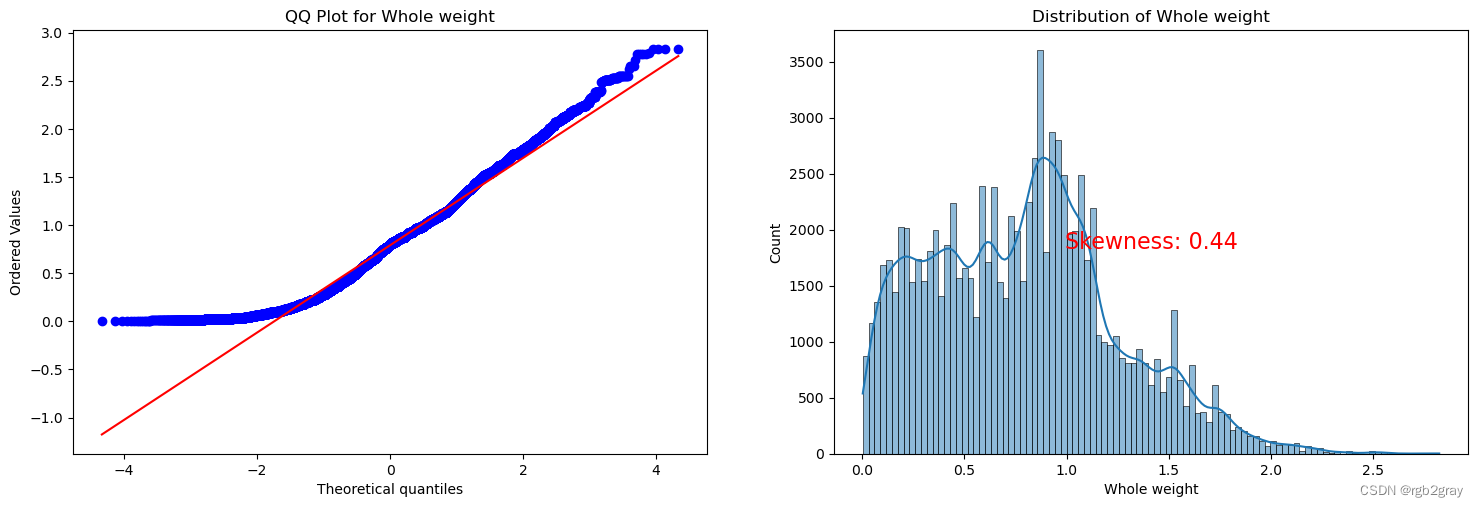
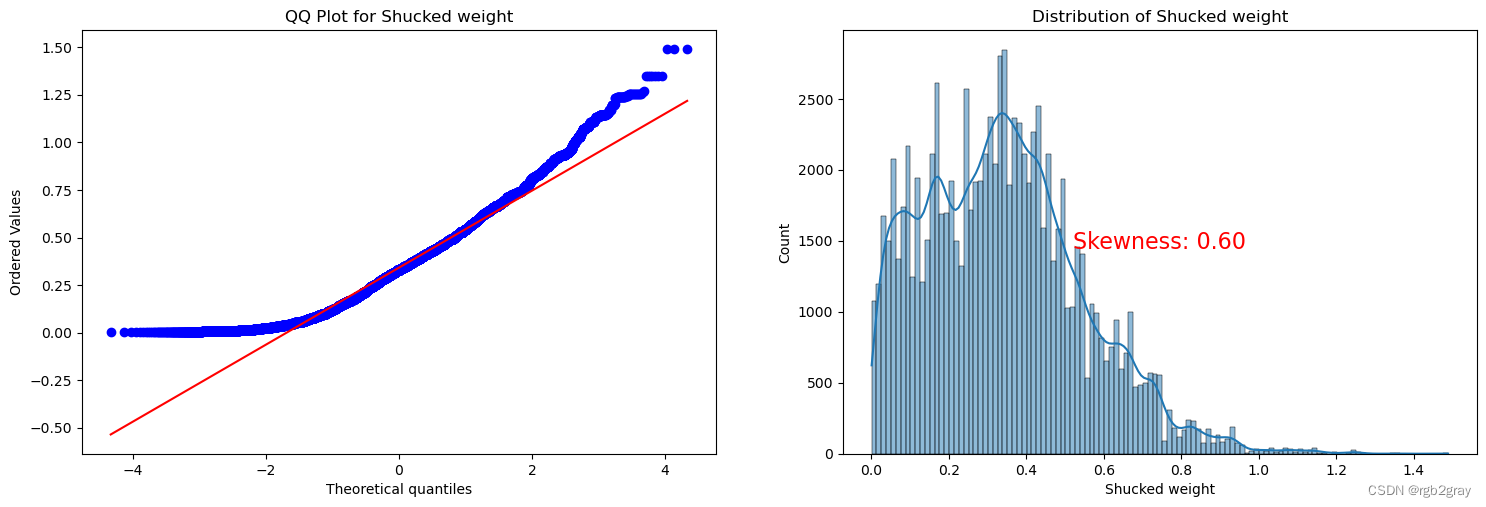
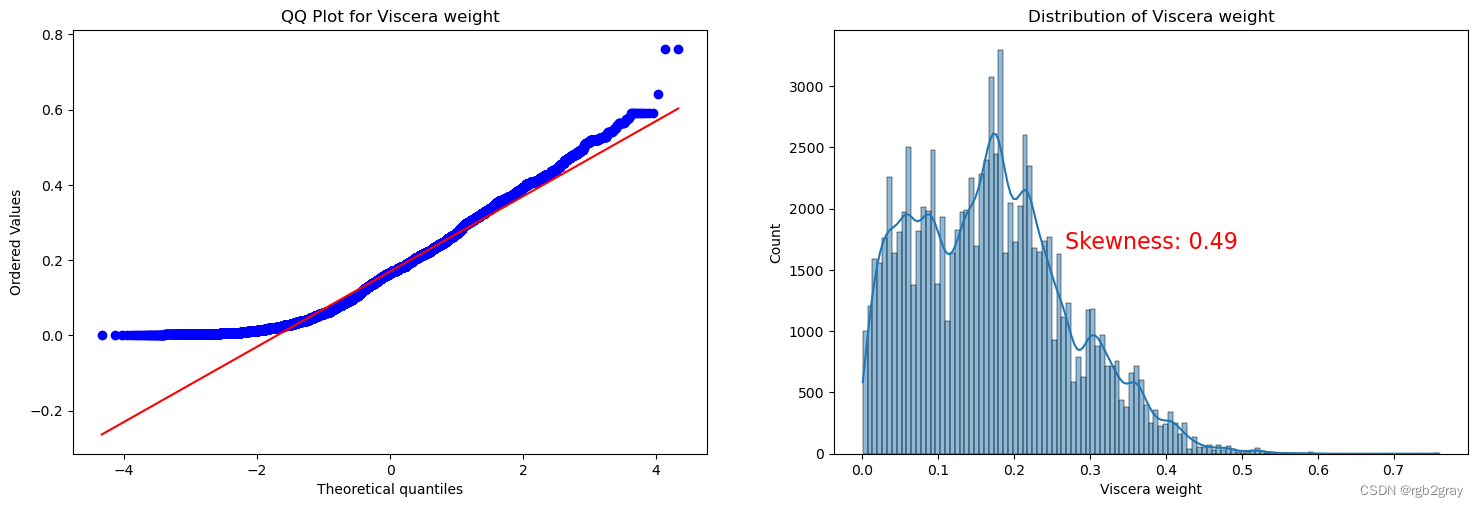
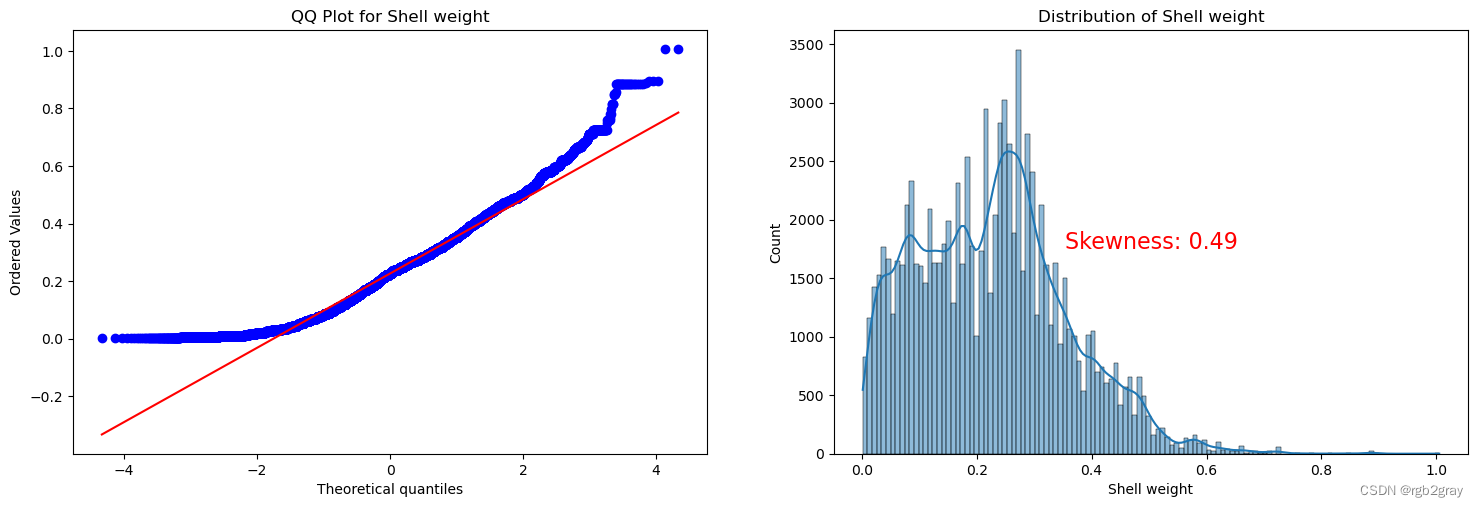
ANALYSIS BY QQ PLOT QQ图分析
import scipy.stats as stats
def qq_plot_with_skewness(data, quantitative_var):
    # Check if the variable is present in the DataFrame
    if quantitative_var not in data.columns:
        print(f"Error: '{quantitative_var}' not found in the DataFrame.")
        return

    f, ax = plt.subplots(1, 2, figsize=(18, 5.5))

    # Check for missing values
    if data[quantitative_var].isnull().any():
        print(f"Warning: '{quantitative_var}' contains missing values. Results may be affected.")

    # QQ plot
    stats.probplot(data[quantitative_var], plot=ax[0], fit=True)
    ax[0].set_title(f'QQ Plot for {quantitative_var}')

    # Skewness plot
    sns.histplot(data[quantitative_var], kde=True, ax=ax[1])
    ax[1].set_title(f'Distribution of {quantitative_var}')

    # Calculate skewness value
    skewness_value = stats.skew(data[quantitative_var])

    # Display skewness value on the plot
    ax[1].text(0.5, 0.5, f'Skewness: {skewness_value:.2f}', transform=ax[1].transAxes,
               horizontalalignment='center', verticalalignment='center', fontsize=16, color='red')

    plt.show()
# Example usage for each continuous variable
for var in continuous_vars:
    qq_plot_with_skewness(train, var)
Split the Dataset 分割数据集
sex_to_num = {
    "M": 0,
    "F": 1,
    "I": 2
}
train["Sex"] = train["Sex"].replace(sex_to_num.keys(), [sex_to_num[key] for key in sex_to_num])
test["Sex"] = test["Sex"].replace(sex_to_num.keys(), [sex_to_num[key] for key in sex_to_num])
train.groupby("Sex").count()["Length"]
Sex
0    32555
1    27802
2    34435
Name: Length, dtype: int64
X = train.drop("Rings", axis=1)
y = train.Rings
X_train, X_test, y_train, y_test = train_test_split(X, y, test_size=0.3, random_state=42, stratify=y)
X_valid, X_test, y_valid, y_test = train_test_split(X_test, y_test, test_size=0.5, random_state=42, stratify=y_test)
Here stratify parameter keeps the ratio of Rings same all across the Dtaset
XGBoost
we will be implementing two XGBoost models
def xgb_objective(trial):
    params = {
        "eta": trial.suggest_float("eta", 0.01, 1.0),
        "gamma": 0.0,
        "max_depth": trial.suggest_int("max_depth", 3, 20),
        "min_child_weight": trial.suggest_float("min_child_weight", 1., 50.),
        "subsample": trial.suggest_float("subsample", 0.5, 1.0),
        "colsample_bytree": trial.suggest_float("colsample_bytree", 0.5, 1.0),
        "reg_lambda": trial.suggest_float("lambda", 1.0, 100.0),
        "n_estimators": trial.suggest_int("n_estimators", 100, 1000)
    }

    xgb_reg = TransformedTargetRegressor(xgboost.XGBRegressor(**params, objective='reg:squarederror', grow_policy='lossguide',
                                                         tree_method="hist", random_state=42),
                                                         func=np.log1p,
                                                         inverse_func=np.expm1)
    xgb_reg.fit(X_train, y_train, eval_set=[(X_valid, y_valid)], verbose=False)

    val_scores = mean_squared_log_error(y_valid, xgb_reg.predict(X_valid), squared=False)
    return val_scores

sampler = optuna.samplers.TPESampler(seed=42)  # Using Tree-structured Parzen Estimator sampler for optimization
xgb_study = optuna.create_study(direction = 'minimize',study_name="XgbRegressor", sampler=sampler)
[I 2024-04-25 16:46:29,229] A new study created in memory with name: XgbRegressor
XGBoost 1st model
TUNE = False
if TUNE:
    xgb_study.optimize(xgb_objective, n_trials=500)
Set TUNE parameter to True incase you want to run Hyper Parameter Tuning
xgb_best_params_1 = {
    'eta': 0.1006321838798394,
    'max_depth': 6,
    'min_child_weight': 27.999752791085136,
    'subsample': 0.7344797943645852,
    'colsample_bytree': 0.5389765810810496,
    'lambda': 79.62358968148187,
    'n_estimators': 407
}
xgb_reg_1 = TransformedTargetRegressor(xgboost.XGBRegressor(**xgb_best_params_1, objective='reg:squarederror', grow_policy='lossguide',
                                                 tree_method="hist", random_state=42, gamma=0.0),
                                                 func=np.log1p,
                                                 inverse_func=np.expm1)
xgb_reg_1.fit(X_train, y_train)
TransformedTargetRegressor(func=<ufunc 'log1p'>, inverse_func=<ufunc 'expm1'>,regressor=XGBRegressor(base_score=None, booster=None, callbacks=None, colsample_bylevel=None, colsample_bynode=None, colsample_bytree=0.5389765810810496, early_stopping_rounds=None, enable_categorical=False, eta=0.1006321838798394, eval_metric=None, feature_types=None, gamma=0.0, gpu_id... grow_policy='lossguide', importance_type=None, interaction_constraints=None, lambda=79.62358968148187, learning_rate=None, max_bin=None, max_cat_threshold=None, max_cat_to_onehot=None, max_delta_step=None, max_depth=6, max_leaves=None, min_child_weight=27.999752791085136, missing=nan, monotone_constraints=None, n_estimators=407, n_jobs=None, num_parallel_tree=None, ...))</pre><b>In a Jupyter environment, please rerun this cell to show the HTML representation or trust the notebook. <br />On GitHub, the HTML representation is unable to render, please try loading this page with nbviewer.org.</b></div><div class="sk-container" hidden><div class="sk-item sk-dashed-wrapped"><div class="sk-label-container"><div class="sk-label sk-toggleable"><input class="sk-toggleable__control sk-hidden--visually" id="sk-estimator-id-1" type="checkbox" ><label for="sk-estimator-id-1" class="sk-toggleable__label sk-toggleable__label-arrow">TransformedTargetRegressor</label><div class="sk-toggleable__content"><pre>TransformedTargetRegressor(func=<ufunc 'log1p'>, inverse_func=<ufunc 'expm1'>, regressor=XGBRegressor(base_score=None, booster=None, callbacks=None, colsample_bylevel=None, colsample_bynode=None, colsample_bytree=0.5389765810810496, early_stopping_rounds=None, enable_categorical=False, eta=0.1006321838798394, eval_metric=None, feature_types=None, gamma=0.0, gpu_id... grow_policy='lossguide', importance_type=None, interaction_constraints=None, lambda=79.62358968148187, learning_rate=None, max_bin=None, max_cat_threshold=None, max_cat_to_onehot=None, max_delta_step=None, max_depth=6, max_leaves=None, min_child_weight=27.999752791085136, missing=nan, monotone_constraints=None, n_estimators=407, n_jobs=None, num_parallel_tree=None, ...))</pre></div></div></div><div class="sk-parallel"><div class="sk-parallel-item"><div class="sk-item"><div class="sk-label-container"><div class="sk-label sk-toggleable"><input class="sk-toggleable__control sk-hidden--visually" id="sk-estimator-id-2" type="checkbox" ><label for="sk-estimator-id-2" class="sk-toggleable__label sk-toggleable__label-arrow">regressor: XGBRegressor</label><div class="sk-toggleable__content"><pre>XGBRegressor(base_score=None, booster=None, callbacks=None, colsample_bylevel=None, colsample_bynode=None, colsample_bytree=0.5389765810810496, early_stopping_rounds=None, enable_categorical=False, eta=0.1006321838798394, eval_metric=None, feature_types=None, gamma=0.0, gpu_id=None, grow_policy='lossguide', importance_type=None, interaction_constraints=None, lambda=79.62358968148187, learning_rate=None, max_bin=None, max_cat_threshold=None, max_cat_to_onehot=None, max_delta_step=None, max_depth=6, max_leaves=None, min_child_weight=27.999752791085136, missing=nan, monotone_constraints=None, n_estimators=407, n_jobs=None, num_parallel_tree=None, ...)</pre></div></div></div><div class="sk-serial"><div class="sk-item"><div class="sk-estimator sk-toggleable"><input class="sk-toggleable__control sk-hidden--visually" id="sk-estimator-id-3" type="checkbox" ><label for="sk-estimator-id-3" class="sk-toggleable__label sk-toggleable__label-arrow">XGBRegressor</label><div class="sk-toggleable__content"><pre>XGBRegressor(base_score=None, booster=None, callbacks=None, colsample_bylevel=None, colsample_bynode=None, colsample_bytree=0.5389765810810496, early_stopping_rounds=None, enable_categorical=False, eta=0.1006321838798394, eval_metric=None, feature_types=None, gamma=0.0, gpu_id=None, grow_policy='lossguide', importance_type=None, interaction_constraints=None, lambda=79.62358968148187, learning_rate=None, max_bin=None, max_cat_threshold=None, max_cat_to_onehot=None, max_delta_step=None, max_depth=6, max_leaves=None, min_child_weight=27.999752791085136, missing=nan, monotone_constraints=None, n_estimators=407, n_jobs=None, num_parallel_tree=None, ...)</pre></div></div></div></div></div></div></div></div></div></div>
mean_squared_log_error(y_valid, xgb_reg_1.predict(X_valid), squared=False)
0.1484868328972631
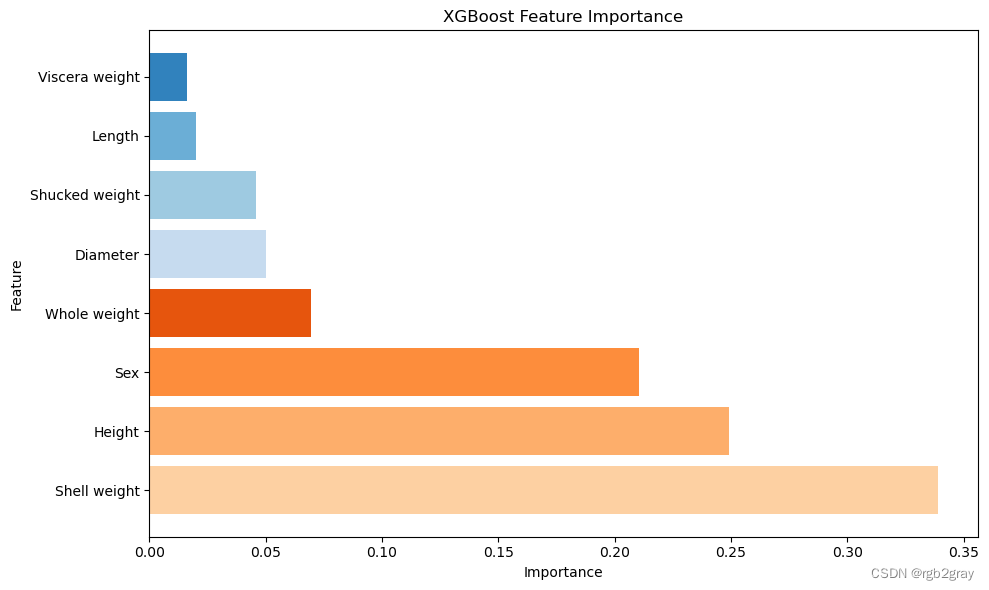
feature_importance = xgb_reg_1.regressor_.feature_importances_
feature_names = X_train.columns

sorted_indices = feature_importance.argsort()
sorted_importance = feature_importance[sorted_indices]
sorted_features = feature_names[sorted_indices]

plt.figure(figsize=(10, 6))
colors = plt.cm.tab20c.colors[:len(sorted_features)]
plt.barh(sorted_features, sorted_importance, color=colors)
plt.xlabel('Importance')
plt.ylabel('Feature')
plt.title('XGBoost Feature Importance')
plt.gca().invert_yaxis()
plt.tight_layout()
plt.show()
XGBoost 2
xgb_best_params_2 = {
    'eta': 0.08999645298052271,
    'max_depth': 6,
    'min_child_weight': 2.088127882610971,
    'subsample': 0.7725806961689413,
    'colsample_bytree': 0.9163306027660207,
    'lambda': 5.356530752285997,
    'n_estimators': 652
}
xgb_reg_2 = TransformedTargetRegressor(xgboost.XGBRegressor(**xgb_best_params_2, objective='reg:squaredlogerror', grow_policy='depthwise',
                                                          tree_method="hist", random_state=42),
                                                 func=np.log1p,
                                                 inverse_func=np.expm1)
xgb_reg_2.fit(X_train, y_train)
TransformedTargetRegressor(func=<ufunc 'log1p'>, inverse_func=<ufunc 'expm1'>,regressor=XGBRegressor(base_score=None, booster=None, callbacks=None, colsample_bylevel=None, colsample_bynode=None, colsample_bytree=0.9163306027660207, early_stopping_rounds=None, enable_categorical=False, eta=0.08999645298052271, eval_metric=None, feature_types=None, gamma=None, gpu_... grow_policy='depthwise', importance_type=None, interaction_constraints=None, lambda=5.356530752285997, learning_rate=None, max_bin=None, max_cat_threshold=None, max_cat_to_onehot=None, max_delta_step=None, max_depth=6, max_leaves=None, min_child_weight=2.088127882610971, missing=nan, monotone_constraints=None, n_estimators=652, n_jobs=None, num_parallel_tree=None, ...))</pre><b>In a Jupyter environment, please rerun this cell to show the HTML representation or trust the notebook. <br />On GitHub, the HTML representation is unable to render, please try loading this page with nbviewer.org.</b></div><div class="sk-container" hidden><div class="sk-item sk-dashed-wrapped"><div class="sk-label-container"><div class="sk-label sk-toggleable"><input class="sk-toggleable__control sk-hidden--visually" id="sk-estimator-id-4" type="checkbox" ><label for="sk-estimator-id-4" class="sk-toggleable__label sk-toggleable__label-arrow">TransformedTargetRegressor</label><div class="sk-toggleable__content"><pre>TransformedTargetRegressor(func=<ufunc 'log1p'>, inverse_func=<ufunc 'expm1'>, regressor=XGBRegressor(base_score=None, booster=None, callbacks=None, colsample_bylevel=None, colsample_bynode=None, colsample_bytree=0.9163306027660207, early_stopping_rounds=None, enable_categorical=False, eta=0.08999645298052271, eval_metric=None, feature_types=None, gamma=None, gpu_... grow_policy='depthwise', importance_type=None, interaction_constraints=None, lambda=5.356530752285997, learning_rate=None, max_bin=None, max_cat_threshold=None, max_cat_to_onehot=None, max_delta_step=None, max_depth=6, max_leaves=None, min_child_weight=2.088127882610971, missing=nan, monotone_constraints=None, n_estimators=652, n_jobs=None, num_parallel_tree=None, ...))</pre></div></div></div><div class="sk-parallel"><div class="sk-parallel-item"><div class="sk-item"><div class="sk-label-container"><div class="sk-label sk-toggleable"><input class="sk-toggleable__control sk-hidden--visually" id="sk-estimator-id-5" type="checkbox" ><label for="sk-estimator-id-5" class="sk-toggleable__label sk-toggleable__label-arrow">regressor: XGBRegressor</label><div class="sk-toggleable__content"><pre>XGBRegressor(base_score=None, booster=None, callbacks=None, colsample_bylevel=None, colsample_bynode=None, colsample_bytree=0.9163306027660207, early_stopping_rounds=None, enable_categorical=False, eta=0.08999645298052271, eval_metric=None, feature_types=None, gamma=None, gpu_id=None, grow_policy='depthwise', importance_type=None, interaction_constraints=None, lambda=5.356530752285997, learning_rate=None, max_bin=None, max_cat_threshold=None, max_cat_to_onehot=None, max_delta_step=None, max_depth=6, max_leaves=None, min_child_weight=2.088127882610971, missing=nan, monotone_constraints=None, n_estimators=652, n_jobs=None, num_parallel_tree=None, ...)</pre></div></div></div><div class="sk-serial"><div class="sk-item"><div class="sk-estimator sk-toggleable"><input class="sk-toggleable__control sk-hidden--visually" id="sk-estimator-id-6" type="checkbox" ><label for="sk-estimator-id-6" class="sk-toggleable__label sk-toggleable__label-arrow">XGBRegressor</label><div class="sk-toggleable__content"><pre>XGBRegressor(base_score=None, booster=None, callbacks=None, colsample_bylevel=None, colsample_bynode=None, colsample_bytree=0.9163306027660207, early_stopping_rounds=None, enable_categorical=False, eta=0.08999645298052271, eval_metric=None, feature_types=None, gamma=None, gpu_id=None, grow_policy='depthwise', importance_type=None, interaction_constraints=None, lambda=5.356530752285997, learning_rate=None, max_bin=None, max_cat_threshold=None, max_cat_to_onehot=None, max_delta_step=None, max_depth=6, max_leaves=None, min_child_weight=2.088127882610971, missing=nan, monotone_constraints=None, n_estimators=652, n_jobs=None, num_parallel_tree=None, ...)</pre></div></div></div></div></div></div></div></div></div></div>
mean_squared_log_error(y_valid, xgb_reg_2.predict(X_valid), squared=False)
0.14881444008796907
LIGHTGBM
def lgbm_objective(trial):
    # Define parameters to be optimized for the LGBMClassifier
    param = {
        "verbosity": -1,
        "random_state": 42,
        "learning_rate": trial.suggest_float("learning_rate", 0.01, 0.05),
        "n_estimators": trial.suggest_int("n_estimators", 400, 1000),
        "lambda_l1": trial.suggest_float("lambda_l1", 0.005, 0.015),
        "lambda_l2": trial.suggest_float("lambda_l2", 0.02, 0.06),
        "max_depth": trial.suggest_int("max_depth", 6, 14),
        "colsample_bytree": trial.suggest_float("colsample_bytree", 0.3, 0.9),
        "subsample": trial.suggest_float("subsample", 0.8, 1.0),
        "min_child_samples": trial.suggest_int("min_child_samples", 10, 70),
        "num_leaves": trial.suggest_int("num_leaves", 30, 100),
        "min_split_gain": trial.suggest_float("min_split_gain", 0.1, 1.0)
    }

    lgbm_reg = lightgbm.LGBMRegressor(**param)

    lgbm_reg.fit(X_train, y_train)

    score = mean_squared_log_error(y_valid, lgbm_reg.predict(X_valid), squared=False)

    return score


# Set up the sampler for Optuna optimization
sampler = optuna.samplers.TPESampler(seed=42)  # Using Tree-structured Parzen Estimator sampler for optimization

# Create a study object for Optuna optimization
lgbm_study = optuna.create_study(direction="minimize", sampler=sampler)
[I 2024-04-25 16:46:32,141] A new study created in memory with name: no-name-889f25f6-876c-4982-ba46-f71528b83793
if TUNE:
    # Run the optimization process
    lgbm_study.optimize(lambda trial: lgbm_objective(trial), n_trials=200)

    # Get the best parameters after optimization
    lgbm_best_params = lgbm_study.best_params

    print('='*50)
    print(lgbm_best_params)
LIGHTGbm 1
lgbm_params_1 = {
    'learning_rate': 0.04090453688322824,
    'n_estimators': 788,
    'reg_lambda': 29.248167932522765,
    'reg_alpha': 0.4583079398945705,
    'max_depth': 19,
    'colsample_bytree': 0.5439642175304692,
    'subsample': 0.8659762900446526,
    'min_child_samples': 12,
    'num_leaves': 69,
    'random_state': 42,
    'n_jobs': -1,
    'verbose': -1
}
lgbm_reg_1 = TransformedTargetRegressor(lightgbm.LGBMRegressor(**lgbm_params_1),
                                                 func=np.log1p,
                                                 inverse_func=np.expm1)
lgbm_reg_1.fit(X_train, y_train)
TransformedTargetRegressor(func=<ufunc 'log1p'>, inverse_func=<ufunc 'expm1'>,regressor=LGBMRegressor(colsample_bytree=0.5439642175304692, learning_rate=0.04090453688322824, max_depth=19, min_child_samples=12, n_estimators=788, n_jobs=-1, num_leaves=69, random_state=42, reg_alpha=0.4583079398945705, reg_lambda=29.248167932522765, subsample=0.8659762900446526, verbose=-1))</pre><b>In a Jupyter environment, please rerun this cell to show the HTML representation or trust the notebook. <br />On GitHub, the HTML representation is unable to render, please try loading this page with nbviewer.org.</b></div><div class="sk-container" hidden><div class="sk-item sk-dashed-wrapped"><div class="sk-label-container"><div class="sk-label sk-toggleable"><input class="sk-toggleable__control sk-hidden--visually" id="sk-estimator-id-7" type="checkbox" ><label for="sk-estimator-id-7" class="sk-toggleable__label sk-toggleable__label-arrow">TransformedTargetRegressor</label><div class="sk-toggleable__content"><pre>TransformedTargetRegressor(func=<ufunc 'log1p'>, inverse_func=<ufunc 'expm1'>, regressor=LGBMRegressor(colsample_bytree=0.5439642175304692, learning_rate=0.04090453688322824, max_depth=19, min_child_samples=12, n_estimators=788, n_jobs=-1, num_leaves=69, random_state=42, reg_alpha=0.4583079398945705, reg_lambda=29.248167932522765, subsample=0.8659762900446526, verbose=-1))</pre></div></div></div><div class="sk-parallel"><div class="sk-parallel-item"><div class="sk-item"><div class="sk-label-container"><div class="sk-label sk-toggleable"><input class="sk-toggleable__control sk-hidden--visually" id="sk-estimator-id-8" type="checkbox" ><label for="sk-estimator-id-8" class="sk-toggleable__label sk-toggleable__label-arrow">regressor: LGBMRegressor</label><div class="sk-toggleable__content"><pre>LGBMRegressor(colsample_bytree=0.5439642175304692, learning_rate=0.04090453688322824, max_depth=19, min_child_samples=12, n_estimators=788, n_jobs=-1, num_leaves=69, random_state=42, reg_alpha=0.4583079398945705, reg_lambda=29.248167932522765, subsample=0.8659762900446526, verbose=-1)</pre></div></div></div><div class="sk-serial"><div class="sk-item"><div class="sk-estimator sk-toggleable"><input class="sk-toggleable__control sk-hidden--visually" id="sk-estimator-id-9" type="checkbox" ><label for="sk-estimator-id-9" class="sk-toggleable__label sk-toggleable__label-arrow">LGBMRegressor</label><div class="sk-toggleable__content"><pre>LGBMRegressor(colsample_bytree=0.5439642175304692, learning_rate=0.04090453688322824, max_depth=19, min_child_samples=12, n_estimators=788, n_jobs=-1, num_leaves=69, random_state=42, reg_alpha=0.4583079398945705, reg_lambda=29.248167932522765, subsample=0.8659762900446526, verbose=-1)</pre></div></div></div></div></div></div></div></div></div></div>
mean_squared_log_error(y_valid, lgbm_reg_1.predict(X_valid), squared=False)
0.1477381305885499
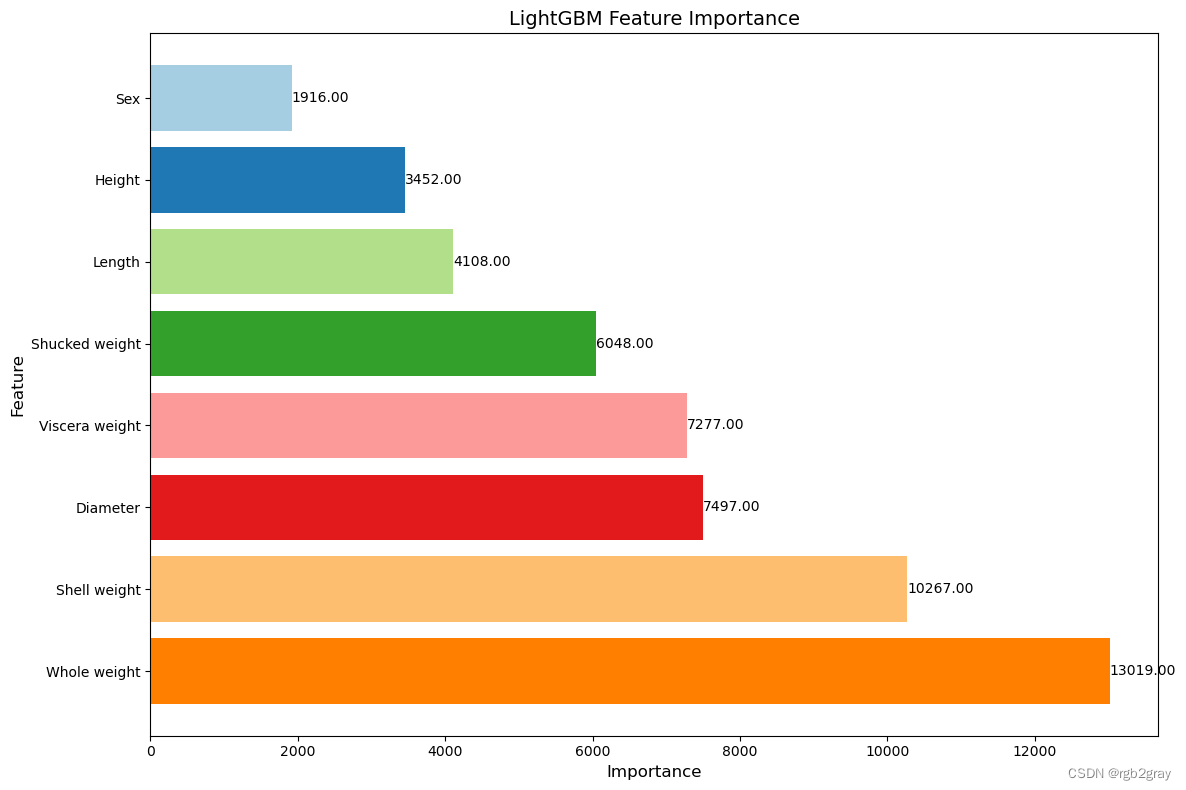
feature_importance = lgbm_reg_1.regressor_.feature_importances_

feature_names = X_train.columns

sorted_indices = feature_importance.argsort()
sorted_importance = feature_importance[sorted_indices]
sorted_features = feature_names[sorted_indices]

# Plot feature importance
plt.figure(figsize=(12, 8))
colors = plt.cm.Paired.colors[:len(sorted_features)]
plt.barh(sorted_features, sorted_importance, color=colors)
plt.xlabel('Importance', fontsize=12)
plt.ylabel('Feature', fontsize=12)
plt.title('LightGBM Feature Importance', fontsize=14)
plt.gca().invert_yaxis()

for i, v in enumerate(sorted_importance):
    plt.text(v + 0.02, i, f'{v:.2f}', color='black', va='center', fontsize=10)

plt.tight_layout()
plt.show()
LIGHTGbm 2
lgbm_params_2 = {
    'n_jobs': -1,
    'verbose': -1,
    'max_depth': 20,
    'num_leaves': 165,
    'subsample_freq': 1,
    'random_state': 42,
    'n_estimators': 1460,
    'min_child_samples': 25,
    'reg_lambda': 6.13475387151606,
    'subsample': 0.8036874216939632,
    'reg_alpha': 0.3152990674231573,
    'learning_rate': 0.009336479469693189,
    'colsample_bytree': 0.5780931837049811,
    'min_child_weight': 0.37333232256934057,
}
lgbm_reg_2 = TransformedTargetRegressor(lightgbm.LGBMRegressor(**lgbm_params_2),
                                                 func=np.log1p,
                                                 inverse_func=np.expm1)
lgbm_reg_2.fit(X_train, y_train)
TransformedTargetRegressor(func=<ufunc 'log1p'>, inverse_func=<ufunc 'expm1'>,regressor=LGBMRegressor(colsample_bytree=0.5780931837049811, learning_rate=0.009336479469693189, max_depth=20, min_child_samples=25, min_child_weight=0.37333232256934057, n_estimators=1460, n_jobs=-1, num_leaves=165, random_state=42, reg_alpha=0.3152990674231573, reg_lambda=6.13475387151606, subsample=0.8036874216939632, subsample_freq=1, verbose=-1))</pre><b>In a Jupyter environment, please rerun this cell to show the HTML representation or trust the notebook. <br />On GitHub, the HTML representation is unable to render, please try loading this page with nbviewer.org.</b></div><div class="sk-container" hidden><div class="sk-item sk-dashed-wrapped"><div class="sk-label-container"><div class="sk-label sk-toggleable"><input class="sk-toggleable__control sk-hidden--visually" id="sk-estimator-id-10" type="checkbox" ><label for="sk-estimator-id-10" class="sk-toggleable__label sk-toggleable__label-arrow">TransformedTargetRegressor</label><div class="sk-toggleable__content"><pre>TransformedTargetRegressor(func=<ufunc 'log1p'>, inverse_func=<ufunc 'expm1'>, regressor=LGBMRegressor(colsample_bytree=0.5780931837049811, learning_rate=0.009336479469693189, max_depth=20, min_child_samples=25, min_child_weight=0.37333232256934057, n_estimators=1460, n_jobs=-1, num_leaves=165, random_state=42, reg_alpha=0.3152990674231573, reg_lambda=6.13475387151606, subsample=0.8036874216939632, subsample_freq=1, verbose=-1))</pre></div></div></div><div class="sk-parallel"><div class="sk-parallel-item"><div class="sk-item"><div class="sk-label-container"><div class="sk-label sk-toggleable"><input class="sk-toggleable__control sk-hidden--visually" id="sk-estimator-id-11" type="checkbox" ><label for="sk-estimator-id-11" class="sk-toggleable__label sk-toggleable__label-arrow">regressor: LGBMRegressor</label><div class="sk-toggleable__content"><pre>LGBMRegressor(colsample_bytree=0.5780931837049811, learning_rate=0.009336479469693189, max_depth=20, min_child_samples=25, min_child_weight=0.37333232256934057, n_estimators=1460, n_jobs=-1, num_leaves=165, random_state=42, reg_alpha=0.3152990674231573, reg_lambda=6.13475387151606, subsample=0.8036874216939632, subsample_freq=1, verbose=-1)</pre></div></div></div><div class="sk-serial"><div class="sk-item"><div class="sk-estimator sk-toggleable"><input class="sk-toggleable__control sk-hidden--visually" id="sk-estimator-id-12" type="checkbox" ><label for="sk-estimator-id-12" class="sk-toggleable__label sk-toggleable__label-arrow">LGBMRegressor</label><div class="sk-toggleable__content"><pre>LGBMRegressor(colsample_bytree=0.5780931837049811, learning_rate=0.009336479469693189, max_depth=20, min_child_samples=25, min_child_weight=0.37333232256934057, n_estimators=1460, n_jobs=-1, num_leaves=165, random_state=42, reg_alpha=0.3152990674231573, reg_lambda=6.13475387151606, subsample=0.8036874216939632, subsample_freq=1, verbose=-1)</pre></div></div></div></div></div></div></div></div></div></div>
mean_squared_log_error(y_valid, lgbm_reg_2.predict(X_valid), squared=False)
0.14758741259851116
CatBoost
def cb_objective(trial):
    params = {
        "learning_rate": trial.suggest_float("learning_rate", 0.01, 0.5),
        "max_depth": trial.suggest_int("depth", 4, 16),
        "l2_leaf_reg": trial.suggest_float("l2_leaf_reg", 1, 10),
        "n_estimators": trial.suggest_int("n_estimators", 100, 1500),
        "colsample_bylevel": trial.suggest_float("colsample_bylevel", 0.5, 1.0),
    }

    cb_reg = TransformedTargetRegressor(catboost.CatBoostRegressor(**params, random_state=42, grow_policy='SymmetricTree',
                                                                  random_strength=0, cat_features=["Sex"], loss_function="RMSE"),
                                                     func=np.log1p,
                                                     inverse_func=np.expm1)
    cb_reg.fit(X_train, y_train, eval_set=[(X_valid, y_valid)], verbose=False)

    val_scores = np.sqrt(mean_squared_log_error(y_valid, np.abs(cb_reg.predict(X_valid))))
    return val_scores

sampler = optuna.samplers.TPESampler(seed=42)  # Using Tree-structured Parzen Estimator sampler for optimization
cb_study = optuna.create_study(direction = 'minimize',study_name="CBRegressor", sampler=sampler)
[I 2024-04-25 16:46:44,532] A new study created in memory with name: CBRegressor
if TUNE:
    cb_study.optimize(cb_objective, 30)
CatBoost 1
cb_params_1 = {
    'grow_policy': 'SymmetricTree',
    'n_estimators': 1000,
    'learning_rate': 0.128912681527133,
    'l2_leaf_reg': 1.836927907521674,
    'max_depth': 6,
    'colsample_bylevel': 0.6775373040510968,
    'random_strength': 0,
    'boost_from_average': True,
    'loss_function': 'RMSE',
    'cat_features': ['Sex'],
    'verbose': False
    }
cat_reg_1 = TransformedTargetRegressor(catboost.CatBoostRegressor(**cb_params_1),
                                                 func=np.log1p,
                                                 inverse_func=np.expm1)
cat_reg_1.fit(X_train, y_train)
TransformedTargetRegressor(func=<ufunc 'log1p'>, inverse_func=<ufunc 'expm1'>,regressor=<catboost.core.CatBoostRegressor object at 0x0000021D08EB7310>)</pre><b>In a Jupyter environment, please rerun this cell to show the HTML representation or trust the notebook. <br />On GitHub, the HTML representation is unable to render, please try loading this page with nbviewer.org.</b></div><div class="sk-container" hidden><div class="sk-item sk-dashed-wrapped"><div class="sk-label-container"><div class="sk-label sk-toggleable"><input class="sk-toggleable__control sk-hidden--visually" id="sk-estimator-id-13" type="checkbox" ><label for="sk-estimator-id-13" class="sk-toggleable__label sk-toggleable__label-arrow">TransformedTargetRegressor</label><div class="sk-toggleable__content"><pre>TransformedTargetRegressor(func=<ufunc 'log1p'>, inverse_func=<ufunc 'expm1'>, regressor=<catboost.core.CatBoostRegressor object at 0x0000021D08EB7310>)</pre></div></div></div><div class="sk-parallel"><div class="sk-parallel-item"><div class="sk-item"><div class="sk-label-container"><div class="sk-label sk-toggleable"><input class="sk-toggleable__control sk-hidden--visually" id="sk-estimator-id-14" type="checkbox" ><label for="sk-estimator-id-14" class="sk-toggleable__label sk-toggleable__label-arrow">regressor: CatBoostRegressor</label><div class="sk-toggleable__content"><pre><catboost.core.CatBoostRegressor object at 0x0000021D08EB7310></pre></div></div></div><div class="sk-serial"><div class="sk-item"><div class="sk-estimator sk-toggleable"><input class="sk-toggleable__control sk-hidden--visually" id="sk-estimator-id-15" type="checkbox" ><label for="sk-estimator-id-15" class="sk-toggleable__label sk-toggleable__label-arrow">CatBoostRegressor</label><div class="sk-toggleable__content"><pre><catboost.core.CatBoostRegressor object at 0x0000021D08EB7310></pre></div></div></div></div></div></div></div></div></div></div>
mean_squared_log_error(y_valid, cat_reg_1.predict(X_valid), squared=False)
0.14824841372252795
CatBoost 2
cb_params_2 = {
    'depth': 15,
    'verbose': 0,
    'max_bin': 464,
    'verbose': False,
    'random_state':42,
    'task_type': 'CPU',
    'random_state': 42,
    'min_data_in_leaf': 78,
    'loss_function': 'RMSE',
    'grow_policy': 'Lossguide',
    'bootstrap_type': 'Bernoulli',
    'subsample': 0.83862137638162,
    'l2_leaf_reg': 8.365422739510098,
    'random_strength': 3.296124856352495,
    'learning_rate': 0.09992185242598203,
}
cat_reg_2 = TransformedTargetRegressor(catboost.CatBoostRegressor(**cb_params_2),
                                                 func=np.log1p,
                                                 inverse_func=np.expm1)
cat_reg_2.fit(X_train, y_train)
TransformedTargetRegressor(func=<ufunc 'log1p'>, inverse_func=<ufunc 'expm1'>,regressor=<catboost.core.CatBoostRegressor object at 0x0000021D088EB4C0>)</pre><b>In a Jupyter environment, please rerun this cell to show the HTML representation or trust the notebook. <br />On GitHub, the HTML representation is unable to render, please try loading this page with nbviewer.org.</b></div><div class="sk-container" hidden><div class="sk-item sk-dashed-wrapped"><div class="sk-label-container"><div class="sk-label sk-toggleable"><input class="sk-toggleable__control sk-hidden--visually" id="sk-estimator-id-16" type="checkbox" ><label for="sk-estimator-id-16" class="sk-toggleable__label sk-toggleable__label-arrow">TransformedTargetRegressor</label><div class="sk-toggleable__content"><pre>TransformedTargetRegressor(func=<ufunc 'log1p'>, inverse_func=<ufunc 'expm1'>, regressor=<catboost.core.CatBoostRegressor object at 0x0000021D088EB4C0>)</pre></div></div></div><div class="sk-parallel"><div class="sk-parallel-item"><div class="sk-item"><div class="sk-label-container"><div class="sk-label sk-toggleable"><input class="sk-toggleable__control sk-hidden--visually" id="sk-estimator-id-17" type="checkbox" ><label for="sk-estimator-id-17" class="sk-toggleable__label sk-toggleable__label-arrow">regressor: CatBoostRegressor</label><div class="sk-toggleable__content"><pre><catboost.core.CatBoostRegressor object at 0x0000021D088EB4C0></pre></div></div></div><div class="sk-serial"><div class="sk-item"><div class="sk-estimator sk-toggleable"><input class="sk-toggleable__control sk-hidden--visually" id="sk-estimator-id-18" type="checkbox" ><label for="sk-estimator-id-18" class="sk-toggleable__label sk-toggleable__label-arrow">CatBoostRegressor</label><div class="sk-toggleable__content"><pre><catboost.core.CatBoostRegressor object at 0x0000021D088EB4C0></pre></div></div></div></div></div></div></div></div></div></div>
mean_squared_log_error(y_valid, cat_reg_2.predict(X_valid), squared=False)
0.14774083919007364
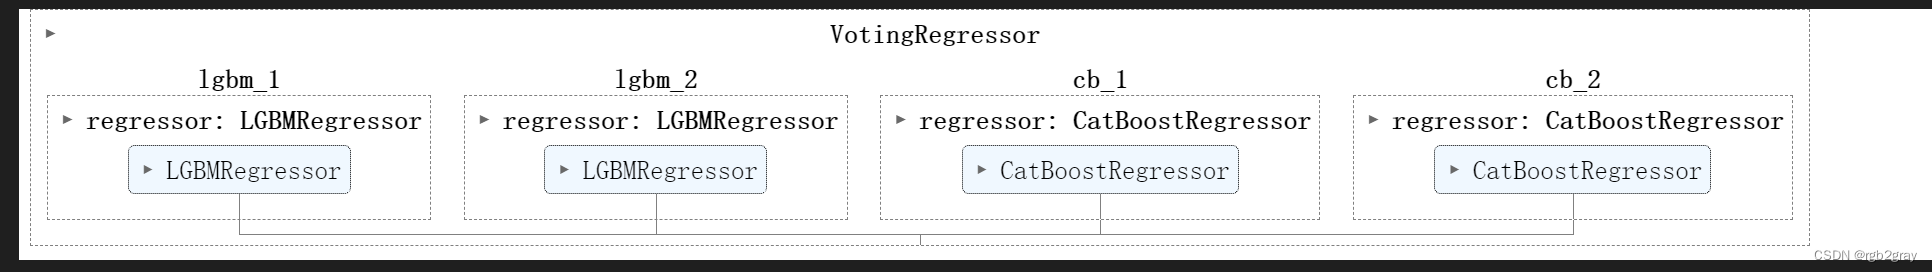
Ensembling the Results Using VotingRegressor 使用 VotingRegressor 组合结果
# weights = [0.025, 0.025, 0.275, 0.275, 0.05, 0.35]

ensemble = VotingRegressor(
    [
#         ("xgb_1", xgb_reg_1),
#         ("xgb_2", xgb_reg_2),
        ("lgbm_1", lgbm_reg_1),
        ("lgbm_2", lgbm_reg_2),
        ("cb_1", cat_reg_1),
        ("cb_2", cat_reg_2)
    ]
)
ensemble.fit(X, y)
Submit the Output
pred = ensemble.predict(test.drop("id", axis=1))
submission = pd.DataFrame(test.id)
submission["Rings"] = pred
submission.to_csv("submission.csv", index=False)

![[linux] <span style='color:red;'>kaggle</span> <span style='color:red;'>数据</span><span style='color:red;'>集</span>用linux下载](https://img-blog.csdnimg.cn/direct/3d4b4523342545649637489025113d1d.png)

![[pytorch入门] <span style='color:red;'>4</span>. torchvision中<span style='color:red;'>数据</span><span style='color:red;'>集</span><span style='color:red;'>的</span>使用](https://img-blog.csdnimg.cn/direct/5289053ffdbf43c39043b158e3518646.png)