最近在做毕设的后台管理系统,刚好需要做数据动态可视化的功能,就来记录一下具体的实现方式吧!
在开始之前就不阐述用vue创建项目的具体步骤了,主要详细讲解一下vue3、echarts和nodejs三者之间是如何实现数据的动态显示的,我这边项目是使用的vite创建的。
一、安装echarts
在vscode的终端利用npm进行以下命令
npm install echarts二、引用、使用echarts
(1)在需要使用的组件中引入echarts
import * as echarts from 'echarts'(2)接下来就是如何使用该组件了,这里通过一个案例来展示
<template>
<div class="food-sale">
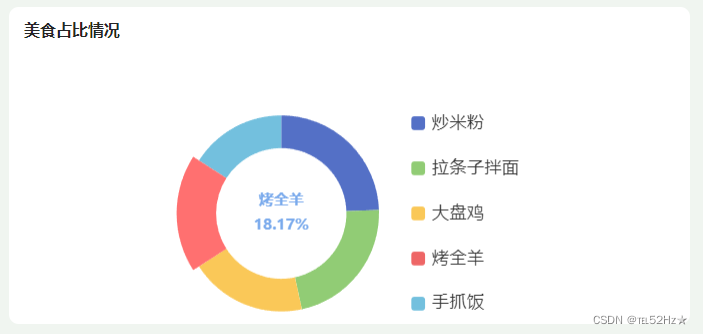
<h4>美食占比情况</h4>
<div class="food-cahrt" ref="foodChart"></div>
</div>
</template>
<script setup>
import {ref,onMounted,onBeforeMount} from 'vue'
import * as echarts from 'echarts'
import { fontSize } from '@/utils/fontSize'
const foodChart=ref(null)
let myfoodChart=null
//定义数据变量
const foodData=ref([
{
name:'',
value:''
}
])
const initChart=()=>{
myfoodChart=echarts.init(foodChart.value)
const option={
tooltip: {
trigger: 'item',
backgroundColor:'rgba(62, 177, 52, .6)',
textStyle:{
color:'#cfd',
}
},
legend: {
orient: 'vertical',//设置图例的方向
right: '5%',
top: "center",
itemWidth: 10, // 图标宽设置
itemHeight: 10, // 图标长设置
itemGap:20,//设置图例的间距
textStyle: {
fontSize: fontSize(35),
fontFamily: 'sy-m',
}
},
series: [
{
// name: '实时设备',
type: 'pie',
radius: ['40%', '60%'],
avoidLabelOverlap: false,
label: {
show: false,
position: 'center'
},
emphasis: {
label: {
show: true,
// fontSize:12,
fontSize:fontSize(30),
fontWeight:600,
lineHeight: 18,
color:'rgb(122, 170, 236)',
formatter: '{b}\n{d}%',
rich: { // 显示出的内容,设置样式
b: {
fontSize: fontSize(16),
color:'rgb(66, 127, 212)',
align: 'center'
},
d: {
fontSize: fontSize(20),
padding: 0,
}
}
}
},
labelLine: {
show: false
},
data:foodData.value
}
]
}
myfoodChart.setOption(option)
//设置饼图自动转动
let count = 0;
setInterval(() => {
myfoodChart.dispatchAction({
type: 'downplay',
seriesIndex: 0,
dataIndex: count
});
count++;
if (count === 5) {
count = 0;
}
myfoodChart.dispatchAction({
type: 'highlight',
seriesIndex: 0,
dataIndex: count
});
}, 2000);
}
// 图表自适应
const resizeChart = () => {
myfoodChart.resize()
}
onMounted(() => {
initChart()
window.addEventListener('resize', resizeChart)
})
onBeforeMount(()=>{
window.removeEventListener('resize', resizeChart)
})
</script>
<style lang='less' scoped>
.food-sale{
width: 43%;
height: 16.5vw;
background: #fff;
margin-top: 1vw;
border-radius:0.5vw;
h4{
font-size: 16px;
padding-left: 0.8vw;
padding-top: 0.5vw;
}
.food-cahrt{
width: 80%;
height: 17vw;
}
}
</style>三、利用nodejs模拟数据
上述是前端需要实现的页面部分,接下来是如何利用nodejs来模拟页面所需的后端数据
(1)在cmd上输入以下命令,注意此命令只可安装一次
npm install express-generator -g(2)然后进入你自己创建的项目目录输入下面的命令,此步骤是在cmd中操作
express --view=ejs server(3)打开服务文件夹
cd server(4)在server文件中的routes中会有一个index.js文件,在此文件中进行模拟数据
router.get("/api/home/food",function(req, res, next){
   return res.json({
     "code":200,
     "data":{
            list:[
                {
                    name:'炒米粉',
                    value:10840
                },
                {
                    name:'拉条子拌面',
                    value:9840
                },
                {
                    name:'大盘鸡',
                    value:8560
                },
                {
                    name:'烤全羊',
                    value:8060
                },
                {
                    name:'手抓饭',
                    value:7060
                },
            ]
        }
   });
})
四、获取数据
(1)在src文件夹下新建一个名为api的文件夹,里面新建一个名为homeData.js的文件获取数据
import { get, post} from "@/utils/http.js";
//获取用户信息数据
export const getFoodList = (params) => get('/api/home/food',params);
(2)在上述需要用到该数据的组件中引入此文件
import {getFoodList} from '@/api/homeData'(3)获取数据
获取图表数据
const getChartData=()=>{
    return new Promise((resolve, reject) =>{
        getFoodList().then(res=>{
            if(res.code===200&&res.data){
                // console.log(res,'shuju')
                foodData.value=[]
                res.data.forEach((item,index)=>{
                    foodData.value[index]={
                        name:item.name,
                        value:item.value
                    }
                })
                // console.log(chartData.xAxis,'xshuju')
            }
            // console.log(res.data,'shuju')
            resolve(res.data)
        })
        .catch(error=>{
            reject(error)
        })
    })
}
(4)挂载数据
onMounted(async() => {
   await getChartData()
})
五、结果展示