概述
在企业数字化转型的过程中,ERP系统与数据平台作为核心支撑工具,对于提升运营效率、优化决策支持、实现业务流程一体化起着至关重要的作用。然而,智能报表与报表的智能化合并作为其中的重要领域,却往往面临诸多挑战与难点,这不仅关乎企业能否充分利用数据资产,更直接影响到数字化转型的深度与成效。
智能报表是现代企业数据分析与决策支持的关键组成部分,它以ERP系统和数据平台为基础,通过自动化、智能化手段对海量业务数据进行抽取、清洗、整合与可视化呈现,旨在为各级管理人员提供实时、精准、易于理解的业务洞察。
尽管智能报表与报表智能化合并的价值显而易见,但在实际实施过程中,企业往往会遭遇以下几方面的难点:
1、数据质量与一致性:原始数据可能存在缺失、错误、不一致等问题,需要建立严格的数据治理机制,确保报表数据的准确性和可靠性。
2、系统集成与接口开发:对接不同系统、数据源需要复杂的接口开发与数据映射工作,技术难度大,且易受系统升级、变更的影响。
3、用户需求多样性:不同角色的用户对报表格式、指标、时效性等方面的需求差异大,定制化需求可能导致报表开发与维护成本上升。
4、技术选型与平台兼容性:选择合适的报表工具和技术栈,既要满足现有系统的兼容性,又要具备足够的灵活性和扩展性以适应未来需求变化。
5、安全与权限管理:确保敏感数据在合并、传输、存储过程中的安全性,同时精细控制用户对报表的访问权限,防止数据泄露与滥用。
传统数据平台的报表合并的流程是:业务侧提供报表需求——>报表开发人员整理数据报表——>寻找相关字段——>SQL语句或者python code——>计算及报表合并——>反馈。
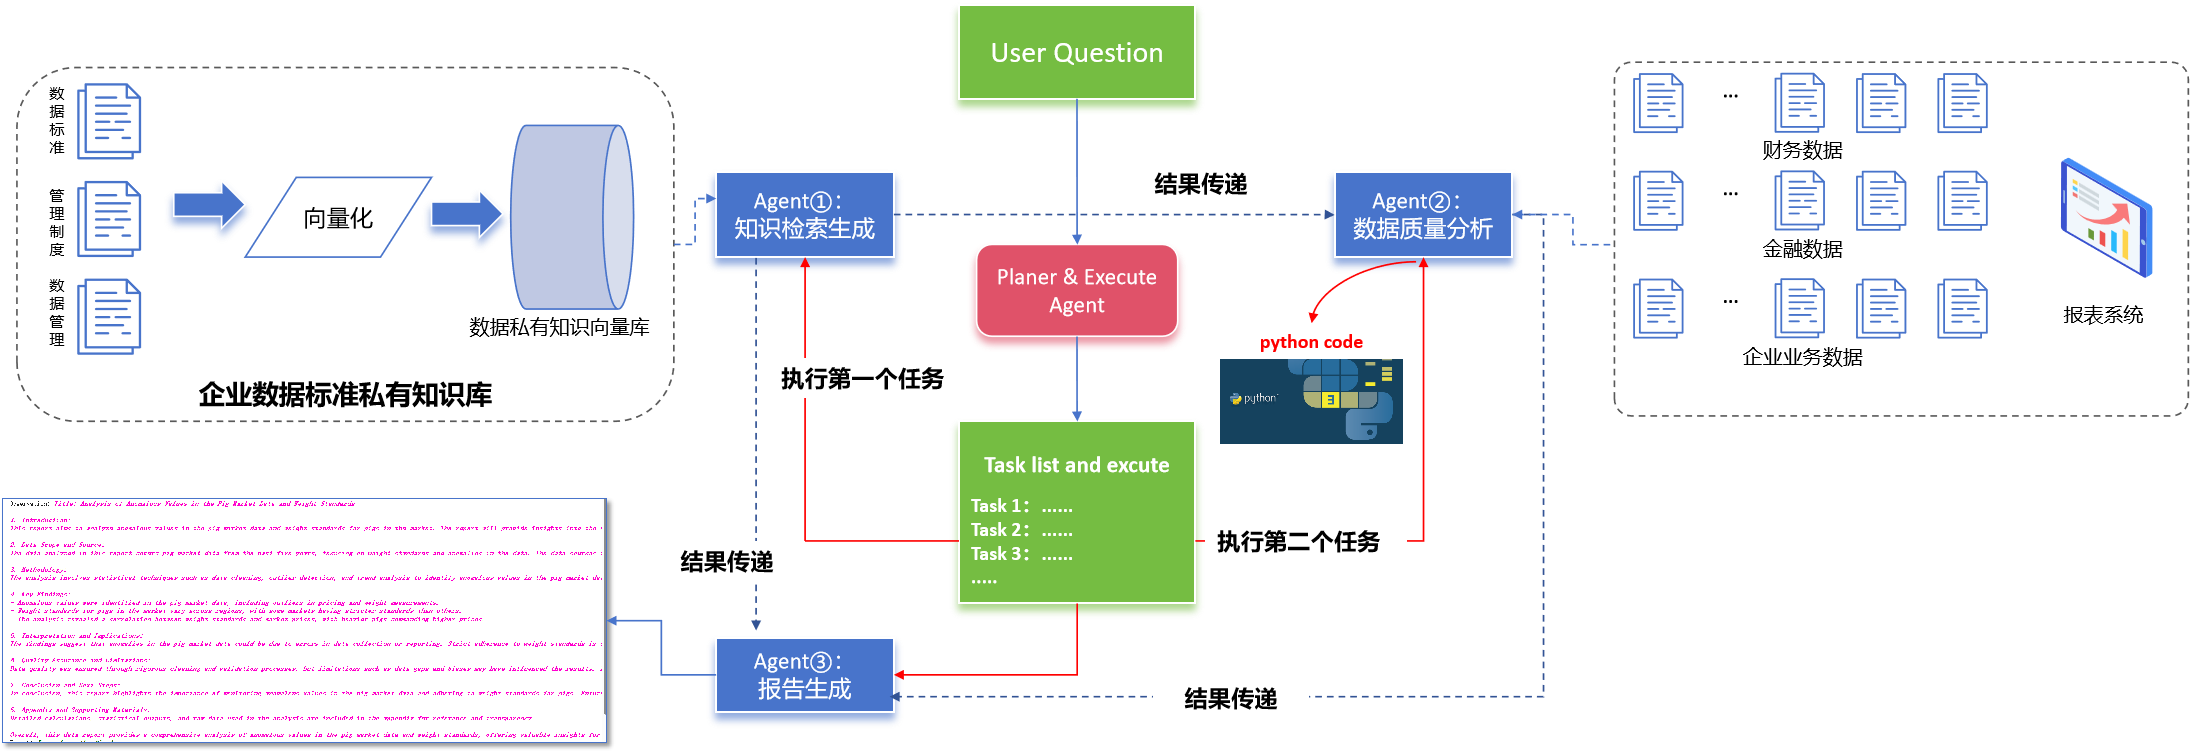
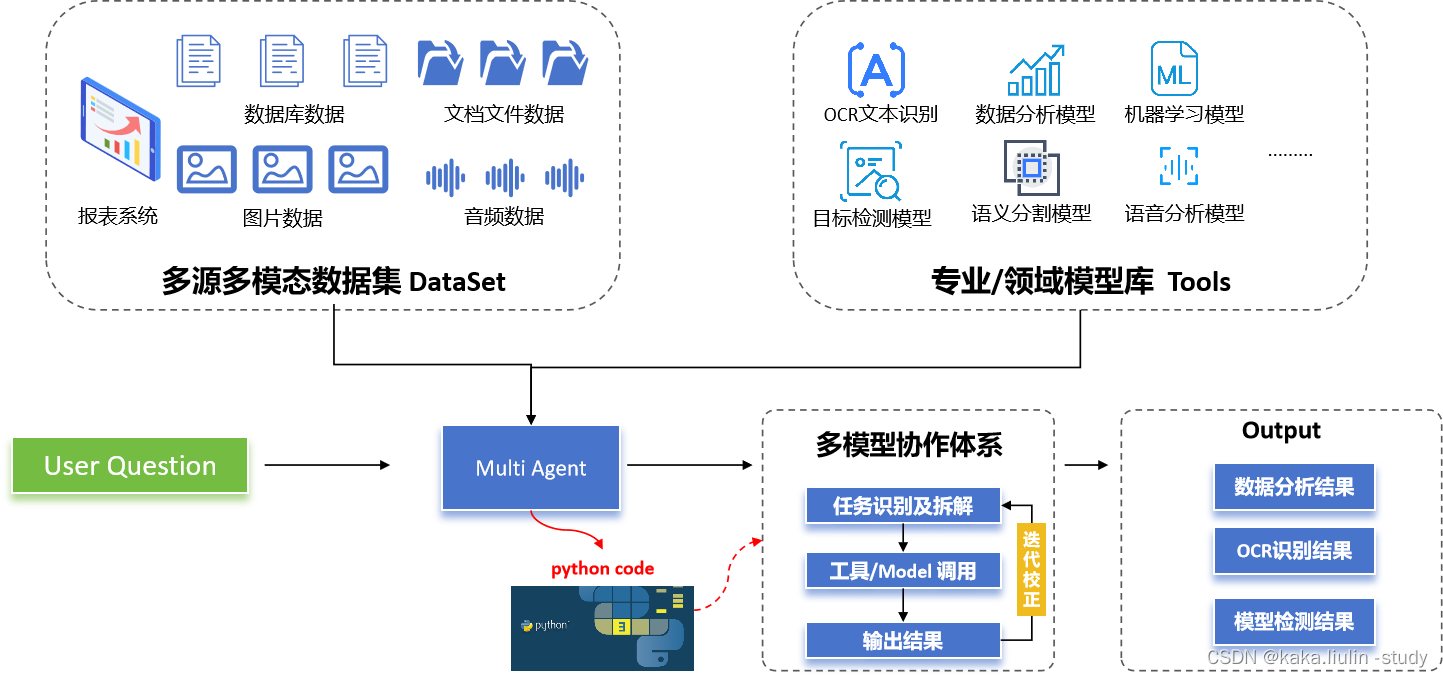
本次实践将尝试使用大模型构建智能报表系统,通过将数据库表信息归集之后输入大模型,利用大模型的代码生成能力完成报表的合并。
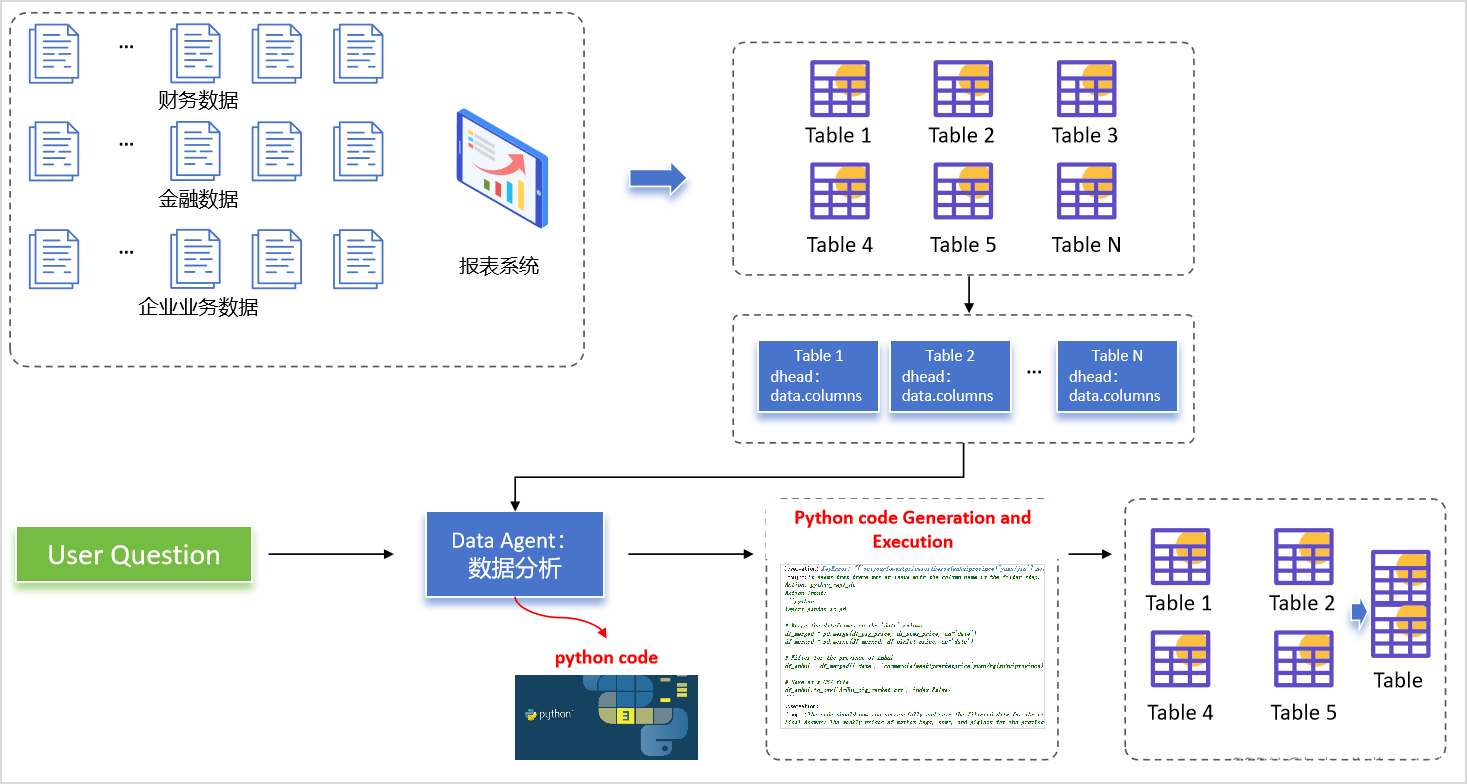
一、数据分析Agents构建
- python code Agent构建
数据读取:使用pandas导入数据文件
filepath = '/content/drive/MyDrive/LLM_Agents/data'
import pandas as pd
df_sows_price = pd.read_csv(filepath+'/Minimum price per week for weeded sows.csv')
df_piglet_price = pd.read_csv(filepath+'/Piglet weekly out price.csv')
df_pig_price = pd.read_csv(filepath+'/Weekly price of commercial pigs.csv')
工具搭建:搭建一个pythonarst 工具
repl = PythonAstREPLTool(
            locals={"df_sows_price": df_sows_price,'df_piglet_price':df_piglet_price,'df_pig_price':df_pig_price},
            name="python_repl_dt",
            description="The tool is used to generate Python code analysis based on the dataset,the dataset has two data: df_market and df_price ,runs the code and outputs both the code and the results of the computation.",
            #args_schema=PythonInputs,
            )
tools_dt = [repl]
提示词设计:提示词包含任务的基本描述、可使用工具信息、数据文件的基础信息及前五行数据
TEMPLATE_dt = """You are working with a pandas dataframe in Python.
The user's dataset pertains to information on the swine breeding market across various provinces and cities,
encompassing weekly prices of sows(named:df_sows_price), weekly prices of piglets (named:df_piglet_price), and weekly prices of market pigs(named:df_pig_price).

It is important to understand the attributes of the dataframe before working with it. This is the result of running `df.head().to_markdown()`

<df_piglet_price>
{df_piglet_pricehead}
</df_piglet_price>

<df_swos_price>
{df_sows_pricehead}
</df_sows_price>

<df_pig_price>
{df_pig_pricehead}
</df_pig_price>

You are not meant to use only these rows to answer questions - they are meant as a way of telling you about the shape and schema of the dataframe.
You also do not have use only the information here to answer questions - you can run intermediate queries to do exporatory data analysis to give you more information as needed.

You possess  essential tools:  `python_repl_dt`: With this tool, you can analyze and process the data retrieved from df using Python code.

When facing a question, assess whether you need to employ these tools iteratively.

"""
template_dt = TEMPLATE_dt.format(df_piglet_pricehead=df_piglet_price.head().to_markdown(),df_sows_pricehead=df_sows_price.head().to_markdown(),df_pig_pricehead=df_pig_price.head().to_markdown())
Agent搭建:使用ZeroShotAgent将提示词、工具、大模型llm组合起来形成一个数据分析智能体
agent_dt = ZeroShotAgent.from_llm_and_tools(
            llm=llm,
            tools=tools_dt,
            prefix=template_dt,
        )
agent_dt = AgentExecutor(agent=agent_dt, tools=tools_dt, max_iterations=150, handle_parsing_errors=True,early_stopping_method="generate",verbose=True)
二、实践及结果讨论
本次实践共使用三个数据文件:各省市的母猪出栏周度价格、仔猪出栏周度价格、商品猪出栏周度价格。
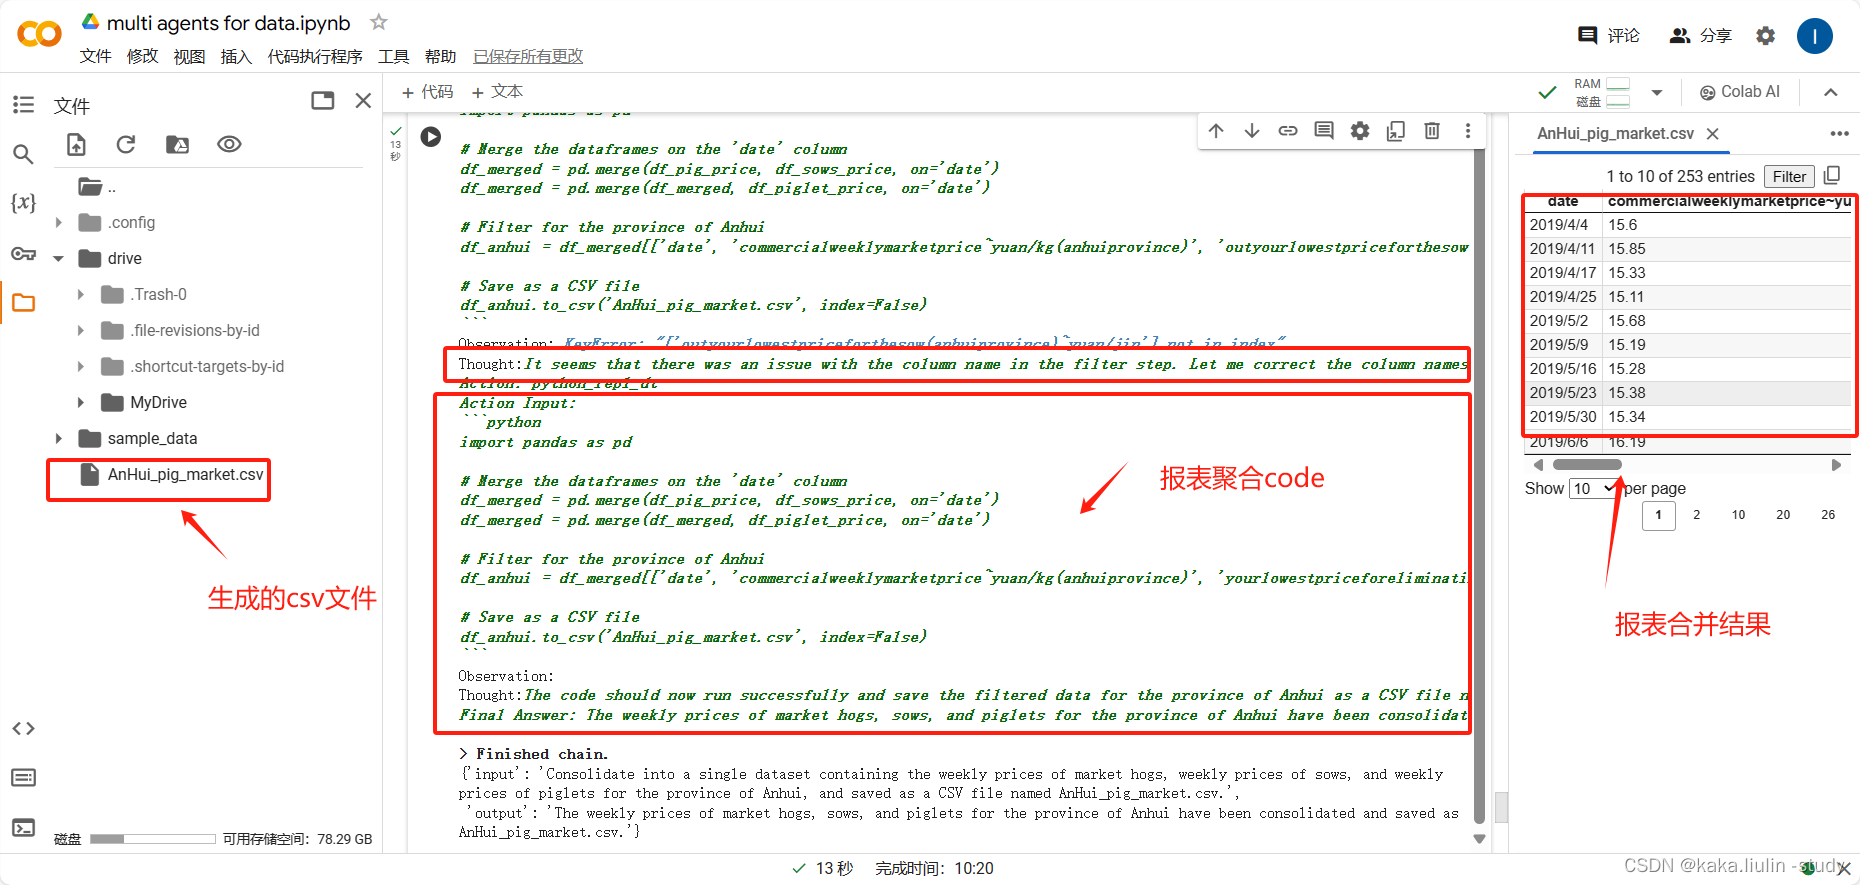
①、从多个表中抽取数据形成一个新的报表,不带计算
从母猪出栏周度价格、仔猪出栏周度价格、商品猪出栏周度价格三个独立的报表中抽取出安徽省的数据。
query = """Consolidate into a single dataset containing the weekly prices of market hogs, weekly prices of sows, and weekly prices of piglets for the province of Anhui, and saved as a CSV file named AnHui_pig_market.csv."""
agent_dt.invoke({'input':query})
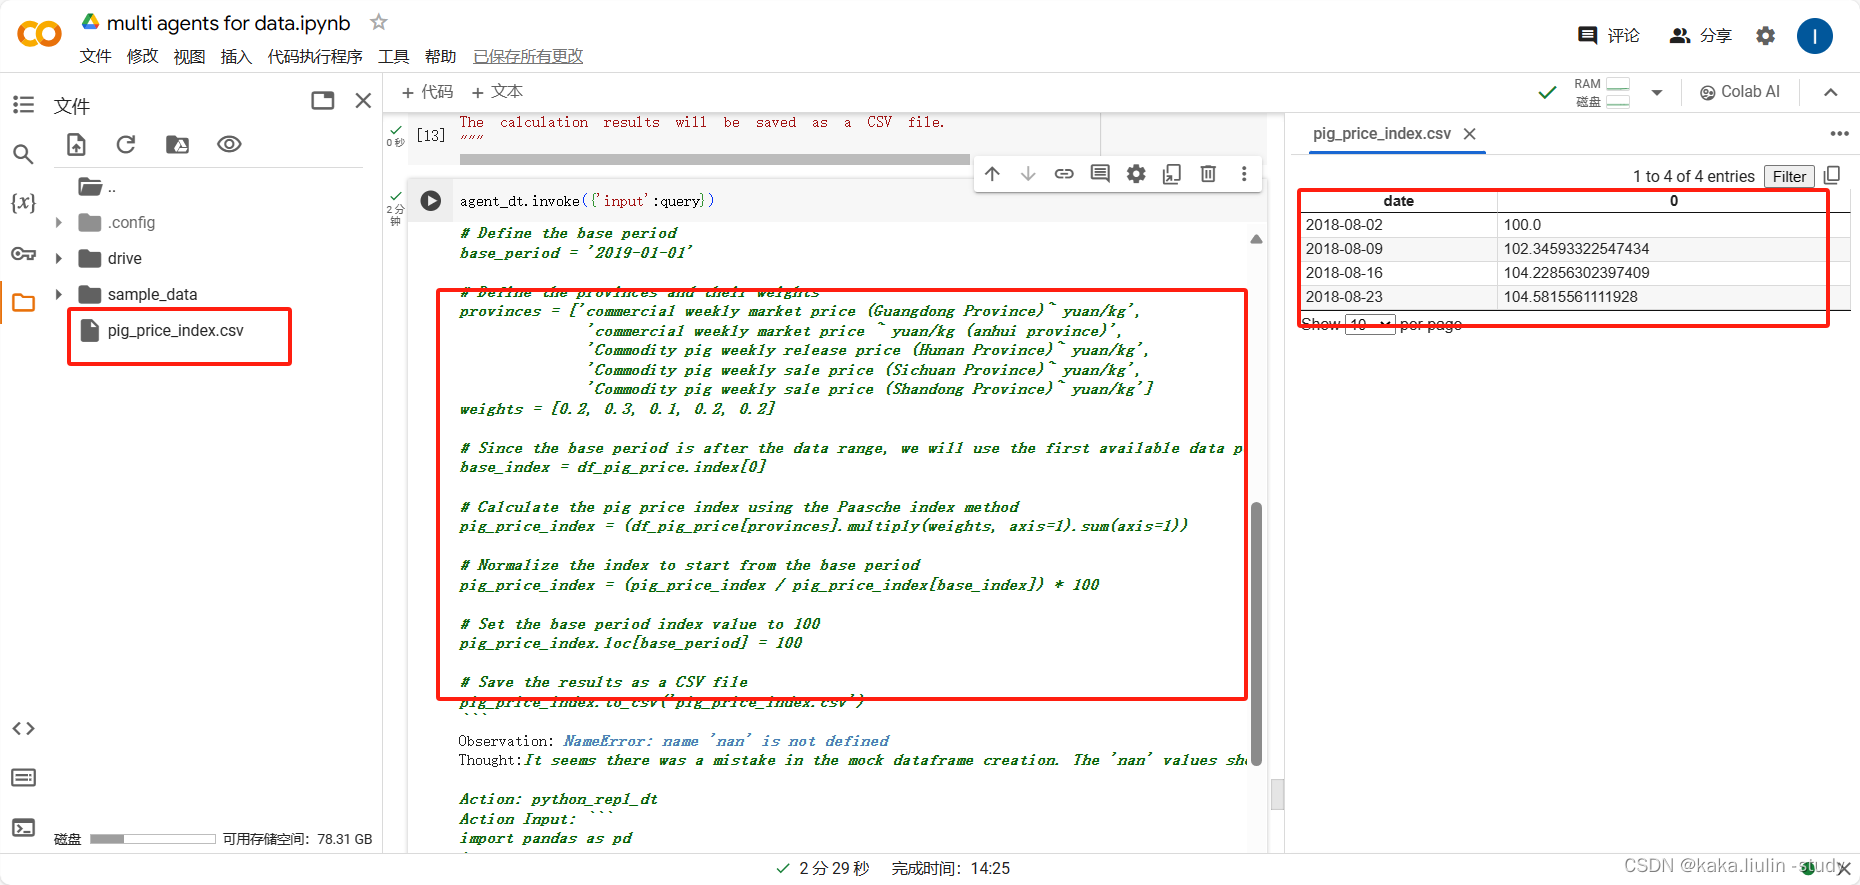
②、从单个表中抽取数据并做一定的计算形成一个新的报表
从商品猪出栏价格数据中抽取出广东省、安徽省、湖南省、四川省、山东省的数据,并使用帕勒托指数计算方法计算商品猪出栏价格指数,基准期设定为2019年1月4日,各省市的权重分别为:0.2, 0.3, 0.1, 0.2, 0.2.
query = """
Now, we need to calculate a pig price index based on the market price of commercial pigs.
First, remove any anomalous data from the commercial pigs dataset.
The data scope includes the market prices of commercial pigs from five provinces: Guangdong, Anhui, Hunan, Sichuan, and Shandong.
The Paasche index method will be employed for the compilation work, with the base period fixed at January 4, 2019, specifically referencing the provincial live pig market prices on that date,Index data is expressed on a percentage basis.
The weights for the above five provinces are 0.2, 0.3, 0.1, 0.2, and 0.2, respectively.
The calculation results will be saved as a CSV file.
"""
agent_dt.invoke({'input':query})
③ 生成一段报表合并的python code
query = 'Given the dataset situation, provide a code snippet to accomplish the following tasks: retrieve the market pig slaughter price data for Anhui Province and Guangdong Province, and compute their difference.'
agent_dt.invoke({'input':query})


![[HFCTF 2021 Final]easyflask](https://img-blog.csdnimg.cn/direct/6c991b489ed74927b853be4fbcb49fae.png)