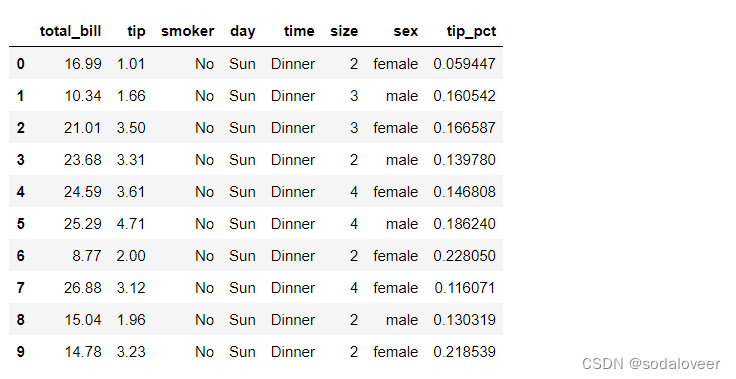
示例文件
import pandas as pd
import numpy as np
import datetime
today=str(datetime.date.today())
filepath='/Users/kangyongqing/Documents/kangyq/202404/NPS评分/'
file1='05NPS信息匹配分析2024-04-22.xlsx'
#从第三行开始读取列名,第一列作为索引
df1=pd.read_excel(filepath+file1,sheet_name='班型&年龄(季度)',header=0,index_col=0)
#缺失值填充,fillna(method='ffill'使用前一个值填充缺失值,fillna(method='bfill')使用后一个值填充缺失值
#新版本中直接使用ffill(),bfill(),老方法将报错
df1.loc['班型']=df1.loc['班型'].ffill()
df1.columns=df1.loc['班型',:]+df1.loc['年龄',:]
df1.index.name='季度'
df1.drop(index=['Qut','班型','年龄'],inplace=True)
print(df1.columns,df1.index)
print(df1.head(5))
print(df1.shape)
df2=df1.iloc[:,6:]
x=df2.index
y=df2.values
df2=df1.iloc[1:,7:]
print(df2)
import seaborn as sns
import matplotlib.pyplot as plt
plt.figure(figsize=(10,6))
sns.lineplot(df2)
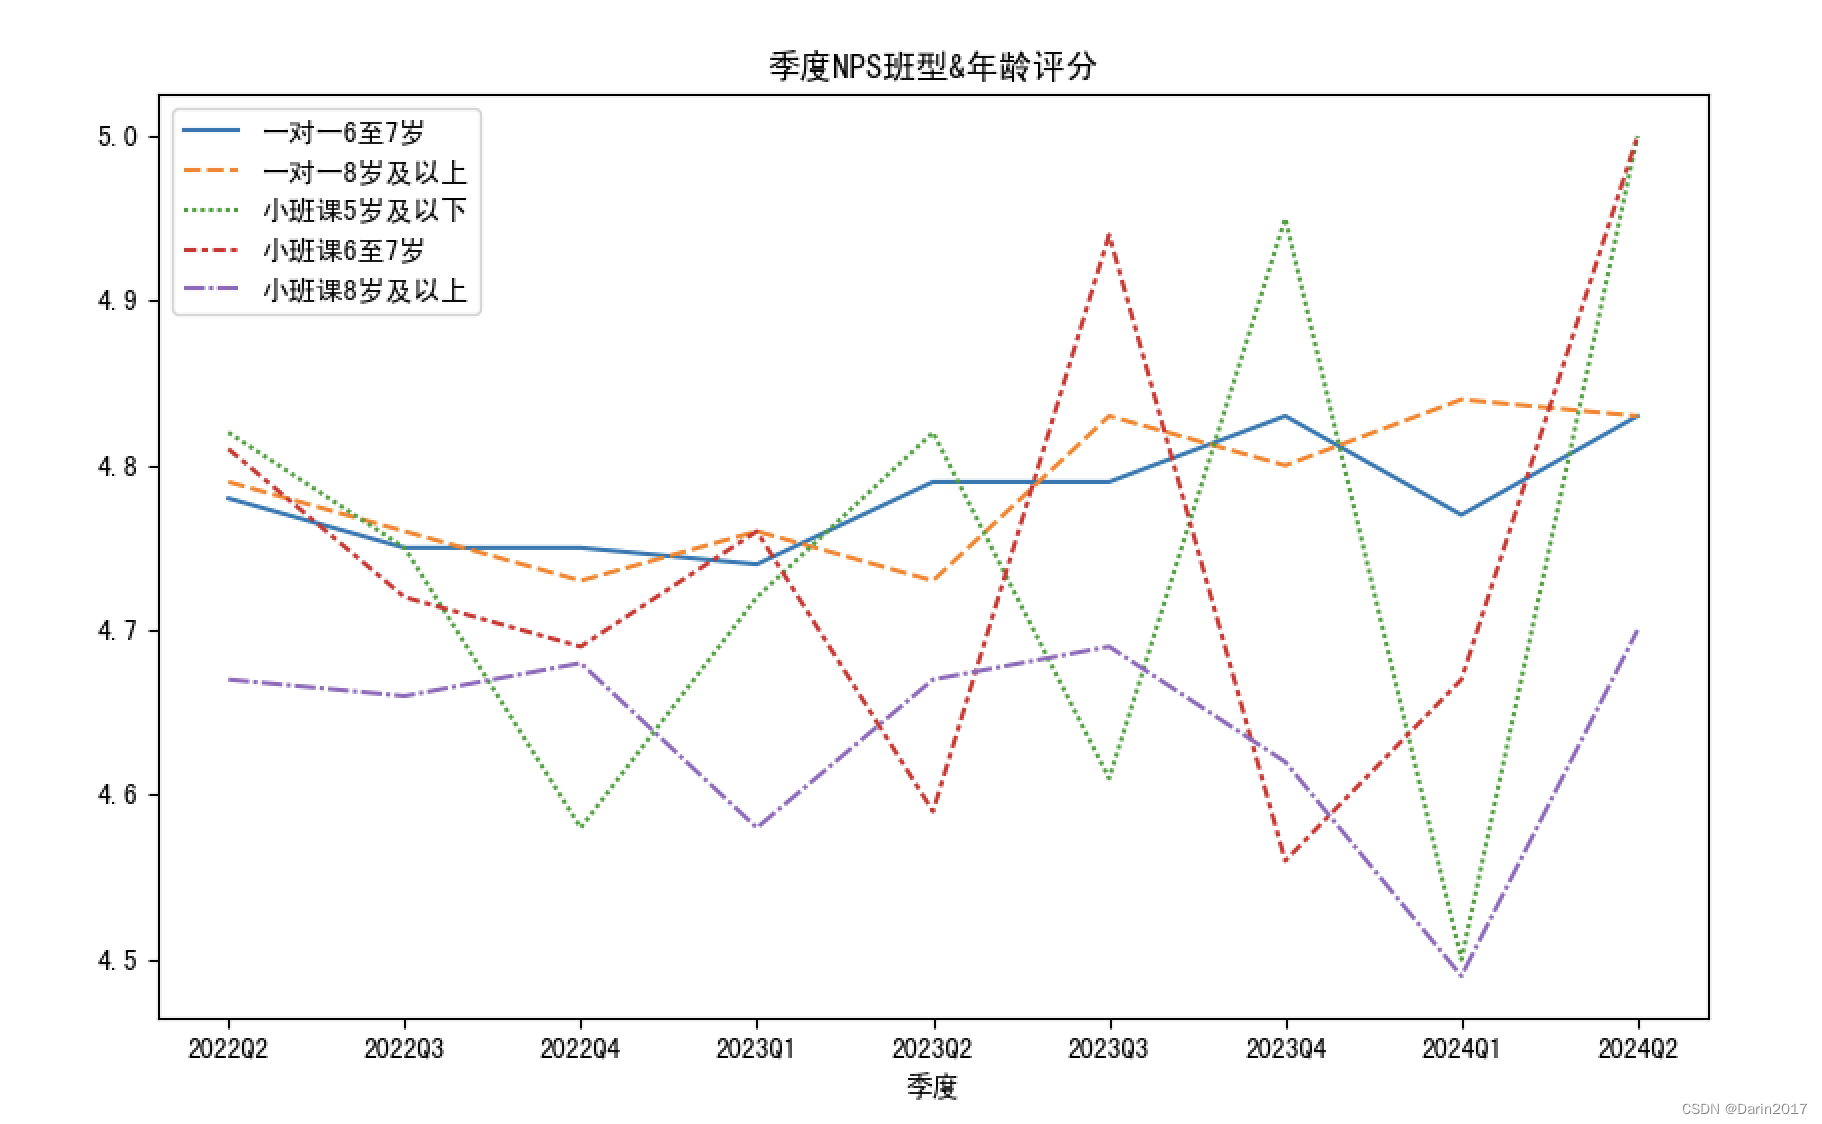
plt.title('季度NPS班型&年龄评分')
plt.savefig(filepath+'08季度NPS班型&年龄评分趋势.png')
#从第三行开始读取列名,第一列作为索引
df3=pd.read_excel(filepath+file1,sheet_name='班型&年龄(月)',header=0,index_col=0)
#缺失值填充,fillna(method='ffill'使用前一个值填充缺失值,fillna(method='bfill')使用后一个值填充缺失值
#新版本中直接使用ffill(),bfill(),老方法将报错
df3.loc['班型']=df3.loc['班型'].ffill()
df3.columns=df3.loc['班型',:]+df3.loc['年龄',:]
df3.index.name='月度'
df3.drop(index=['Mut','班型','年龄'],inplace=True)
print(df3.columns,df3.index)
print(df3.head(5))
print(df3.shape)
df4=df3.iloc[1:,7:]
print(df4)
import seaborn as sns
import matplotlib.pyplot as plt
plt.figure(figsize=(10,6))
sns.lineplot(df4)
#控制X坐标轴字体角度
plt.xticks(rotation=30)
plt.title('月度NPS班型&年龄评分')
plt.savefig(filepath+'09月度NPS班型&年龄评分趋势.png')
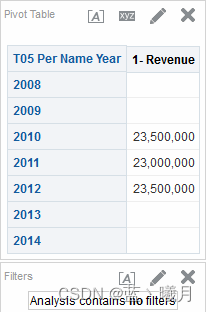
作图结果:
使用到的常用处理方法:
#从第*行开始读取列名,第一列作为索引
df1=pd.read_excel(filepath+file1,sheet_name='班型&年龄(季度)',header=0,index_col=0)
#缺失值填充,fillna(method='ffill'使用前一个值填充缺失值,fillna(method='bfill')使用后一个值填充缺失值
#新版本中直接使用ffill(),bfill(),老方法将报错
df1.loc['班型']=df1.loc['班型'].ffill()
df1.columns=df1.loc['班型',:]+df1.loc['年龄',:]
- 重命名索引,并删除多余的行数据
df1.index.name='季度'
df1.drop(index=['Qut','班型','年龄'],inplace=True)
- 横轴标签较多是,调整字体角度,使完全显示
import seaborn as sns
import matplotlib.pyplot as plt
plt.figure(figsize=(10,6))
sns.lineplot(df4)
#控制X坐标轴字体角度
plt.xticks(rotation=30)
plt.title('月度NPS班型&年龄评分')