问题背景
之前有几篇文章写过关于应用传输慢的问题,延用之前的老套话,应用传输慢是一种比较常见的问题,慢在哪,为什么慢,有时候光从网络数据包分析方面很难回答的一清二楚,毕竟应用的定义范围实在太广,不同应用的技术方向专业性太强,全栈大佬只能仰望,而我们能做到的是在专注于自身的专业方向之外,尽量扩展知识面,学会找出问题的规律,并提出可能的解决建议。
本篇案例是一个 HTTP 传输文件慢的问题,HTTP 协议算是网络协议分析中经常碰到的一种应用协议,该案例的故障根因并没有太多特殊性,只是因为分别在客户端和服务器端同时抓取了相关数据包,站在不同的视角上,看看分析思路和过程上有什么不同。
案例取自 SharkFest 2019《Troubleshooting Slow Networks》
问题信息
跟踪文件基本信息如下:
λ capinfos "Exercise *.pcapng"
File name:           Exercise 1_tcp-slowtransfer-client.pcapng
File type:           Wireshark/... - pcapng
File encapsulation:  Ethernet
File timestamp precision:  microseconds (6)
Packet size limit:   file hdr: (not set)
Number of packets:   1098
File size:           1159 kB
Data size:           1121 kB
Capture duration:    0.841554 seconds
First packet time:   2011-06-27 23:07:28.687320
Last packet time:    2011-06-27 23:07:29.528874
Data byte rate:      1332 kBps
Data bit rate:       10 Mbps
Average packet size: 1021.39 bytes
Average packet rate: 1304 packets/s
SHA256:              33d7e7d717e35777942e112d94b88db84a9f6ea366e5c29fcbbcd602481caa02
RIPEMD160:           8fb7fdf74b72310a1199b093618d691428563c91
SHA1:                c388865c714612dca27797a134ca9f9234818d16
Strict time order:   True
Capture application: Editcap (Wireshark) 3.0.1 (v3.0.1-0-gea351cd8)
Capture comment:     Sharkfest 2019 - Exercise 1.   This was a slow file transfer. Let's troubleshoot.   1. What is the highest throughput that this file transfer can achieve? Acceptable? 2. What is the network roundtrip time between client and server? 3. Is there any packet loss in this trace file?  4. In the handshakes, what TCP options are there? Which ones are missing?  5. What do you think the reason for the low throughput was?   Use Example 2 to validate your findings.      This work is licensed under the Creative Commons Attribution-NonCommercial-NoDerivatives 4.0 International License. To view a copy of this license, visit http://creativecommons.org/licenses/by-nc-nd/4.0/ or send a letter to Creative Commons, PO Box 1866, Mountain View, CA 94042, USA.  This packet capture file is provided by:  Name    : Sake Blok E-mail      : sake.blok@SYN-bit.nl Twitter  : @SYNbit Web   : www.SYN-bit.nl  If you would like to use this file in any other way than is permitted by the "CC BY-NC-ND 4.0" license, please contact me.
Number of interfaces in file: 1
Interface #0 info:
                     Encapsulation = Ethernet (1 - ether)
                     Capture length = 65535
                     Time precision = microseconds (6)
                     Time ticks per second = 1000000
                     Number of stat entries = 0
                     Number of packets = 1098

File name:           Exercise 2_tcp-slowtransfer-server.pcapng
File type:           Wireshark/... - pcapng
File encapsulation:  Ethernet
File timestamp precision:  microseconds (6)
Packet size limit:   file hdr: (not set)
Number of packets:   1098
File size:           1159 kB
Data size:           1121 kB
Capture duration:    0.841489 seconds
First packet time:   2011-06-27 23:07:24.313428
Last packet time:    2011-06-27 23:07:25.154917
Data byte rate:      1332 kBps
Data bit rate:       10 Mbps
Average packet size: 1021.39 bytes
Average packet rate: 1304 packets/s
SHA256:              8a1f6e89f9b8535c6d8b7293ecb57f21cd9a1c445a45fb27078ceb2d9af7a78e
RIPEMD160:           a31d97b6f5211160836abd4a6f576d20b1171b4f
SHA1:                a52f180d6302582f38250a362ed31c6b0e35c3af
Strict time order:   True
Capture application: Editcap (Wireshark) 3.0.1 (v3.0.1-0-gea351cd8)
Capture comment:     Sharkfest 2019 - Exercise 2  This is the server side of the same file transfer. Let's see how this perspective can help.   1. Look at the handshake, what is the network latency? What TCP options are missing?  2. What is the highest level of throughput acheived?  3. What TCP errors do we see? How can we interpret these? Is the server doing something wrong?  4. Why don't we see this in the client side trace file?      This work is licensed under the Creative Commons Attribution-NonCommercial-NoDerivatives 4.0 International License. To view a copy of this license, visit http://creativecommons.org/licenses/by-nc-nd/4.0/ or send a letter to Creative Commons, PO Box 1866, Mountain View, CA 94042, USA.  This packet capture file is provided by:  Name    : Sake Blok E-mail: sake.blok@SYN-bit.nl Twitter     : @SYNbit Web   : www.SYN-bit.nl  If you would like to use this file in any other way than is permitted by the "CC BY-NC-ND 4.0" license, please contact me.
Number of interfaces in file: 1
Interface #0 info:
                     Encapsulation = Ethernet (1 - ether)
                     Capture length = 65535
                     Time precision = microseconds (6)
                     Time ticks per second = 1000000
                     Number of stat entries = 0
                     Number of packets = 1098
数据包跟踪文件通过 Wireshark 同时捕获,基本信息保持一致,数据包数量 1098 个,文件大小 1159k 字节,捕获时长 0.84 秒,平均速率 10 Mbps,同时经过 Editcap 进行了一定修改,也在两个文件上分别加了描述,包含问题信息以及 CC BY-NC-ND 4.0 许可说明。
对于《CC知识共享许可协议》没有太多研究,数据包文件版权依然归于作者 Sake Blok ,本篇文章仅用于学习分析使用。
客户端数据包文件,问题信息如下:
- What is the highest throughput that this file transfer can achieve? Acceptable?
- What is the network roundtrip time between client and server?
- Is there any packet loss in this trace file?
- In the handshakes, what TCP options are there? Which ones are missing?
- What do you think the reason for the low throughput was?
服务器端数据包文件,问题信息如下:
- Look at the handshake, what is the network latency? What TCP options are missing?
- What is the highest level of throughput acheived?
- What TCP errors do we see? How can we interpret these? Is the server doing something wrong?
- Why don’t we see this in the client side trace file?
问题分析
客户端
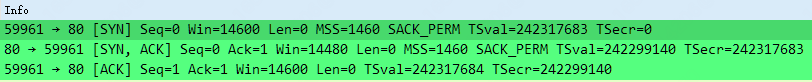
首先从客户端 “Exercise 1_tcp-slowtransfer-client.pcapng” 数据包跟踪文件开始,展开数据包信息如下,可以看到标准的 TCP 三次握手阶段的数据包,以及 HTTP GET 请求和数据响应传输的数据包,最后以 FIN 四次挥手数据包结束。
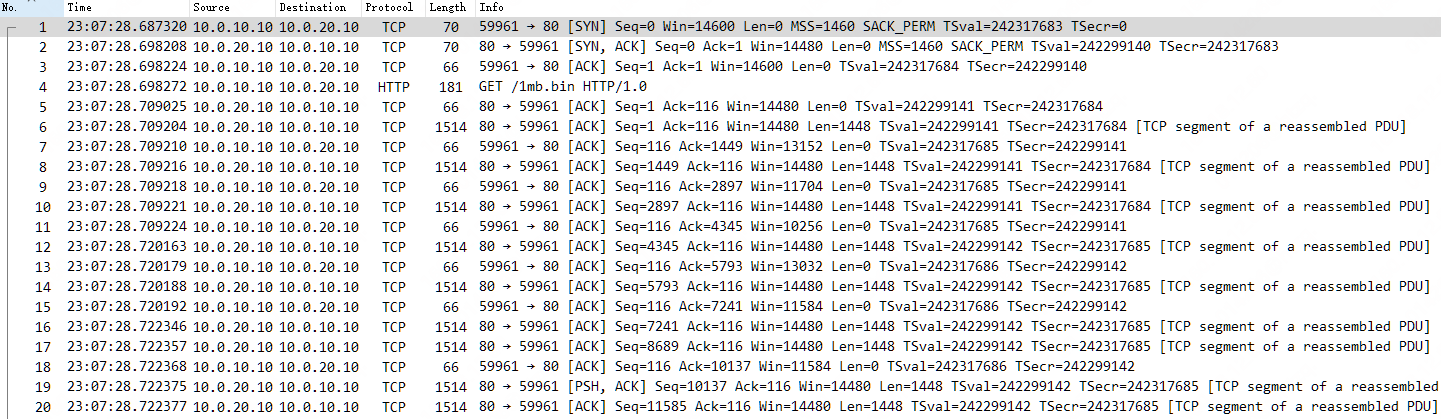

- 上图中 HTTP 响应 200 OK 在一个 TCP 流中出现的如此靠后,完成一次请求和响应后就 FIN 结束连接了,这样所计算出来的 http.time 显得会很大,实际上是可以通过选项来修改 Wireshark 这种判断逻辑的,详见《 Wieshark 提示和技巧 | Time 时间分析那些事》。
http.time是 HTTP 协议中的时间字段(Time since the request was sent),表示 HTTP 请求到响应的时间间隔。更具体地说,它是 HTTP 请求的时间戳,到 HTTP响应的时间戳之间的时间差。
专家信息如下,可以看到异常的简洁,没有 Warning 相关信息,可见传输缓慢的问题并不是常见的丢包导致重传所引起。

其中 TCP 会话完整性分析中 tcp.completeness == 31 也说明了该 TCP 会话相关情况,31 = 1 + 2 + 4 + 8 + 16,其中 1 为 SYN,2 为 SYN/ACK,4 为 ACK,8 为 DATA,16 为 FIN。
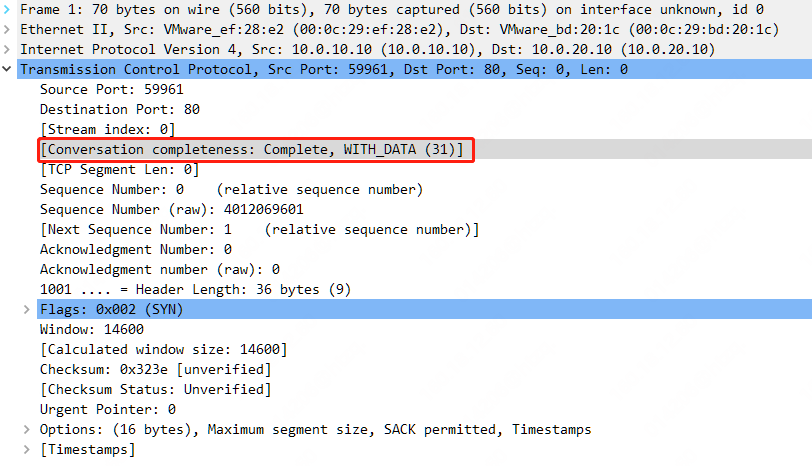
TCP 会话完整性分析说明详见《 Wieshark 提示和技巧 | TCP 会话完整性分析》。
直接切入数据包跟踪文件中的问题,说明如下:
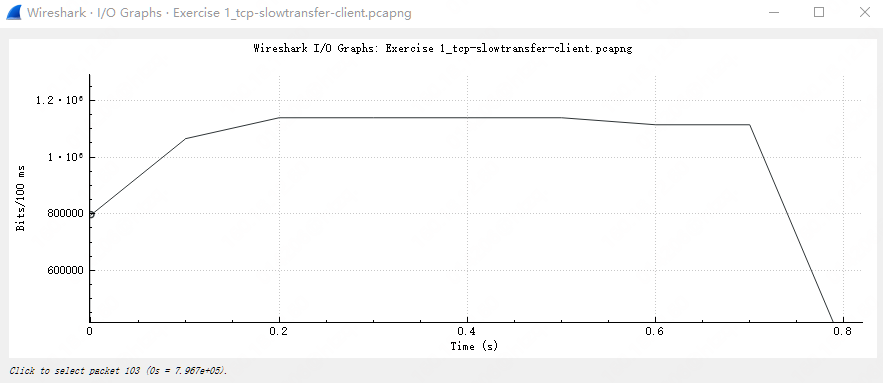
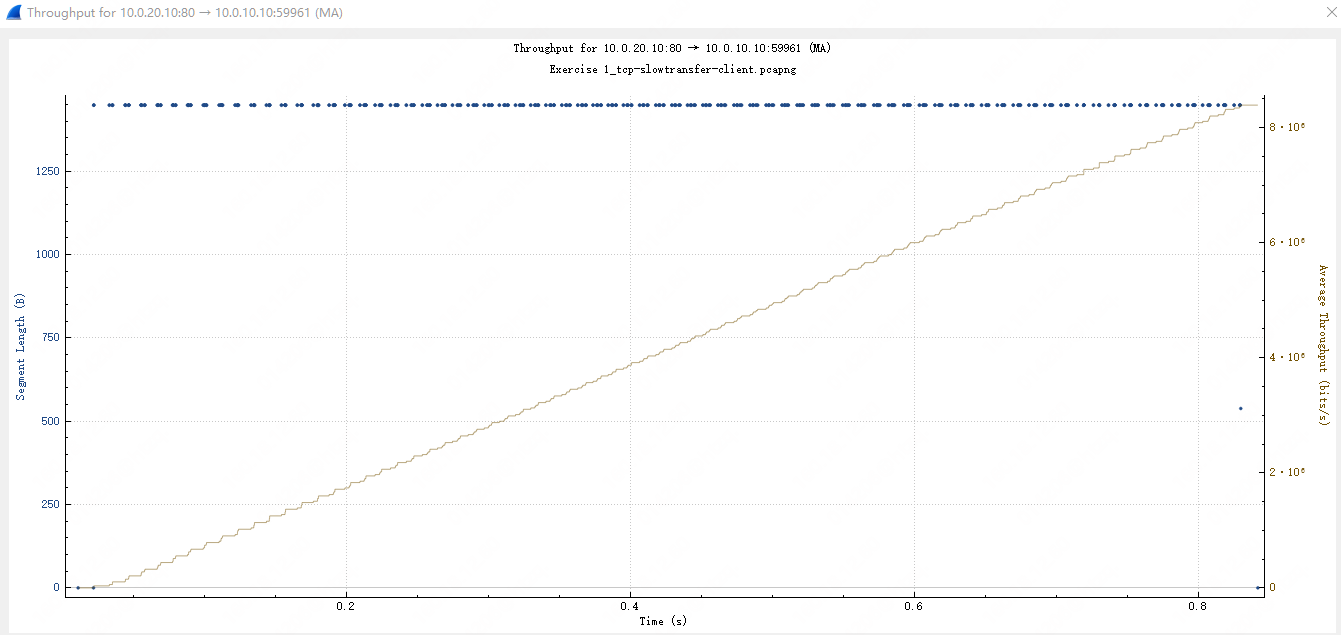
- What is the highest throughput that this file transfer can achieve? Acceptable?
以 I/O 图和 Throughput 图来说,基本该文件传输的速率达到了 10Mbps 左右。能不能接受?应该不行吧。。。
- What is the network roundtrip time between client and server?
RTT 图示如下,至于 IRTT ,根据 TCP 三次握手的时间来算,为 0.010904 秒。

- Is there any packet loss in this trace file?
没有,可以通过 tcp.analysis.lost_segment 和 tcp.analysis.retransmission 等显示过滤表达式过滤得知结果。
- In the handshakes, what TCP options are there? Which ones are missing?
TCP options 如下图,少了啥,少了常见的 Window Scale,客户端和服务器端均无。
- What do you think the reason for the low throughput was?
低吞吐的原因,实际上可以判断是 TCP 接收窗口的问题,也就是缺少了 Window Scale 因子,造成无法提高传输的数据量,窗口满了或者接近满了。
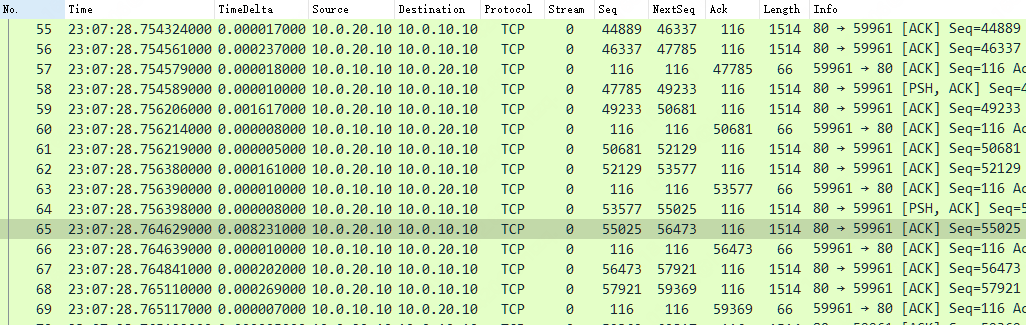
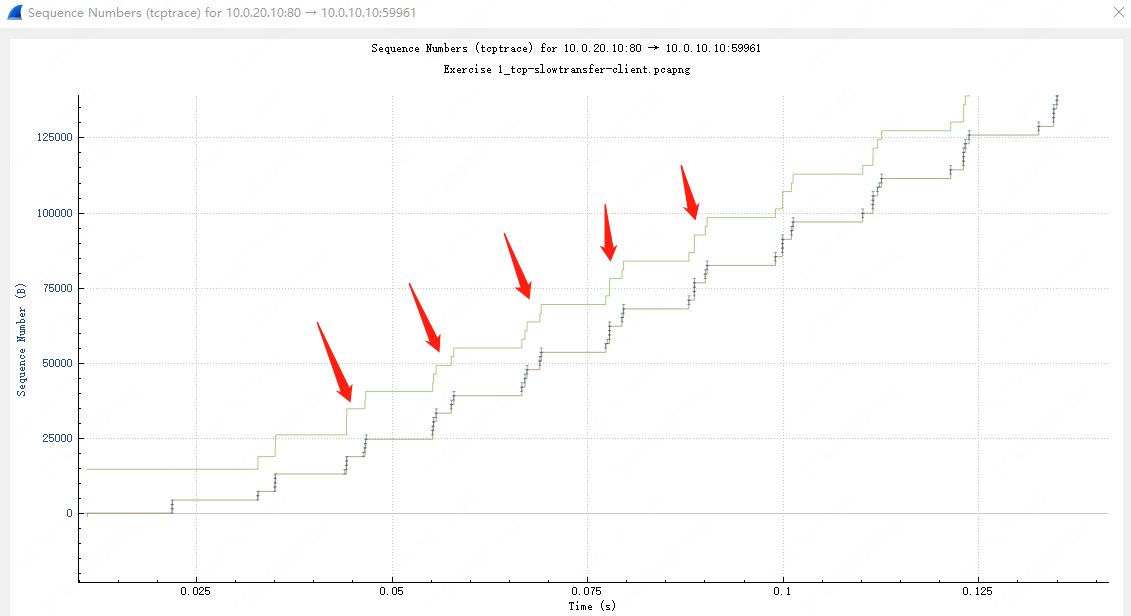
但是站在客户端的角度上,为什么看不到窗口满这种现象?可以看到现象永远都是标准的 2 个 MSS + 1 个 ACK ,同样 Tcptrace 示图的数据分段的大小离客户端接收窗口还远着呢,毕竟客户端认为收到了就立马确认,加上应用上层的处理及时,对外通告的 Win 大小也一直保持在一个比较固定的值。
因此问题的下一步分析,需要站在不同的视角上了,转向服务器端。
服务器端
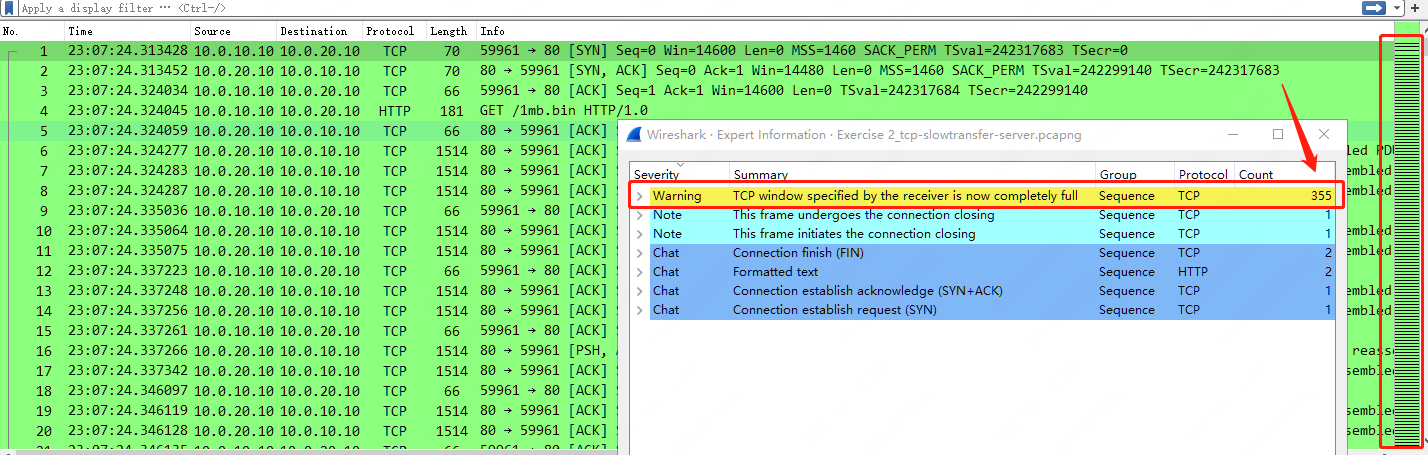
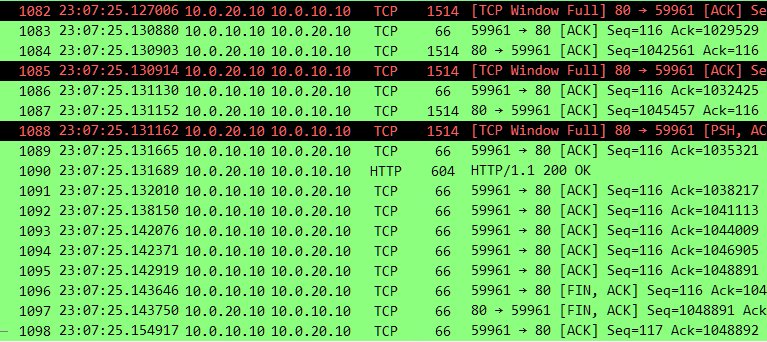
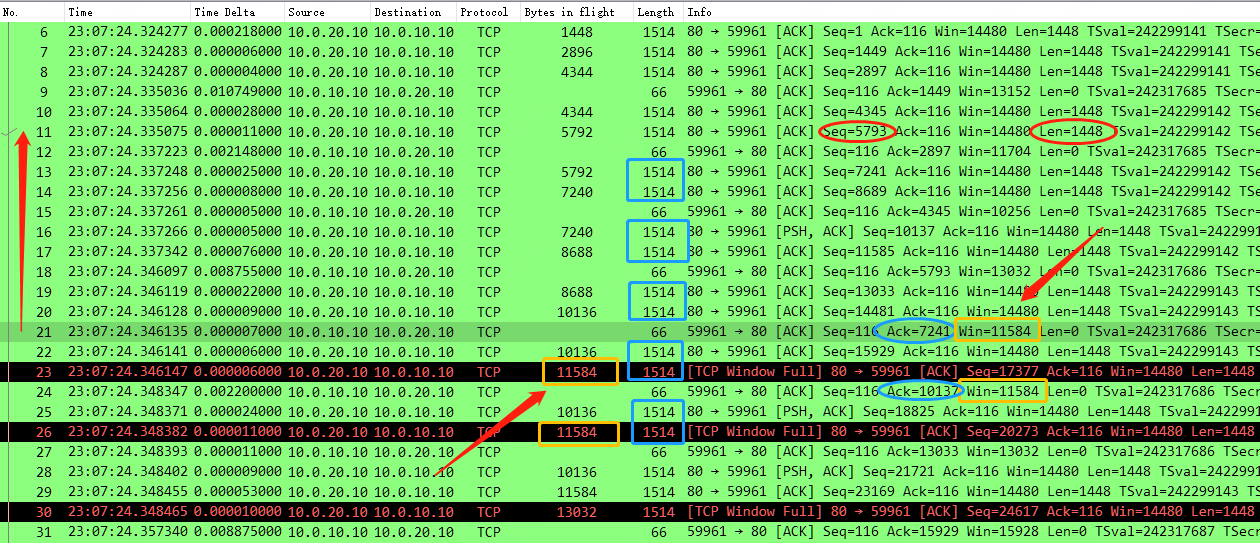
打开服务器端 “Exercise 2_tcp-slowtransfer-server.pcapng” 数据包跟踪文件,展开数据包信息如下,问题展现的已经很明显了,包括 TCP 专家信息中明确的提示到 Warning: TCP window specified by the receiver is now completely full 总共次数报了 355 次之多,基本上从数据传输起始到最后阶段。
Tcptrace 示图,也很明显可以看到服务器所发送的数据分段,已经达到了客户端也就是接收端接收窗口的上限。

回到数据包详细信息上,在服务器端上发生 TCP Window Full 的告警前,最后一次收到的客户端 ACK 是 No.21,它的 ACK 7241 仅仅是确认了服务器的 No.11 的数据段(Seq 5793 + Len 1448 = 7241),离上次客户端 No.18 ACK 5793,仅仅确认了一个 1448 大小的数据分段,而该 ACK 中通告的 Win 为 11584。
至此服务器端就明白了,No.20 它发送的数据包在途字节数是 10136,收到 No.21 确认了自己一个 1448 的数据分段,而且客户端通知我它的接收窗口为 11584,这样服务器端还能发几个呢,正好是 11584 - 10136 + 1448 = 2896,正好是两个 Len 1448 的数据分段,也就是图中的 No.22 和 No.23,正好满了,所以 No.23 会有 TCP Window Full 的告警。
然后往下就是一个固定规律了,客户端的 No.24 ACK 又确认了两个分段(10137-7241=2896),而且 Win 仍为 11584 大小,服务器就继续只能发两个 Len 1448 的数据分段,也就是图中的 No.25 和 No.26,正好又满了,所以 No.26 会有 TCP Window Full 的告警,如下不停反复同样的过程。
至此 HTTP 传输文件慢的根本原因也就找到了,正是缺少了 TCP options 中的 Window Scale 因子支持,使得接收窗口无法放大使用,数据发送端发送的数据达到了接收窗口的上限,一直需要客户端确认了 xx 个才能再根据 Win 大小再发送几个,整体慢就慢在了这个接收窗口大小以及 RTT 处理等待时间上。
至于服务器端数据包跟踪文件中的几个问题,我想以上分析过程中,都已经说明了答案,不再赘述。
- Look at the handshake, what is the network latency? What TCP options are missing?
- What is the highest level of throughput acheived?
- What TCP errors do we see? How can we interpret these? Is the server doing something wrong?
- Why don’t we see this in the client side trace file?
问题总结
实际上部分场景下的数据包分析确实需要在多点捕获,包括发送端或者接收端,甚至于中间路径的多个节点,这样更有助于网络问题分析。虽然说问题的根因很简单,但如何根据自己的理解,如何定位排障,如何反推数据包的现象,还是需要不断实践总结的。