当MySQL遇到慢查询(慢SQL)时,我们可以通过以下步骤进行排查和优化:
标题开启慢查询日志:
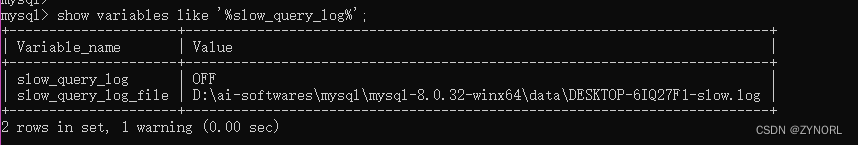
确保MySQL的慢查询日志已经开启。通过查看slow_query_log和slow_query_log_file变量来确认。
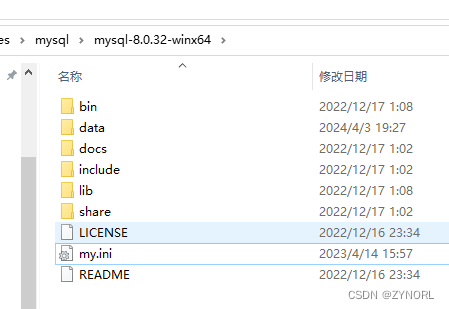
如果没有开启,可以在MySQL配置文件(如my.cnf(linux)或my.ini(windows))中设置这些变量,然后重启MySQL服务。
# 开启慢查询日志
slow_query_log = ON
# 设置慢查询的时间阈值,单位秒,查询耗时超过此值的SQL会被记录
long_query_time = 1
# 设置log位置
slow_query_log_file = D:/ai-softwares/mysql/mysql-8.0.32-winx64/data/DESKTOP-6IQ27F1-slow.log
# (可选)记录那些没有使用索引的查询
log_queries_not_using_indexes = 1
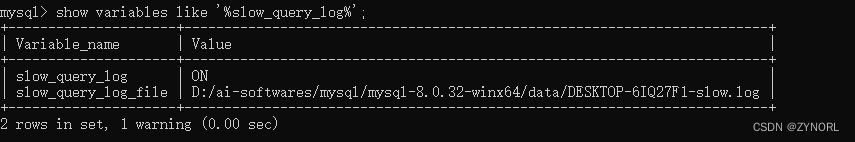
保存,重启后,可以看到:
查询几条数据后,查看慢日志文件内容:
D:\ai-softwares\mysql\mysql-8.0.32-winx64\bin\mysqld, Version: 8.0.32 (MySQL Community Server - GPL). started with:
TCP Port: 3306, Named Pipe: MySQL
Time                 Id Command    Argument
# Time: 2024-04-05T06:33:16.321295Z
# User@Host: root[root] @ localhost [::1]  Id:     8
# Query_time: 0.005313  Lock_time: 0.000010 Rows_sent: 100  Rows_examined: 100
use atguigudb1;
SET timestamp=1712298796;
select * from course;
# Time: 2024-04-05T06:33:39.469804Z
# User@Host: root[root] @ localhost [::1]  Id:     8
# Query_time: 0.037054  Lock_time: 0.000037 Rows_sent: 25  Rows_examined: 25
use atguigudb;
SET timestamp=1712298819;
select * from countries;
# Time: 2024-04-05T06:44:06.818619Z
# User@Host: root[root] @ localhost [::1]  Id:     8
# Query_time: 0.000289  Lock_time: 0.000004 Rows_sent: 25  Rows_examined: 25
SET timestamp=1712299446;
select * from countries;
# Time: 2024-04-05T06:44:42.748596Z
# User@Host: root[root] @ localhost [::1]  Id:     8
# Query_time: 0.000215  Lock_time: 0.000003 Rows_sent: 25  Rows_examined: 25
SET timestamp=1712299482;
select * from countries;
# Time: 2024-04-05T06:44:52.762931Z
# User@Host: root[root] @ localhost [::1]  Id:     8
# Query_time: 0.086578  Lock_time: 0.000010 Rows_sent: 19  Rows_examined: 19
SET timestamp=1712299492;
select * from jobs;
# Time: 2024-04-05T06:44:53.632521Z
# User@Host: root[root] @ localhost [::1]  Id:     8
# Query_time: 0.000169  Lock_time: 0.000002 Rows_sent: 19  Rows_examined: 19
SET timestamp=1712299493;
select * from jobs;
# Time: 2024-04-05T06:44:54.245250Z
# User@Host: root[root] @ localhost [::1]  Id:     8
# Query_time: 0.000166  Lock_time: 0.000001 Rows_sent: 19  Rows_examined: 19
SET timestamp=1712299494;
select * from jobs;
# Time: 2024-04-05T06:44:54.966701Z
# User@Host: root[root] @ localhost [::1]  Id:     8
# Query_time: 0.000171  Lock_time: 0.000002 Rows_sent: 19  Rows_examined: 19
SET timestamp=1712299494;
select * from jobs;
# Time: 2024-04-05T06:44:55.613169Z
# User@Host: root[root] @ localhost [::1]  Id:     8
# Query_time: 0.000160  Lock_time: 0.000002 Rows_sent: 19  Rows_examined: 19
SET timestamp=1712299495;
select * from jobs;
分析慢查询日志:
使用mysqldumpslow或其他慢查询日志分析工具来查看和分析慢查询日志中的条目。
查看MySQL安装目录的bin目录下,没有mysqldumpslow.exe文件,有一个mysqldumpslow.pl文件。
在目录该下,cmd运行命令:perl mysqldumpslow.pl --help查看命令帮助。
D:\ai-softwares\mysql\mysql-8.0.32-winx64\bin>perl mysqldumpslow.pl --help
Usage: mysqldumpslow [ OPTS... ] [ LOGS... ]

Parse and summarize the MySQL slow query log. Options are

  --verbose    verbose
  --debug      debug
  --help       write this text to standard output

  -v           verbose
  -d           debug
  -s ORDER     what to sort by (al, at, ar, c, l, r, t), 'at' is default
                al: average lock time
                ar: average rows sent
                at: average query time
                 c: count
                 l: lock time
                 r: rows sent
                 t: query time
  -r           reverse the sort order (largest last instead of first)
  -t NUM       just show the top n queries
  -a           don't abstract all numbers to N and strings to 'S'
  -n NUM       abstract numbers with at least n digits within names
  -g PATTERN   grep: only consider stmts that include this string
  -h HOSTNAME  hostname of db server for *-slow.log filename (can be wildcard),
               default is '*', i.e. match all
  -i NAME      name of server instance (if using mysql.server startup script)
  -l           don't subtract lock time from total time
比如分析时,指定-s c查询次数次数排序,不用-aN隐藏数字,执行下面命令,分析慢查询日志:
perl "D:\ai-softwares\mysql\mysql-8.0.32-winx64\bin\mysqldumpslow.pl" -s c -a "D:/ai-softwares/mysql/mysql-8.0.32-winx64/data/DESKTOP-6IQ27F1-slow.log"
分析结果如下:
D:\ai-softwares\mysql\mysql-8.0.32-winx64\bin>perl "D:\ai-softwares\mysql\mysql-8.0.32-winx64\bin\mysqldumpslow.pl" -s c -a "D:/ai-softwares/mysql/mysql-8.0.32-winx64/data/DESKTOP-6IQ27F1-slow.log"

Reading mysql slow query log from D:/ai-softwares/mysql/mysql-8.0.32-winx64/data/DESKTOP-6IQ27F1-slow.log
Count: 5  Time=0.02s (0s)  Lock=0.00s (0s)  Rows=19.0 (95), root[root]@localhost
  select * from jobs

Count: 3  Time=0.01s (0s)  Lock=0.00s (0s)  Rows=25.0 (75), root[root]@localhost
  select * from countries

Count: 1  Time=0.00s (0s)  Lock=0.00s (0s)  Rows=0.0 (0), 0users@0hosts
  D:\ai-softwares\mysql\mysql-8.0.32-winx64\bin\mysqld, Version: 8.0.32 (MySQL Community Server - GPL). started with:
  TCP Port: 3306, Named Pipe: MySQL
  # Time: 2024-04-05T06:33:16.321295Z
  # User@Host: root[root] @ localhost [::1]  Id:     8
  # Query_time: 0.005313  Lock_time: 0.000010 Rows_sent: 100  Rows_examined: 100
  use atguigudb1;
  SET timestamp=1712298796;
  select * from course
可以看到,日志分析,可以通过命令定制化分析,并且对于每个select,有执行的个数、耗时、锁表的时间、查询的行数、用户与host信息:
Count: 3 Time=0.01s (0s) Lock=0.00s (0s) Rows=25.0 (75), root[root]@localhost
可以知道,相比于慢查询日志,它可以对其进行整合,比如将相同的查询SQL计数为count。
EXPLAIN命令:
对于日志中记录的慢查询,使用EXPLAIN命令来查看查询的执行计划。分析查询是否使用了合适的索引,以及是否存在全表扫描等低效操作。
explain select * from jobs;
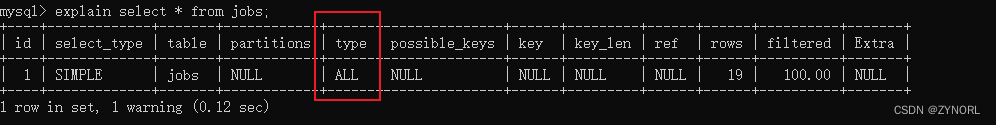
可以看到type=ALL,说明是全表扫描,没有进行索引。
优化查询
根据EXPLAIN的输出结果,优化查询语句,比如添加或修改索引。
避免在查询中使用*,而是指定需要的列。
减少JOIN操作的数量或复杂性,特别是在大数据集上。
考虑将计算密集型的操作移到应用层进行。


![[VulnHub靶机渗透] pWnOS 2.0](https://img-blog.csdnimg.cn/direct/0a9aee202e9941888ac104ec7fb071fb.png)