👀🎉📜系列文章目录
嘻嘻 暂时还没有~~~~
🚀🚀🚀前言
在目标检测过程中,看F1置信度分数,依旧map@0.5或者AP、recall这些评估指标虽然可以很简单粗暴的看出模型训练的一个性能,但是缺无法直观的看出究竟哪一点提升了,然而这些品估指标都是通过TP、FP、FN进行计算的,如果能够直观的看见哪些目标是TP、FP、FN,那么在实验过程中就能知道自己改进的网络对哪些目标是有提升效果的。
所以这个文章将手把手带你如何可视化自己数据集中的TP、FP、FN,帮助你更直观的感受自己网络究竟在改进在哪些方面。
一、1️⃣相关名词解释
在目标检测中,TP(真正例)、FP(假正例)和FN(假负例) 的定义稍微复杂一些,因为目标检测不仅要考虑分类是否正确,还要考虑定位是否准确。以下是这些概念的解释和示例:
1.真正例(True Positives,TP):指检测到的目标与实际目标之间的匹配。这意味着检测到的目标在位置和类别上都与实际目标匹配。
2.假正例(False Positives,FP):指模型错误地将负例(非目标)样本预测为正例(目标)。在目标检测中,FP 是指检测到的目标与实际无目标区域之间的匹配。
3.假负例(False Negatives,FN):指模型未能检测到实际存在的目标。在目标检测中,FN 是指未检测到的实际目标。
举个例子:
假设我们有一张图像,其中包含一只猫和一只狗。我们的目标检测模型会尝试检测图像中的动物,并且根据预测结果计算 TP、FP 和 FN。
- TP(真正例):如果模型正确地检测到了图像中的猫和狗,并且对它们进行了正确的分类和定位,那么这就是一个 TP。
- FP(假正例):如果模型在图像中的某些区域错误地检测到了动物(例如,将一只猫误认为狗),或者在图像中检测到了不存在的动物,那么这就是一个 FP。
- FN(假负例):如果模型未能检测到图像中的某些动物(例如,漏掉了图像中的狗),那么这就是一个 FN。
例如,如果我们的模型在图像中正确检测到了猫和狗,并且没有检测到不存在的动物,那么:
TP = 2(假设图像中只有一只猫和一只狗)
FP = 0(模型未将不存在的动物检测为目标)
FN = 0(模型未漏掉任何实际存在的目标)
二、2️⃣论文中案例
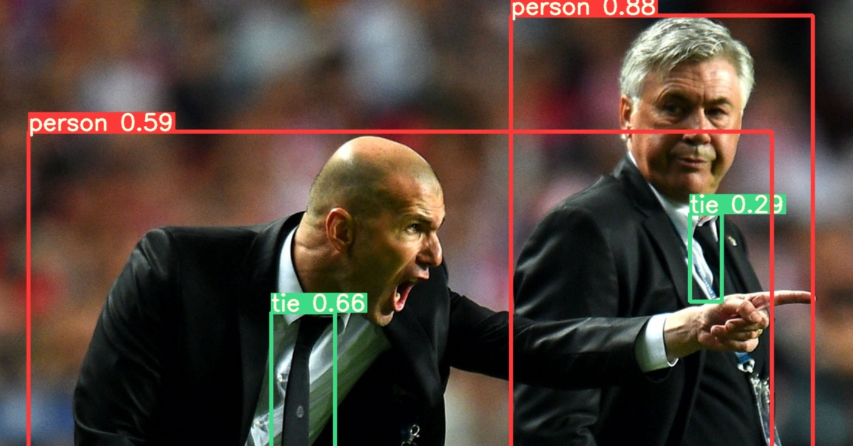
下面这幅图是出之NWD这篇论文,基于 IoU 的检测器(第一行)和基于 NWD 的检测器(第二行)的一些可视化结果。(感兴趣的可以去我的目标检测论文专栏阅读)。其中绿色、蓝色和红色框分别表示真阳性(TP)、假阳性(FP)和假阴性(FN) 预测。下面的实验可视化颜色也是遵循这种颜色分配!!!

三、3️⃣新建相关文件夹
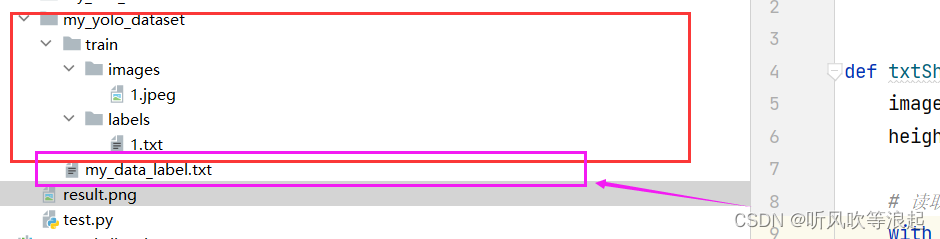
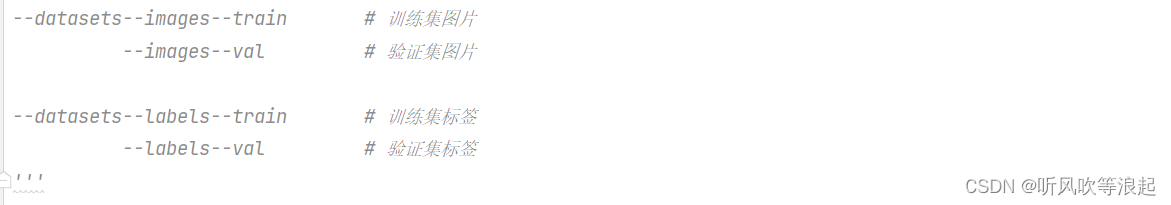
这里需要建立三个文件,可以选择在你的yolov5项目文件中新建如下文件夹(千万不要把文件夹命名错了)。文件夹目录结构如下:

- image文件:存储的是等下我们需要推理的照片
- label文件夹:存储的是image文件夹里面所有图片的标注类别
- predict文件夹:等下存储我们推理detect.py推理image图片后的标准信息。
- tricks_1.py文件:我们的TP、FP、FN可视化代码,代码如下
import os, cv2, tqdm, shutil
import numpy as np

def xywh2xyxy(box):
    box[:, 0] = box[:, 0] - box[:, 2] / 2
    box[:, 1] = box[:, 1] - box[:, 3] / 2
    box[:, 2] = box[:, 0] + box[:, 2]
    box[:, 3] = box[:, 1] + box[:, 3]
    return box

def iou(box1, box2):
    x11, y11, x12, y12 = np.split(box1, 4, axis=1)
    x21, y21, x22, y22 = np.split(box2, 4, axis=1)

    xa = np.maximum(x11, np.transpose(x21))
    xb = np.minimum(x12, np.transpose(x22))
    ya = np.maximum(y11, np.transpose(y21))
    yb = np.minimum(y12, np.transpose(y22))

    area_inter = np.maximum(0, (xb - xa + 1)) * np.maximum(0, (yb - ya + 1))

    area_1 = (x12 - x11 + 1) * (y12 - y11 + 1)
    area_2 = (x22 - x21 + 1) * (y22 - y21 + 1)
    area_union = area_1 + np.transpose(area_2) - area_inter

    iou = area_inter / area_union
    return iou

def draw_box(img, box, color):
    cv2.rectangle(img, (int(box[0]), int(box[1])), (int(box[2]), int(box[3])), color, thickness=2)
    return img

if __name__ == '__main__':
    postfix = 'jpg'
    img_path = 'image'
    label_path = 'label'
    predict_path = 'predict'
    save_path = 'vis'
    classes = ['train', 'diningtable', 'person', 'bus', 'pottedplant', 'chair', 'cat', 'tvmonitor', 'motorbike', 'sofa', 'cow', 'bottle', 'aeroplane', 'dog', 'horse', 'car', 'boat', 'sheep', 'bicycle', 'bird']
    detect_color, missing_color, error_color  = (0, 255, 0), (0, 0, 255), (255, 0, 0)
    iou_threshold = 0.45

    if os.path.exists(save_path):
        shutil.rmtree(save_path)
    os.makedirs(save_path, exist_ok=True)

    all_right_num, all_missing_num, all_error_num = 0, 0, 0
    with open('result.txt', 'w') as f_w:
        for path in tqdm.tqdm(os.listdir(label_path)):
            image = cv2.imread(f'{img_path}/{path[:-4]}.{postfix}')
            if image is None:
                print(f'image:{img_path}/{path[:-4]}.{postfix} not found.', file=f_w)
            h, w = image.shape[:2]

            try:
                with open(f'{predict_path}/{path}') as f:
                    pred = np.array(list(map(lambda x:np.array(x.strip().split(), dtype=np.float32), f.readlines())))
                    pred[:, 1:5] = xywh2xyxy(pred[:, 1:5])
                    pred[:, [1, 3]] *= w
                    pred[:, [2, 4]] *= h
                    pred = list(pred)
            except:
                pred = []

            try:
                with open(f'{label_path}/{path}') as f:
                    label = np.array(list(map(lambda x:np.array(x.strip().split(), dtype=np.float32), f.readlines())))
                    label[:, 1:] = xywh2xyxy(label[:, 1:])
                    label[:, [1, 3]] *= w
                    label[:, [2, 4]] *= h
            except:
                print(f'label path:{label_path}/{path} (not found or no target).', file=f_w)

            right_num, missing_num, error_num = 0, 0, 0
            label_id, pred_id = list(range(label.shape[0])), [] if len(pred) == 0 else list(range(len(pred)))
            for i in range(label.shape[0]):
                if len(pred) == 0: break
                ious = iou(label[i:i+1, 1:], np.array(pred)[:, 1:5])[0]
                ious_argsort = ious.argsort()[::-1]
                missing = True
                for j in ious_argsort:
                    if ious[j] < iou_threshold: break
                    if label[i, 0] == pred[j][0]:
                        image = draw_box(image, pred[j][1:5], detect_color)
                        pred.pop(j)
                        missing = False
                        right_num += 1
                        break

                if missing:
                    image = draw_box(image, label[i][1:5], missing_color)
                    missing_num += 1

            if len(pred):
                for j in range(len(pred)):
                    image = draw_box(image, pred[j][1:5], error_color)
                    error_num += 1

            all_right_num, all_missing_num, all_error_num = all_right_num + right_num, all_missing_num + missing_num, all_error_num + error_num
            cv2.imwrite(f'{save_path}/{path[:-4]}.{postfix}', image)
            print(f'name:{path[:-4]} right:{right_num} missing:{missing_num} error:{error_num}', file=f_w)
        print(f'all_result: right:{all_right_num} missing:{all_missing_num} error:{all_error_num}', file=f_w)
四、4️⃣detect.py推理
关于detect.py文件修改如下:

运行detect.py文件之后会在run文件夹中生成推理出来的的标签文件,其中每个推理文件都标注了预测类别、位置、以及置信度:


五、5️⃣开始可视化
🔥将推理生成的labels文件夹中的txt文件全部拷贝到我们刚刚自己新建的predict文件夹当中,然后运行tricks_1.py代码,会生成一个vis文件夹,和一个result.txt文件,其中vis就是可视化结果,result.txt保存的就是每个图片物体目标right、missing、error的数量。
六、6️⃣可视化结果分析
🚀其中绿色是预测正确的,蓝色框表示类别预测错误的。红色表示该缺陷存在,但是却没有预测出来。