什么叫做分类问题?
A classification problem involves predicting whether something is one thing or another.
| Problem type | What is it? | Example |
|---|---|---|
| Binary classification | Target can be one of two options, e.g. yes or no | Predict whether or not someone has heart disease based on their health parameters. |
| Multi-class classification | Target can be one of more than two options | Decide whether a photo is of food, a person or a dog |
| Multi-label classification | Target can be assigned more than one option | Predict what categories should be assigned to a Wikipedia article (e.g. mathematics, science & philosophy). |
做 classification problem 步骤:
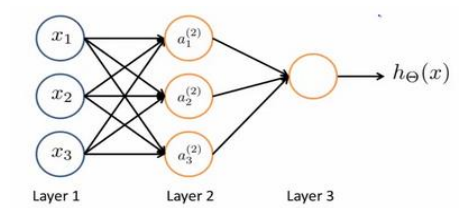
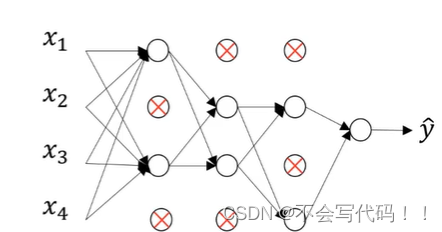
- Architecture of a classification neural network
- Getting binary classification data ready
- Building a PyTorch classification model
- Fitting the model to data (training)
- Making predictions and evaluating a model (inference)
- Improving a model (from a model perspective)
- Non-linearity
- Replicating non-linear functions
- Putting it all together with multi-class classification
Architecture of a classification neural network
| Hyperparameter | Binary Classification | Multiclass classification |
|---|---|---|
| Input layer shape (in_features) | Same as number of features (e.g. 5 for age, sex, height, weight, smoking status in heart disease prediction) | Same as binary classification |
| Hidden layer(s) | Problem specific, minimum = 1, maximum = unlimited | Same as binary classification |
| Neurons per hidden layer | Problem specific, generally 10 to 512 | Same as binary classification |
| Output layer shape (out_features) | 1 (one class or the other) | 1 per class (e.g. 3 for food, person or dog photo) |
| Hidden layer activation | Usually ReLU (rectified linear unit) but can be many others | Same as binary classification |
| Output activation | Sigmoid (torch.sigmoid in PyTorch) | Softmax (torch.softmax in PyTorch) |
| Loss function | Binary crossentropy (torch.nn.BCELoss in PyTorch) | Cross entropy (torch.nn.CrossEntropy Loss in PyTorch) |
| Optimizer | SGD (stochastic gradient descent), Adam (see torch.optim for more options) | Same as binary classification |
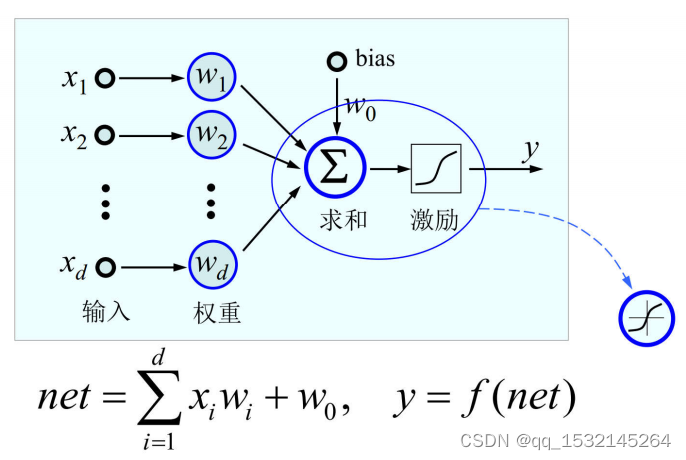
ReLU 函数定义:f(x) = max(0, x),x为输入
该函数特点:
- 非线性:尽管ReLU函数在 x <= 0 时输出固定值为零,但在 x > 0 时输出与输入成正比,因此具有非线性特性,有助于神经网络学习复杂的非线性关系。
- 稀疏性:在神经网络的训练过程中,由于ReLU函数在 x <= 0 时输出为零,因此某些神经元会被“关闭”,这意味着它们不会对网络的输出产生影响,使得网络的稀疏性增加,有助于减少过拟合。
- 解决梯度消失问题:ReLU 函数在正区间的梯度始终为1,不会出现梯度消失的问题,有助于缓解梯度消失问题,提高训练的稳定性和速度。
Make classification data and get it ready
创建一些数据
from sklearn.datasets import make_circles

# Make 1000 samples
n_samples = 1000

# Create circles
X, y = make_circles(n_samples,
                    noise = 0.03,
                    random_state = 42)
print(f"X里的前5个数:\n{X[:5]}")
print(f"y里的前5个数:\n{y[:5]}")

# 结果如下
X里的前5个数:
[[ 0.75424625  0.23148074]
 [-0.75615888  0.15325888]
 [-0.81539193  0.17328203]
 [-0.39373073  0.69288277]
 [ 0.44220765 -0.89672343]]
y里的前5个数:
[1 1 1 1 0]
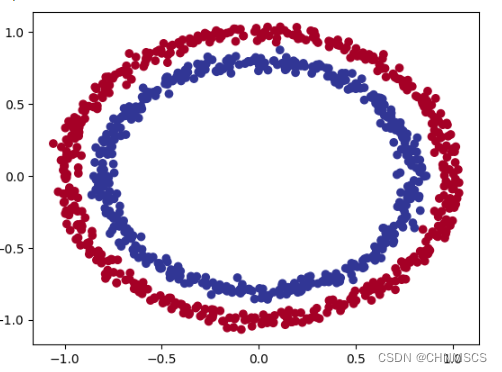
make_circles 函数用于生成一个包含两个圆形类别的二分类数据集,其中一个类别位于另一个类别的内部。
在 make_circles 函数中,noise参数用于控制生成的数据集中噪声的程度。noise参数的值在[0,1]范围内,表示生成的数据中随机噪声的标准差,即数据点在生成圆形分类时的偏移程度。noise 参数控制了数据点在生成时的偏移程度,从而影响了生成的数据集的分布情况。当 noise 参数较小 (接近0)时,生成的数据点更加紧密地分布在圆形区域内,而当 noise 参数较大 (接近1)时,生成地数据点可能会有较大地偏移,甚至出现在不同类别地区域内。
这里稍微介绍什么时“噪声”? 在数据领域中,“噪声”通常指的是在数据中存在的不希望或不相关的信息。这些信息可能是由于数据收集过程中的各种因素引入的随机性,错误或干扰造成的。噪声可能会包括几种类型:随机噪声,错误噪声,干扰噪声,不相关噪声。
随机噪声:由于测量或采样过程中的不确定性引起的随机波动。例如:图像中的图像噪声等。
错误噪声:由于设备故障,数据输入错误或其他技术问题引起的错误数据。例如:传输过程中的数据丢失等。
干扰噪声:来自外部环境的干扰信号或干扰源引入的数据干扰。例如:电磁干扰。
不相关噪声:数据中存在的与目标任务无关的信息。
将上面的代码放到 pandas 里的 DataFrame 更清楚的查看关系
import pandas as pd
circles = pd.DataFrame({
    "X1": X[:, 0],
    "X2": X[:, 1],
    "label": y
})
print(circles.head(10))

# 结果如下
         X1        X2  label
0  0.754246  0.231481      1
1 -0.756159  0.153259      1
2 -0.815392  0.173282      1
3 -0.393731  0.692883      1
4  0.442208 -0.896723      0
5 -0.479646  0.676435      1
6 -0.013648  0.803349      1
7  0.771513  0.147760      1
8 -0.169322 -0.793456      1
9 -0.121486  1.021509      0
通过这结果,每一个X有两个features (X1 和 X2),并且对应一个label值。label值不是1就是0,说明这是 binary classification.
为了确定X1和X2的数量是否相同
print(circles.label.value_counts())

# 结果如下:
1    500
0    500
Name: label, dtype: int64

# 两个features的数量一致
将数据显示
import matplotlib.pyplot as plt

plt.scatter(x = X[:, 0],
            y = X[:, 1],
            c = y,
            cmap = plt.cm.RdYlBu)
图形如下:
都看到这了,给个赞支持一下呗~