1.首先需要拿到地图,可以从不同的站点寻找,我这里是从hcharts里面找的
//国外地图数据地址:
https://img.hcharts.cn/mapdata/
//国内地图数据地址:
https://datav.aliyun.com/portal/school/atlas/area_selector
2.在项目中引入echarts
3.代码编写
<template>
    <div class="main-container">
        <div id="main"></div>
    </div>
</template>
<script>
import * as echarts from 'echarts'
import SaudiArabia from './SaudiArabia.json' //这里引入的是沙特的地图,需要其他国家的可以在上面的网址上去找
export default {
    name: 'testPage',
    data() {
        return {
            myChart: null,
            option: {}
        }
    },
    mounted() {

        // 基于准备好的dom,初始化echarts实例
        this.myChart = echarts.init(document.getElementById('main'))
        echarts.registerMap('SaudiArabia', SaudiArabia);
        this.option = {
            tooltip: {
                trigger: 'item',
                showDelay: 0,
                transitionDuration: 0.2,
                show: true
            },
            geo: {
                map: 'SaudiArabia',
                roam: true,
                // label: {
                //     // 图上显示名称标签
                //     show: true,
                //     position: 'top'
                // },
                left: 0, top: 0, right: 0, bottom: 0,
                zoom: 1,
            },
            visualMap: {
                left: 'right',
                min: 0,
                max: 13,
                inRange: {
                    color: [
                        '#313695',
                        '#4575b4',
                        '#74add1',
                        '#abd9e9',
                        '#e0f3f8',
                        '#ffffbf',
                        '#fee090',
                        '#fdae61',
                        '#f46d43',
                        '#d73027',
                        '#a50026'
                    ]
                },
                text: ['High', 'Low'],
                show: false
            },
            series: [
                {
                    type: 'effectScatter',
                    coordinateSystem: 'geo',
                    geoIndex: 0,
                    symbolSize: function (params) {
                        console.log(params);
                        return (params[2] / 100) * 15 + 5;
                    },
                    itemStyle: {
                        color: '#b02a02'
                    },
                    dimensions: [
                        {
                            name: 'lng',
                            type: 'number'
                        },
                        {
                            name: 'lat',
                            type: 'number'
                        },
                        {
                            name: 'value',
                            type: 'ordinal'
                        },
                        {
                            name: 'testaaaa',
                            type: 'ordinal'
                        },
                    ],
                    data: [
                        // [-999, 7747, 10],  //最西边-999    34.57566,28.09873
                        // [9851, 4245, 10],  //最东边9851    55.67293,21.99112
                        // [1418, 9851, 10],  //最北边9851    39.24017,32.14280
                        // [3026, 891, 10],   //最南边891     42.77862,16.28674
                        this.mathl(46.75579, 24.49344),
                        this.mathl(46.75479, 24.49344),
                        this.mathl(41.17317494, 18.05285027),
                        this.mathl(46.11985281, 28.97158808)
                    ],
                    tooltip: {
                        trigger: 'item',
                        formatter: function (params) {
                            return `${params.value[3]}</br>${1}`
                        }
                    }
                },
                {
                    type: 'map',
                    coordinateSystem: 'geo',
                    geoIndex: 0,
                    symbolSize: function (params) {
                        return (params[2] / 100) * 15 + 5;
                    },
                    itemStyle: {
                        color: '#b02a02'
                    },
                    data: [
                        {
                            name: 'Tabuk', value: 1,
                        },
                        {
                            name: 'Jizan', value: 2,
                        },
                        {
                            name: 'Najran', value: 3,
                        },
                        {
                            name: 'Ar Riyad', value: 4,
                        },
                        {
                            name: 'Al Madinah', value: 5,
                        },
                        {
                            name: "Ha'il", value: 6,
                        },
                        {
                            name: 'Al Quassim', value: 7,
                        },
                        {
                            name: 'Al Hudud ash Shamaliyah', value: 8,
                        },
                        {
                            name: 'Al Jawf', value: 9,
                        },
                        {
                            name: 'Ash Sharqiyah', value: 10,
                        },
                        {
                            name: 'Al Bahah', value: 11,
                        },
                        {
                            name: '`Asir', value: 12,
                        },
                        {
                            name: 'Makkah', value: 13,
                        },
                    ],
                }
            ]
        };
        this.myChart.setOption(this.option);

        // this.myChart.on('click', function (params) {
        //     console.log(params);
        // });


    },
    methods: {
        mathl(longitude, latitude) {
            let X = null
            let Y = null
            if (longitude < 36.5181644) {
                // 说明X在负半轴
                X = -((36.5181644 - longitude) * 514.28454961)
            } else {
                // X在正半轴
                X = (longitude - 36.5181644) * 514.28454961
            }
            Y = (latitude - 16.28674) * 565.08363 + 891
            return [X, Y, 100, '55']
        }
    }
}
</script>
<style lang="scss" scoped>
#main {
    width: 500px;
    height: 500px;
    border: 1px solid#ccc;
}
</style>
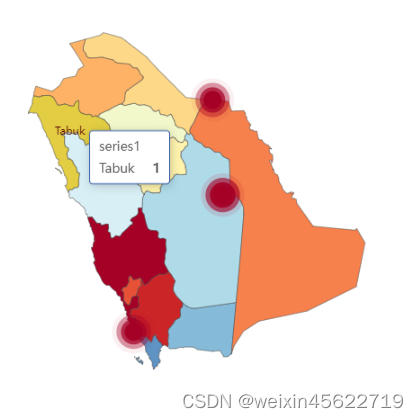
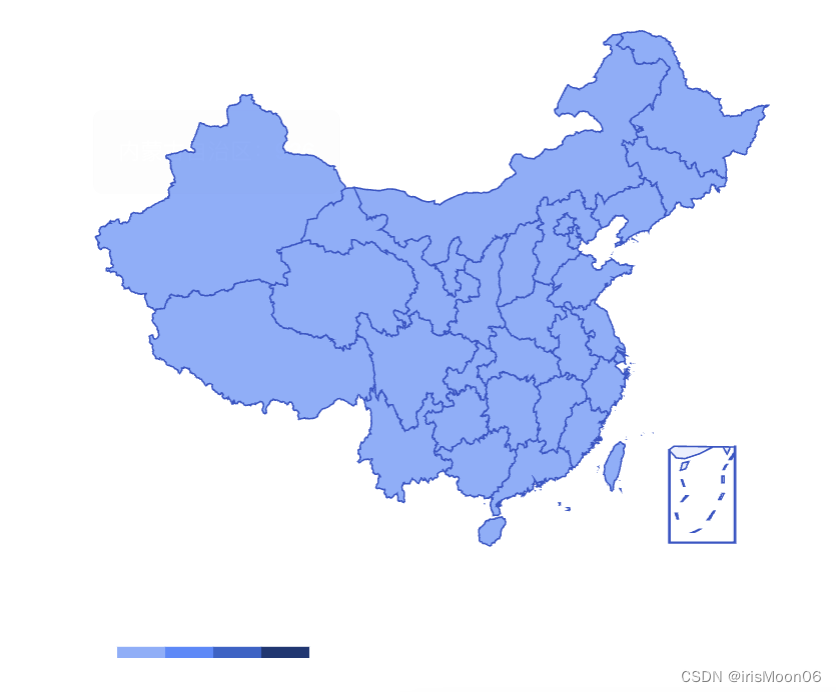
效果展示