一、学习OxyPlot
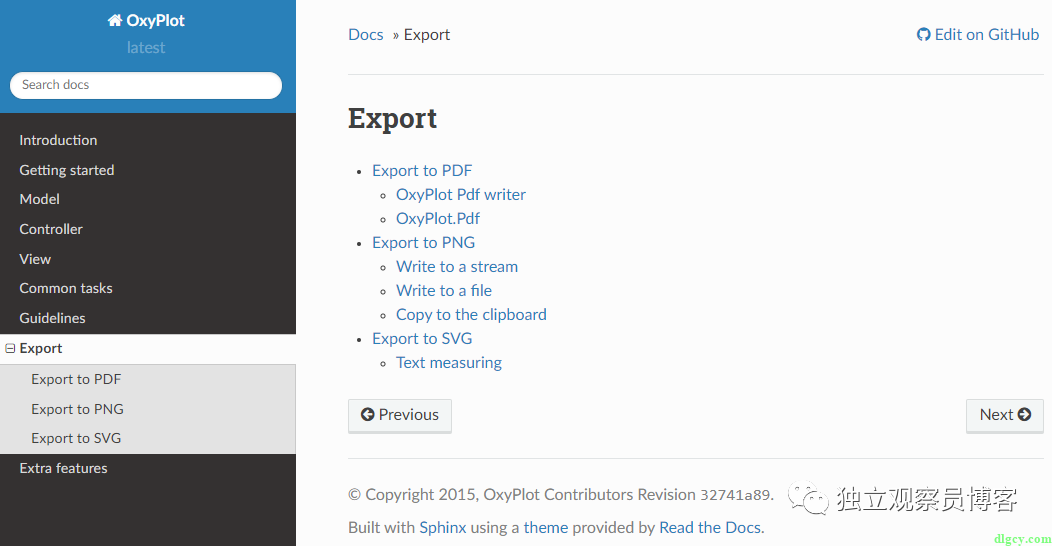
开源地址:https://github.com/oxyplot/oxyplot
最新版:v2.1.2
新建winform,nuget中添加依赖包
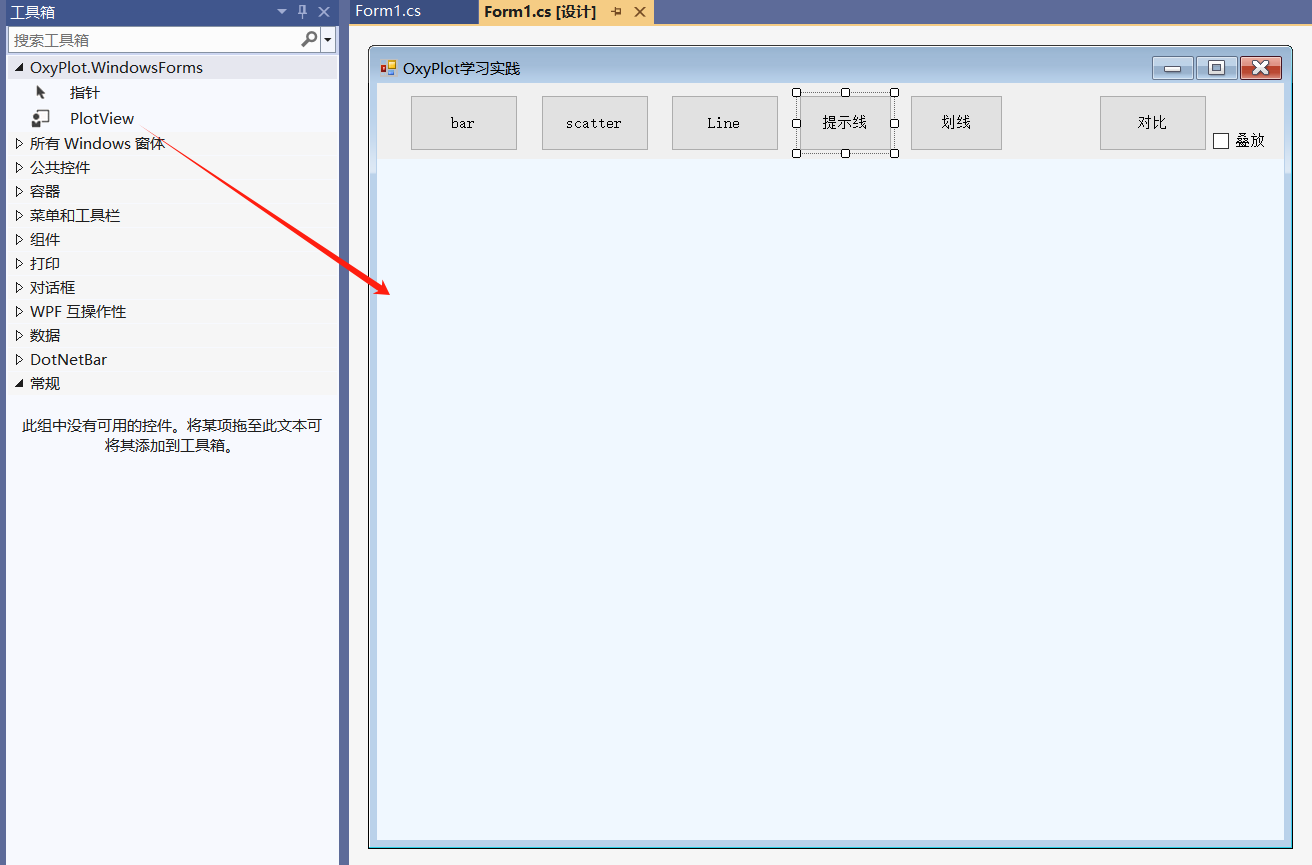
二、写代码
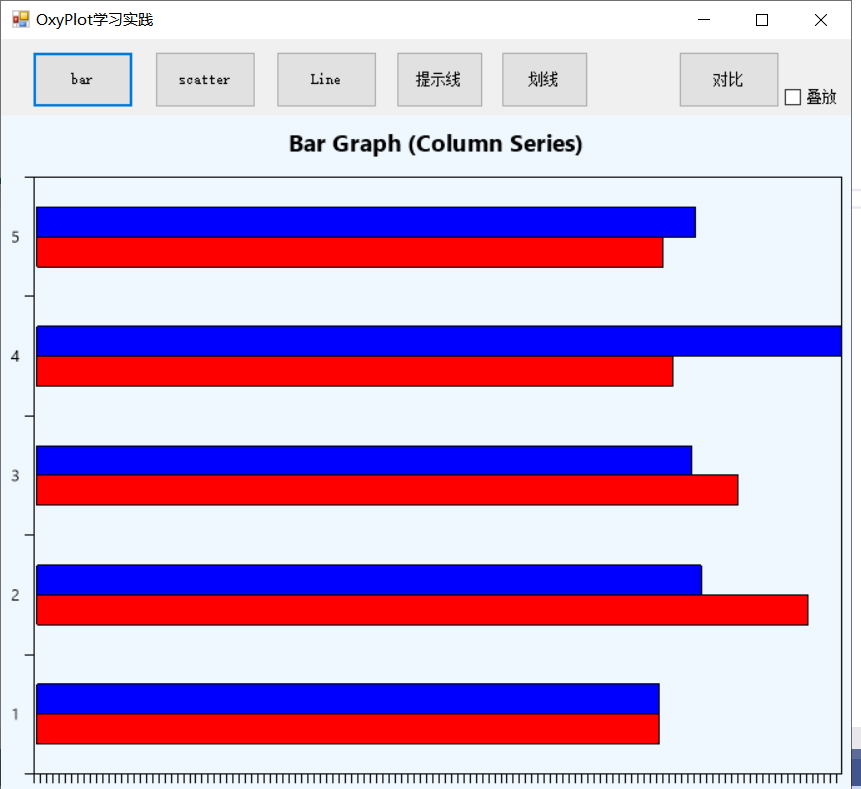
2.1 BarSeries
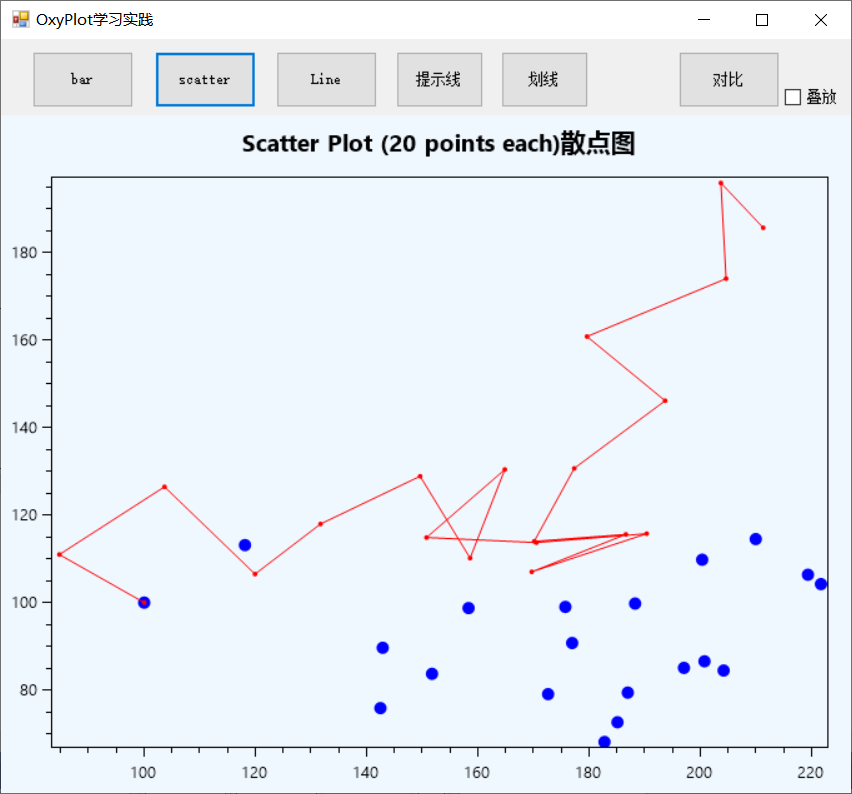
2.2 ScatterSeries
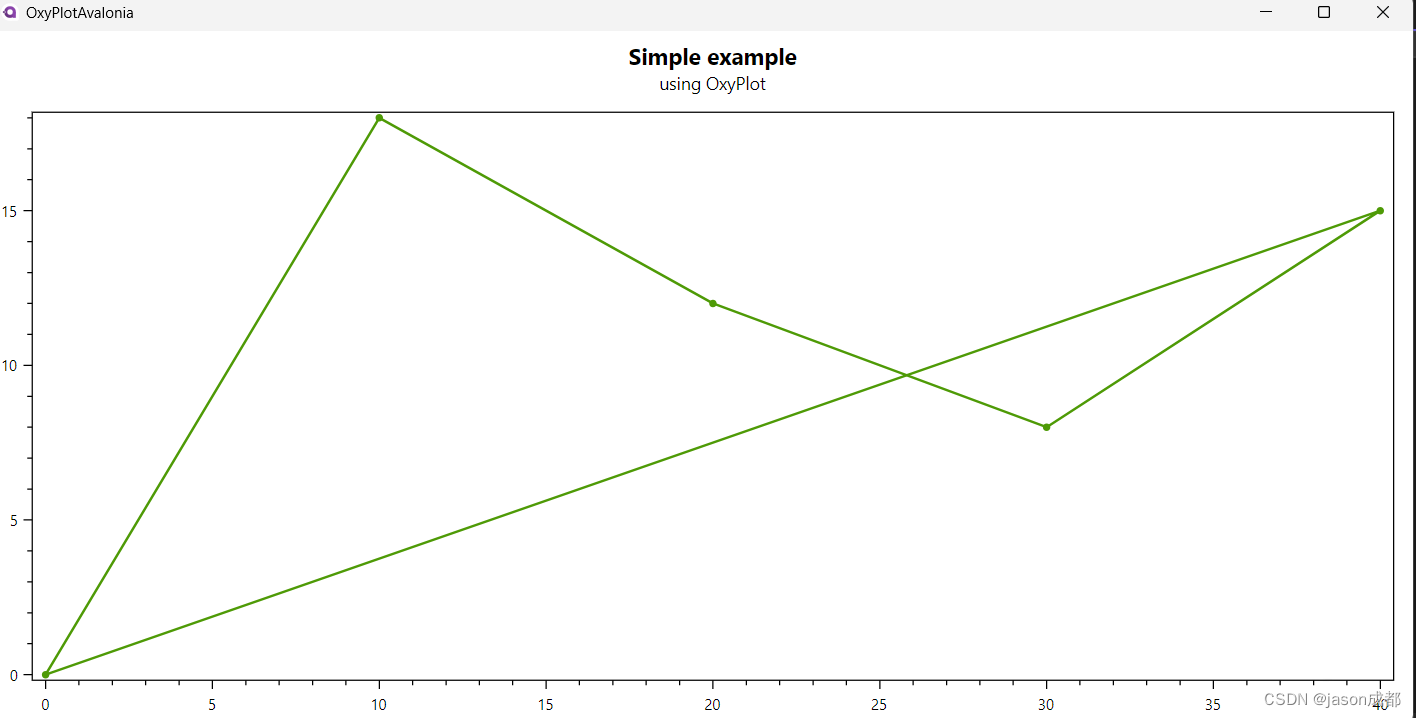
2.3 LineSeries (带指向箭头)
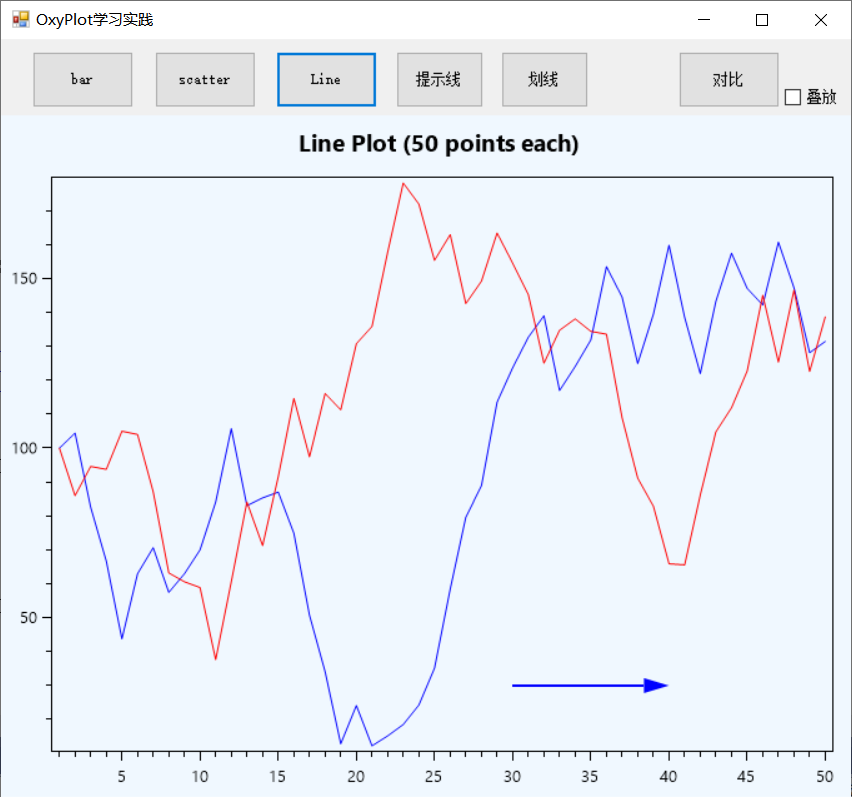
int pointCount = 50;
double[] xs = Consecutive(pointCount);
double[] ys1 = RandomWalk(pointCount);
double[] ys2 = RandomWalk(pointCount);

// create lines and fill them with data points
var line1 = new OxyPlot.Series.LineSeries()
{
    Title = $"Series 1",
    Color = OxyPlot.OxyColors.Blue,
    StrokeThickness = 1,
};

var line2 = new OxyPlot.Series.LineSeries()
{
    Title = $"Series 2",
    Color = OxyPlot.OxyColors.Red,
    StrokeThickness = 1,
};

for (int i = 0; i < pointCount; i++)
{
    line1.Points.Add(new OxyPlot.DataPoint(xs[i], ys1[i]));
    line2.Points.Add(new OxyPlot.DataPoint(xs[i], ys2[i]));
}

// create the model and add the lines to it
var model = new OxyPlot.PlotModel
{
    Title = $"Line Plot ({pointCount:N0} points each)"
};
model.Series.Add(line1);
model.Series.Add(line2);

// load the model into the user control
plotView1.Model = model;

//箭头
var arrowAnnotation = new OxyPlot.Annotations.ArrowAnnotation
{
    StartPoint = new DataPoint(30, 30),
    EndPoint = new DataPoint(40, 30)
};
plotView1.Model.Annotations.Add(arrowAnnotation);
plotView1.Model.InvalidatePlot(true);//刷新绘图区域
2.4 LinearAxis(带提示线)

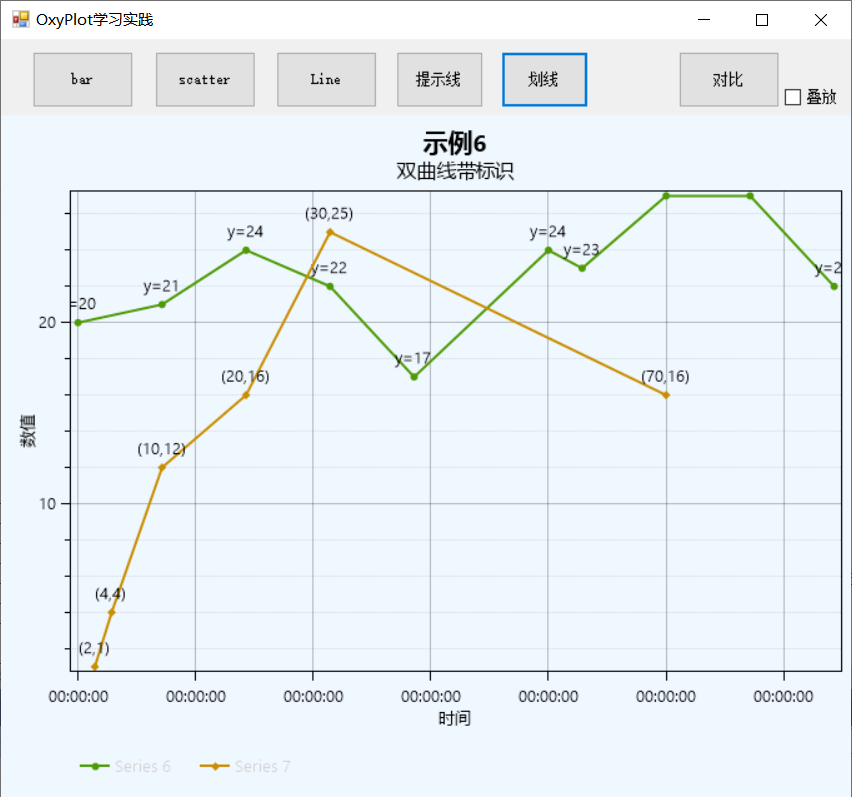
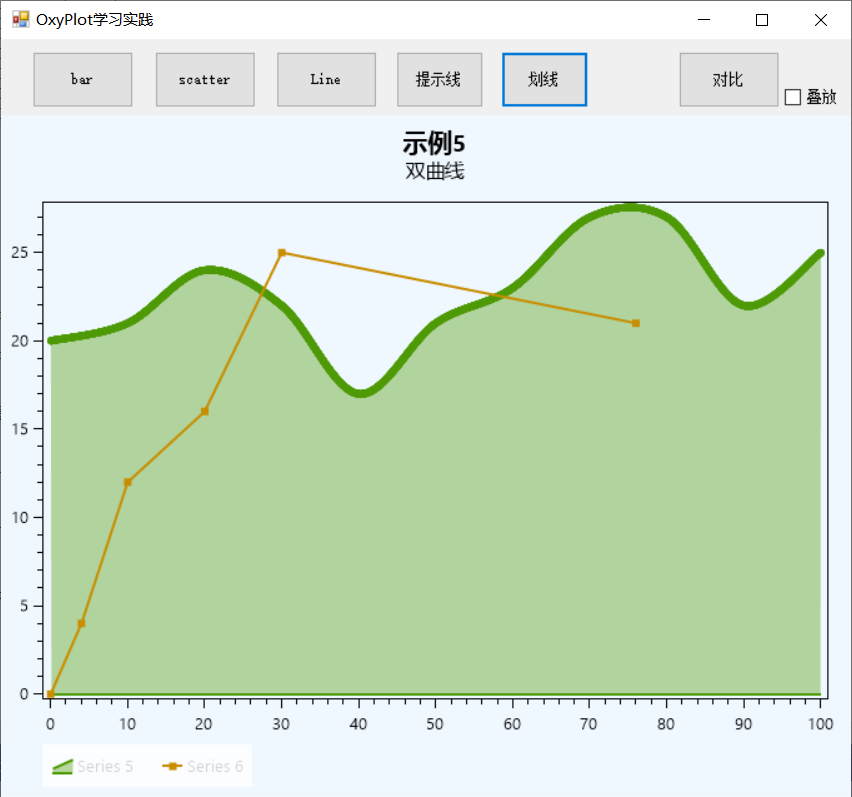
2.5 LineSeries(多实例)
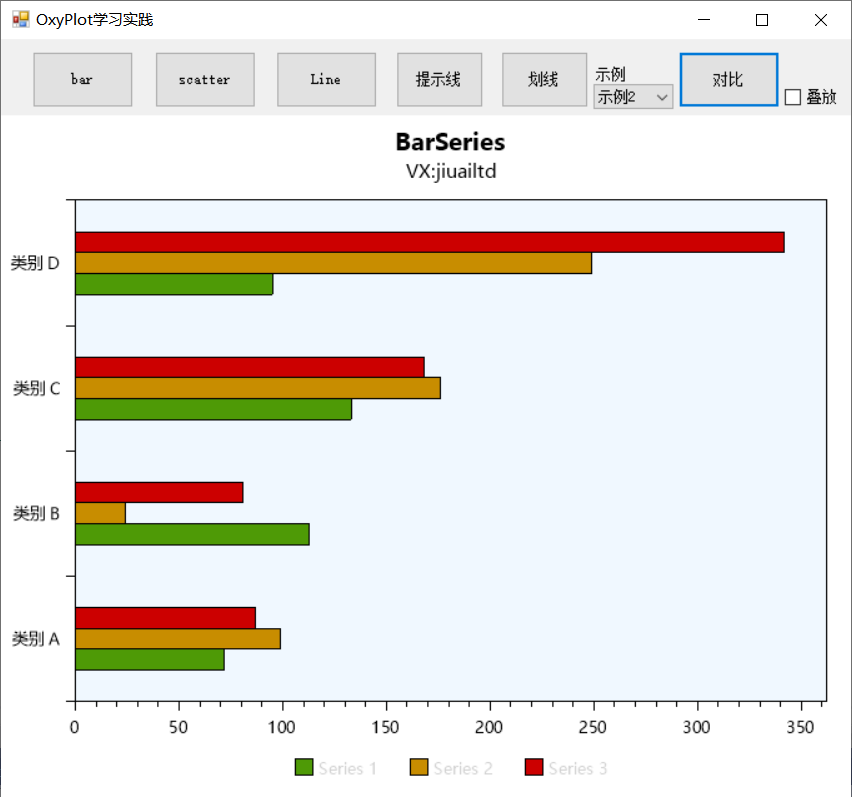
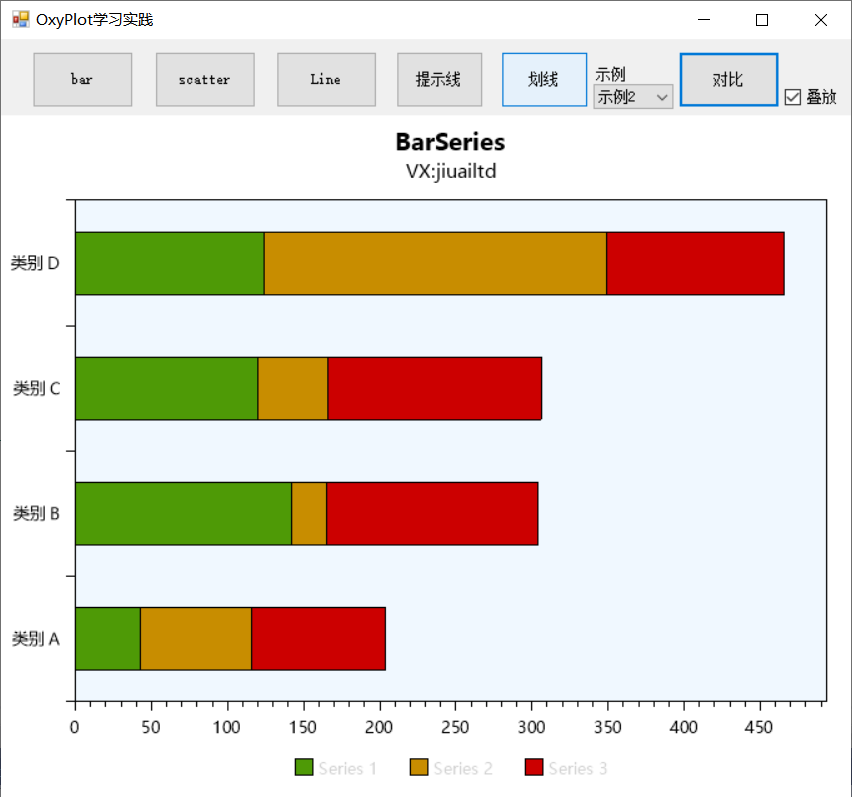
2.6 柱状图(堆叠/排列)
2.7 相关参数注释(参考wpf)
      this.Axes = new ElementCollection(this);              //坐标轴集合;
      this.Series = new ElementCollection(this);            //线条集合;
      this.Annotations = new ElementCollection(this);       //注解;
      this.Legends = new ElementCollection(this);           //图例;
      this.PlotType = PlotType.XY;                          //坐标系类型;
      this.PlotMargins = new OxyThickness(double.NaN);    //外边距
      this.Padding = new OxyThickness(8);                 //内边距
      this.Background = OxyColors.Undefined;              //图表背景
      this.PlotAreaBackground = OxyColors.Undefined;      //图表区域背景
      this.TextColor = OxyColors.Black;                   //图表内的字体颜色(标题、图例、注解、坐标轴)
      this.TitleColor = OxyColors.Automatic;              //标题字体颜色
      this.SubtitleColor = OxyColors.Automatic;           //子标题字体颜色
      this.DefaultFont = "Segoe UI";                      //默认字体
      this.DefaultFontSize = 12;                          //默认字体大小
      this.TitleToolTip = null;                           //标题提示
      this.TitleFont = null;                              //标题字体
      this.TitleFontSize = 18;                            //标题字体大小
      this.TitleFontWeight = FontWeights.Bold;            //标题字重
      this.SubtitleFont = null;                           //子标题字体
      this.SubtitleFontSize = 14;                         //子标题字体大小
      this.SubtitleFontWeight = FontWeights.Normal;       //子标题字重
      this.TitlePadding = 6;                              //标题内边距
      this.ClipTitle = true;                              //是否裁剪标题
      this.TitleClippingLength = 0.9;                     //标题裁剪矩形长度
      this.PlotAreaBorderColor = OxyColors.Black;             //图表区域边框颜色
      this.PlotAreaBorderThickness = new OxyThickness(1);     //图表区域边框大小
      this.EdgeRenderingMode = EdgeRenderingMode.Automatic;   //边角渲染模式
      this.AssignColorsToInvisibleSeries = true;              //是否自动分配颜色给不可见的线条
      this.IsLegendVisible = true;                            //图例是否可见(要使用图例则必须设置线条标题)

      ***其他属性****
      RenderingDecorator  //渲染装饰器
      Subtitle            //子标题
      Title               //标题
      TitleHorizontalAlignment    //标题和子标题的水平对齐方式


      ***Annotation**注解
      Layer               //注解渲染层(默认为AboveSeries)
      XAxis               //X轴
      XAxisKey            //X轴的键
      YAxis               //Y轴
      YAxisKey            //Y轴的键
      ClipByXAxis         //是否由X轴范围裁剪
      ClipByYAxis         //是否由Y轴范围裁剪

      ***Series***
      Background          //背景色
      IsVisible           //是否可见
      Title               //标题
      LegendKey           //对应的图例的键
      SeriesGroupName     //分组名称
      RenderInLegend      //是否在图例中显示
      TrackerFormatString //Tracker格式化字符串
      TrackerKey          //对应的Tracker的键

      参考https://dlgcy.com/oxyplot-wpf-public-props/
      使用备忘https://dlgcy.com/oxyplot-wpf-use-way/
更多内容,vx私信交流。jiuailtd