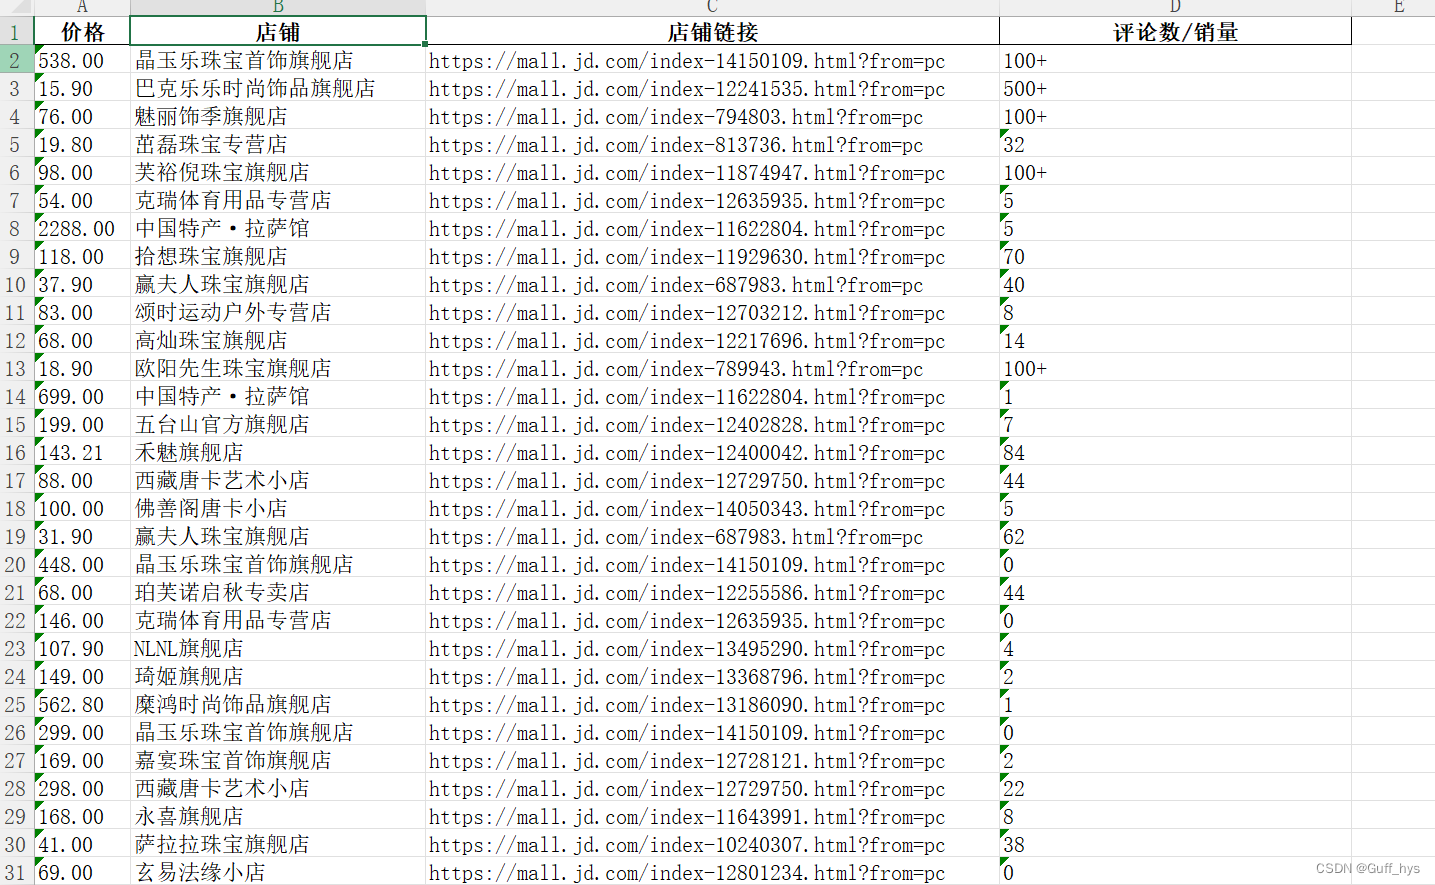
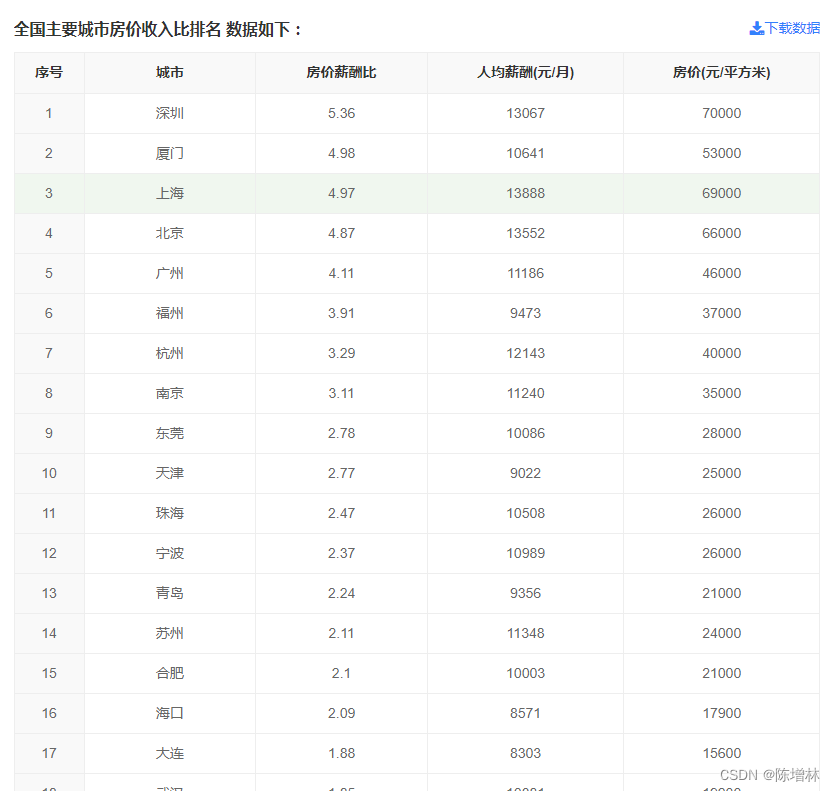
数据来源:聚合数据
from selenium import webdriver
from bs4 import BeautifulSoup
import csv
from selenium import webdriver
from fake_useragent import UserAgent
import random
import subprocess
from selenium import webdriver
from selenium.webdriver.support.ui import WebDriverWait
from selenium.webdriver.support import expected_conditions as EC
from selenium.webdriver.common.by import By
import os

ips = []
with open('ip.txt', 'r') as f:
    for line in f:
        ip = line.strip()
        ips.append(ip.strip())

# 启动Chrome浏览器调试服务
subprocess.Popen('cmd', shell=True)
subprocess.Popen('"chrome-win64\chrome.exe" --remote-debugging-port=9222', shell=True)

chrome_options = webdriver.ChromeOptions()
chrome_options.add_experimental_option("debuggerAddress", "localhost:9222")
chrome_options.add_argument('--headless')
chrome_options.add_argument('--disable‐gpu')
chrome_options.add_argument("--disable-blink-features=AutomationControlled")
chrome_options.add_argument('--proxy-server=http://' + random.choice(ips))
chrome_options.add_argument(f"user-agent={UserAgent().random}")
driver = webdriver.Chrome(options=chrome_options)


# 打开网页
url = 'https://fangjia.gotohui.com/topic-3403'
driver.get(url)

# 等待表格加载完成
table_locator = (By.CSS_SELECTOR, 'table.ntable.ntable2.table-hover')
table = WebDriverWait(driver, 10).until(EC.presence_of_element_located(table_locator))

# 获取表格的HTML内容
table_html = table.get_attribute('outerHTML')

# 使用 BeautifulSoup 解析表格
soup = BeautifulSoup(table_html, 'html.parser')

folder_path = os.getcwd()+"/data/收入比/"
if not os.path.exists(folder_path):
    os.makedirs(folder_path)

# 打开CSV文件进行写入
with open(folder_path+'收入比.csv', 'w', newline='', encoding='utf-8') as csvfile:
    writer = csv.writer(csvfile)
    writer.writerow(['序号', '城市', '房价收入比', '人均收入(元/月)', '房价(元/平方米)'])
    rows = soup.find('tbody').find_all('tr')

    # 遍历每一行并提取数据
    for row in rows:
        cells = row.find_all('td')
        row_data = [cell.text.strip() for cell in cells]
        writer.writerow(row_data)

# 关闭 WebDriver
driver.quit()

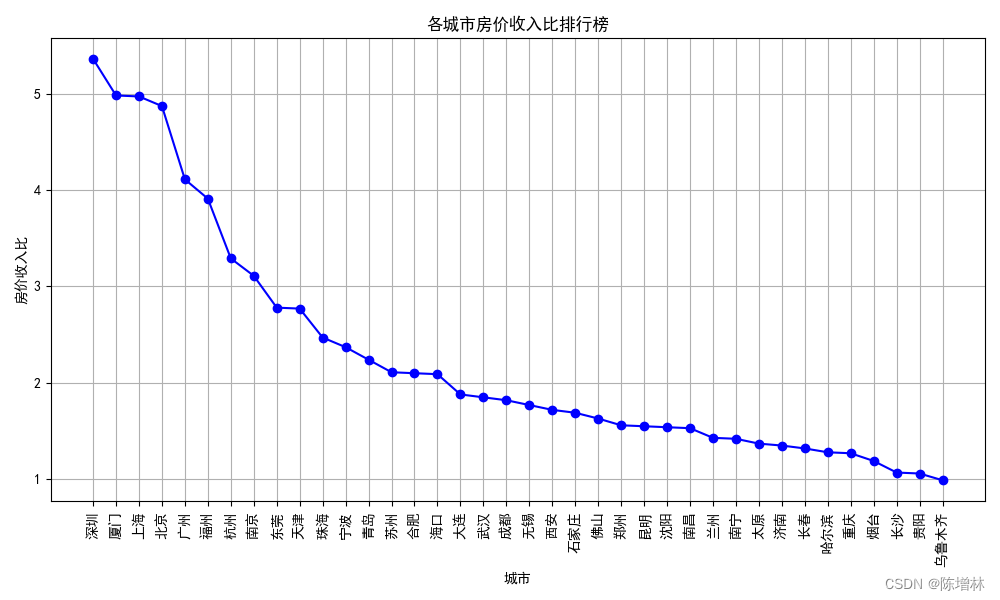
可视化
import pandas as pd
import matplotlib.pyplot as plt
import os

folder_path = os.getcwd()+"/data/收入比/"
if not os.path.exists(folder_path):
    os.makedirs(folder_path)

# 读取 CSV 文件
df_income = pd.read_csv(folder_path+'收入比.csv')

# 设置全局字体
plt.rcParams['font.sans-serif'] = ['SimHei']  # 使用微软雅黑字体,可以显示中文
plt.rcParams['axes.unicode_minus'] = False  # 解决负号显示问题

# 可视化显示
plt.figure(figsize=(10, 6))

# 绘制城市与房价收入比的折线图
plt.plot(df_income['城市'], df_income['房价收入比'], marker='o', color='blue', linestyle='-')
plt.xlabel('城市')
plt.ylabel('房价收入比')
plt.title('各城市房价收入比排行榜')
plt.xticks(rotation=90)  # 旋转x轴标签,以便更好地显示城市名
plt.grid(True)  # 显示网格线
plt.tight_layout()  # 调整布局,防止标签重叠
plt.show()