Backtrader 量化回测实践(2)—— K线形态定义
单根K线图形中的"光头光脚"、"十字星"和"T字星"是常见的技术分析图形,它们在分析股价趋势和价格逆转时有一定的用途。
通过程序定义形态。
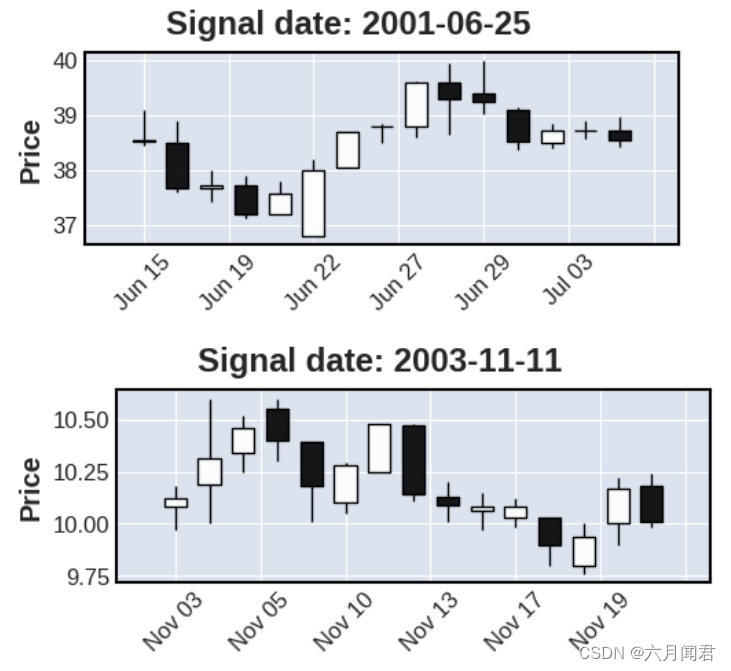
1. 全秃大阳线
(1)代码
#1、全秃大阳线(极端强势)
# 开盘就是最低价,收盘就是最高价,收盘价大于开盘价
signal = []
for t_date in df.index :
    if df.loc[t_date,'open']==df.loc[t_date,'low'] and df.loc[t_date,'close']==df.loc[t_date,'high'] and df.loc[t_date,'close']>df.loc[t_date,'open']:
        signal.append(t_date)

# 只显示两个图示
counter = 0
for i in signal:
  if counter < 2 :
    begin_date = i + datetime.timedelta(days=-10)
    end_date = i + datetime.timedelta(days=10)
    # 按时间段绘图
    df_candle = df.loc[(df.index>=begin_date.strftime("%Y-%m-%d")) & (df.index<=end_date.strftime("%Y-%m-%d"))]
    mpf.plot(df_candle , type='candle', title='Signal date: ' +i.strftime("%Y-%m-%d") ,figsize=(6,2))
    mpf.show()
    counter += 1

# 只显示两个符合条件的数据
counter = 0
for i in signal:
  if counter < 2 :
    begin_date = i + datetime.timedelta(days=-10)
    end_date = i + datetime.timedelta(days=10)

    df_candle = df.loc[(df.index>=begin_date.strftime("%Y-%m-%d")) & (df.index<=end_date.strftime("%Y-%m-%d"))]
    # 按时间段数据
    print(df_candle[['open','high','low','close']])
    counter += 1
(2)图示
(3)数据
             open   high    low  close
trade_date
2001-06-15  38.52  39.10  38.45  38.54
2001-06-18  38.50  38.88  37.60  37.66
2001-06-19  37.66  37.99  37.43  37.72
2001-06-20  37.72  37.90  37.11  37.19
2001-06-21  37.19  37.79  37.19  37.56
2001-06-22  36.80  38.20  36.80  38.00
2001-06-25  38.03  38.68  38.03  38.68
2001-06-26  38.78  38.84  38.50  38.80
2001-06-27  38.80  39.61  38.60  39.60
2001-06-28  39.60  39.95  38.65  39.29
2001-06-29  39.40  39.98  39.01  39.24
2001-07-02  39.10  39.15  38.37  38.52
2001-07-03  38.50  38.85  38.40  38.71
2001-07-04  38.71  38.90  38.56  38.71
2001-07-05  38.71  38.96  38.41  38.53
             open   high    low  close
trade_date
2003-11-03  10.08  10.18   9.97  10.12
2003-11-04  10.19  10.60  10.00  10.31
2003-11-05  10.34  10.52  10.25  10.46
2003-11-06  10.55  10.60  10.30  10.40
2003-11-07  10.39  10.39  10.01  10.18
2003-11-10  10.10  10.29  10.05  10.28
2003-11-11  10.25  10.48  10.25  10.48
2003-11-12  10.47  10.48  10.11  10.14
2003-11-13  10.13  10.20  10.01  10.09
2003-11-14  10.06  10.15   9.97  10.08
2003-11-17  10.03  10.12   9.98  10.08
2003-11-18  10.03  10.03   9.80   9.90
2003-11-19   9.80  10.00   9.76   9.94
2003-11-20  10.00  10.22   9.90  10.17
2003-11-21  10.18  10.24   9.98  10.01
2.全秃大阴线
(1)代码
#2、全秃大阴线(极端弱势)
# 开盘就是最高价,收盘就是最低价,开盘价大于收盘价
signal = []
for t_date in df.index :
    if df.loc[t_date,'open']==df.loc[t_date,'high'] and df.loc[t_date,'close']==df.loc[t_date,'low'] and df.loc[t_date,'open']>df.loc[t_date,'close']:
        signal.append(t_date)

# 只显示两个图示
counter = 0
for i in signal:
  if counter < 2 :
    begin_date = i + datetime.timedelta(days=-10)
    end_date = i + datetime.timedelta(days=10)
    # 按时间段绘图
    df_candle = df.loc[(df.index>=begin_date.strftime("%Y-%m-%d")) & (df.index<=end_date.strftime("%Y-%m-%d"))]
    mpf.plot(df_candle , type='candle', title='Signal date: ' +i.strftime("%Y-%m-%d") ,figsize=(6,2))
    mpf.show()
    counter += 1

# 只显示两个符合条件的数据
counter = 0
for i in signal:
  if counter < 2 :
    begin_date = i + datetime.timedelta(days=-10)
    end_date = i + datetime.timedelta(days=10)

    df_candle = df.loc[(df.index>=begin_date.strftime("%Y-%m-%d")) & (df.index<=end_date.strftime("%Y-%m-%d"))]
    # 按时间段数据
    print(df_candle[['open','high','low','close']])
    counter += 1
(2)图示

(3)数据
            open  high   low  close
trade_date
2004-06-14  6.14  6.18  5.99   6.02
2004-06-15  6.03  6.20  6.00   6.18
2004-06-16  6.18  6.28  6.08   6.17
2004-06-17  6.15  6.17  6.04   6.09
2004-06-18  6.06  6.08  6.00   6.07
2004-06-21  6.08  6.16  6.02   6.11
2004-06-22  6.11  6.21  6.09   6.19
2004-06-23  6.19  6.22  6.12   6.15
2004-06-24  6.15  6.15  6.09   6.09
2004-06-25  6.09  6.16  6.02   6.05
2004-06-28  6.05  6.18  5.95   6.08
2004-06-29  6.08  6.22  6.02   6.14
2004-06-30  6.14  6.17  6.10   6.12
2004-07-01  6.10  6.33  6.08   6.29
2004-07-02  6.32  6.36  6.21   6.31
            open  high   low  close
trade_date
2005-01-10  6.70  6.82  6.66   6.82
2005-01-11  6.86  6.88  6.75   6.80
2005-01-12  6.80  6.84  6.70   6.78
2005-01-13  6.77  6.81  6.68   6.75
2005-01-14  6.76  6.88  6.74   6.79
2005-01-17  6.77  6.77  6.55   6.61
2005-01-18  6.58  6.70  6.57   6.69
2005-01-19  6.72  6.74  6.65   6.73
2005-01-20  6.70  6.70  6.60   6.60
2005-01-21  6.59  6.83  6.45   6.80
2005-01-24  6.88  6.97  6.80   6.84
2005-01-25  6.85  7.00  6.77   7.00
2005-01-26  7.00  7.08  6.90   6.98
2005-01-27  6.97  6.97  6.80   6.83
2005-01-28  6.83  6.98  6.79   6.95
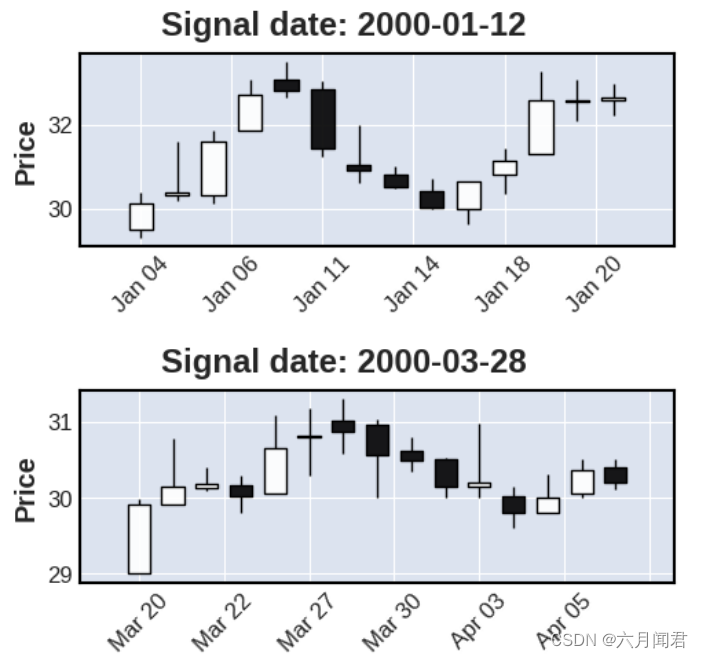
3. 阳线十字星
(1)代码
#3、阳线十字星
# 收盘价大于开盘价,K线体 / 上下影线的长度占比 < 1/3
signal = []
for t_date in df.index :
    k_body = df.loc[t_date,'close'] - df.loc[t_date,'open']
    k_shadow_up = df.loc[t_date,'high'] - df.loc[t_date,'close']
    k_shadow_down = df.loc[t_date,'open'] - df.loc[t_date,'low']
    k_shadow = abs(k_shadow_up) + abs(k_shadow_down)

    #上下影线的长度 占比 1/3 ,可以调整
    if k_shadow != 0 : # 无影线的情况不考虑
        if df.loc[t_date,'close']>df.loc[t_date,'open'] and k_body/k_shadow < 1/3:
            signal.append(t_date)

counter = 0
for i in signal:
  if counter < 2 :
    begin_date = i + datetime.timedelta(days=-10)
    end_date = i + datetime.timedelta(days=10)
    # 按时间段绘图
    df_candle = df.loc[(df.index>=begin_date.strftime("%Y-%m-%d")) & (df.index<=end_date.strftime("%Y-%m-%d"))]
    mpf.plot(df_candle , type='candle', title='Signal date: ' +i.strftime("%Y-%m-%d") ,figsize=(6,2))
    mpf.show()
    counter += 1

counter = 0
for i in signal:
  if counter < 2 :
    begin_date = i + datetime.timedelta(days=-10)
    end_date = i + datetime.timedelta(days=10)

    df_candle = df.loc[(df.index>=begin_date.strftime("%Y-%m-%d")) & (df.index<=end_date.strftime("%Y-%m-%d"))]
    # 按时间段数据
    print(df_candle[['open','high','low','close']])
    counter += 1
(2)图示

(3)数据
            open   high    low  close
trade_date
2000-01-04  29.50  30.38  29.30  30.10
2000-01-05  30.30  31.60  30.17  30.38
2000-01-06  30.30  31.88  30.10  31.60
2000-01-07  31.88  33.10  31.86  32.71
2000-01-10  33.10  33.50  32.67  32.81
2000-01-11  32.86  33.06  31.25  31.44
2000-01-12  31.05  32.00  30.60  30.90
2000-01-13  30.80  31.00  30.48  30.50
2000-01-14  30.40  30.70  29.98  30.01
             open   high    low  close
trade_date
2000-01-10  33.10  33.50  32.67  32.81
2000-01-11  32.86  33.06  31.25  31.44
2000-01-12  31.05  32.00  30.60  30.90
2000-01-13  30.80  31.00  30.48  30.50
2000-01-14  30.40  30.70  29.98  30.01
2000-01-17  29.99  30.66  29.61  30.66
2000-01-18  30.80  31.45  30.36  31.15
2000-01-19  31.30  33.28  31.30  32.58
2000-01-20  32.56  33.10  32.10  32.58
2000-01-21  32.60  32.99  32.22  32.65
2000-01-24  32.85  34.35  32.75  33.59
2000-01-25  34.00  34.20  32.65  32.70
2000-01-26  35.95  35.95  32.35  32.67
2000-01-27  32.70  32.88  31.52  31.95
2000-01-28  32.00  33.40  31.00  33.30
4.阴线十字星
(1)代码
#4、阴线十字星
# 收盘价小于开盘价,K线体 / 上下影线的长度占比 < 1/3
signal = []
for t_date in df.index :
    k_body = abs(df.loc[t_date,'close'] - df.loc[t_date,'open'])
    k_shadow_up = df.loc[t_date,'high'] - df.loc[t_date,'open']
    k_shadow_down = df.loc[t_date,'close'] - df.loc[t_date,'low']
    k_shadow = abs(k_shadow_up) + abs(k_shadow_down)

    #上下影线的长度 占比 1/3 ,可以调整
    if k_shadow != 0 : # 无影线的情况不考虑
        if df.loc[t_date,'open']>df.loc[t_date,'close'] and k_body/k_shadow < 1/3:
            signal.append(t_date)

counter = 0
for i in signal:
  if counter < 2 :
    begin_date = i + datetime.timedelta(days=-10)
    end_date = i + datetime.timedelta(days=10)
    # 按时间段绘图
    df_candle = df.loc[(df.index>=begin_date.strftime("%Y-%m-%d")) & (df.index<=end_date.strftime("%Y-%m-%d"))]
    mpf.plot(df_candle , type='candle', title='Signal date: ' +i.strftime("%Y-%m-%d") ,figsize=(6,2))
    mpf.show()
    counter += 1

counter = 0
for i in signal:
  if counter < 2 :
    begin_date = i + datetime.timedelta(days=-10)
    end_date = i + datetime.timedelta(days=10)

    df_candle = df.loc[(df.index>=begin_date.strftime("%Y-%m-%d")) & (df.index<=end_date.strftime("%Y-%m-%d"))]
    # 按时间段数据
    print(df_candle[['open','high','low','close']])
    counter += 1
(2)图示
(3)数据
             open   high    low  close
trade_date
2000-01-04  29.50  30.38  29.30  30.10
2000-01-05  30.30  31.60  30.17  30.38
2000-01-06  30.30  31.88  30.10  31.60
2000-01-07  31.88  33.10  31.86  32.71
2000-01-10  33.10  33.50  32.67  32.81
2000-01-11  32.86  33.06  31.25  31.44
2000-01-12  31.05  32.00  30.60  30.90
2000-01-13  30.80  31.00  30.48  30.50
2000-01-14  30.40  30.70  29.98  30.01
2000-01-17  29.99  30.66  29.61  30.66
2000-01-18  30.80  31.45  30.36  31.15
2000-01-19  31.30  33.28  31.30  32.58
2000-01-20  32.56  33.10  32.10  32.58
2000-01-21  32.60  32.99  32.22  32.65
             open   high    low  close
trade_date
2000-03-20  29.00  29.98  29.00  29.90
2000-03-21  29.90  30.78  29.90  30.14
2000-03-22  30.12  30.40  30.08  30.17
2000-03-23  30.16  30.28  29.80  30.02
2000-03-24  30.05  31.09  30.05  30.65
2000-03-27  30.80  31.17  30.28  30.82
2000-03-28  31.01  31.30  30.58  30.86
2000-03-29  30.95  31.03  30.00  30.56
2000-03-30  30.61  30.80  30.35  30.48
2000-03-31  30.50  30.52  30.00  30.15
2000-04-03  30.15  30.97  30.00  30.20
2000-04-04  30.01  30.15  29.60  29.80
2000-04-05  29.80  30.30  29.80  30.00
2000-04-06  30.05  30.50  30.00  30.36
2000-04-07  30.40  30.50  30.10  30.19