import warnings
warnings.filterwarnings('ignore')

import os

import numpy as np
from scipy.stats import norm
import pandas as pd

import seaborn as sns
import matplotlib.pyplot as plt
get_ipython().run_line_magic('matplotlib', 'inline')

plt.rcParams['font.sans-serif'] = ['SimHei']
plt.rcParams['axes.unicode_minus'] = False

import cartopy.crs as ccrs
import geopandas as gpd
import cartopy.io.shapereader as shpreader
from shapely.geometry import Polygon
from matplotlib.patches import Polygon as mpl_polygon
甲状腺结节数据
res={}
result= pd.DataFrame(res)
result.head()
|
地区1 |
是否异常 |
总人数 |
检出率 |
| 0 |
云南 |
8 |
18 |
44.44 |
| 1 |
内蒙古 |
9 |
18 |
50.00 |
| 2 |
北京 |
6 |
18 |
33.33 |
| 3 |
吉林 |
18 |
18 |
100.00 |
| 4 |
四川 |
9 |
18 |
50.00 |
加载边界数据
country_CN = gpd.read_file('ChinaAdminDivisonSHP/1. Country/country.shp', encoding='utf-8')  # 用高德最新API,国家
province_CN = gpd.read_file('ChinaAdminDivisonSHP/2. Province/province.shp', encoding='utf-8') # 省份
nine_dotted_line = gpd.read_file('ChinaAdminDivisonSHP/5. NineDot/china_nine_dotted_line.shp', encoding='utf-8') # 九段线
df_pcenter = pd.read_csv('ChinaAdminDivisonSHP/省市中心坐标位置LBC各省市中心.csv', encoding='gbk') # 区域中心
颜色映射
from matplotlib.colors import Normalize, rgb2hex
from matplotlib.cm import ScalarMappable
vmin=result['检出率'].min()
vmax=result['检出率'].max()
# 创建 Normalize 对象,用于将数据映射到 [0, 1] 范围
norm = Normalize(vmin=vmin, vmax=vmax)
# 创建 ScalarMappable 对象,用于将归一化后的数据映射到颜色映射中,注意左侧0,右侧1,色板:
# https://matplotlib.org/3.1.0/tutorials/colors/colormaps.html
sm = ScalarMappable(cmap='OrRd', norm=norm)
# 将数据映射为颜色数组
colors = sm.to_rgba(result['检出率'])
# 将颜色数组转换为十六进制格式的颜色数组
hex_colors = [rgb2hex(color) for color in colors]
绘图
result['hex_colors']=hex_colors
result['geometry'] = [province_CN[province_CN['pr_name'].str.contains(p)]['geometry'] for p in result['地区1'].tolist()]
result.head()
|
地区1 |
是否异常 |
总人数 |
检出率 |
hex_colors |
geometry |
| 0 |
云南 |
8 |
18 |
44.44 |
#fdbb85 |
24 POLYGON ((97.72048 24.96677, 97.71953 24... |
| 1 |
内蒙古 |
9 |
18 |
50.00 |
#fca36e |
4 POLYGON ((124.52522 48.14594, 124.52310 4... |
| 2 |
北京 |
6 |
18 |
33.33 |
#fdd49f |
0 POLYGON ((116.77565 40.02168, 116.77456 4... |
| 3 |
吉林 |
18 |
18 |
100.00 |
#7f0000 |
6 POLYGON ((129.59213 42.44687, 129.59630 4... |
| 4 |
四川 |
9 |
18 |
50.00 |
#fca36e |
22 MULTIPOLYGON (((107.05537 30.04027, 107.... |
# 创建地图投影
crs = ccrs.LambertConformal(central_longitude=105, central_latitude=35, standard_parallels=(30, 60))
# 创建子图
fig, ax = plt.subplots(figsize=(16, 9), subplot_kw={'projection': crs})
# 绘制国界
ax.add_geometries(country_CN['geometry'], crs=ccrs.PlateCarree(), edgecolor='black', facecolor='none')
# 绘制九段线
ax.add_geometries(nine_dotted_line['geometry'], crs=ccrs.PlateCarree(), edgecolor='black', facecolor='none')
# 绘制各省颜色
for i in range(result.shape[0]):
province = result['地区1'].iloc[i]
num = result['检出率'].iloc[i]
colors_i = result['hex_colors'].iloc[i]
geometry = result['geometry'].iloc[i]
ax.add_geometries(geometry, crs=ccrs.PlateCarree(), edgecolor=colors_i, facecolor=colors_i)
lat = float(df_pcenter[df_pcenter['所在省'].str.contains(province)].iloc[0]['纬度'])
lon = float(df_pcenter[df_pcenter['所在省'].str.contains(province)].iloc[0]['经度'])
ax.text(lon, lat, str(num), transform=ccrs.PlateCarree(), fontsize=12, color='black')
# 标注北京
im = ax.scatter(116.46, 39.92, transform=ccrs.PlateCarree(), s=200, color='red', marker='*')
# 添加色值条
im.set_cmap(cmap='OrRd')
# 显示右侧渐变色值条
cbar = fig.colorbar(im, ax=ax)
# 设置色值条范围和标签
cbar.set_ticks([0,0.5, 1]) # 设置色值条刻度位置
cbar.set_ticklabels([int(vmin),int((vmin+vmax)/2), int(vmax)]) # 设置刻度标签
# 色值条
cbar.ax.set_ylabel('色值条', rotation=270, labelpad=10)
# 调整标签字体大小
cbar.ax.yaxis.label.set_fontsize(12)
# 设置地图范围
ax.set_extent([73, 135, 12, 53], crs=ccrs.PlateCarree())
# 设置标题
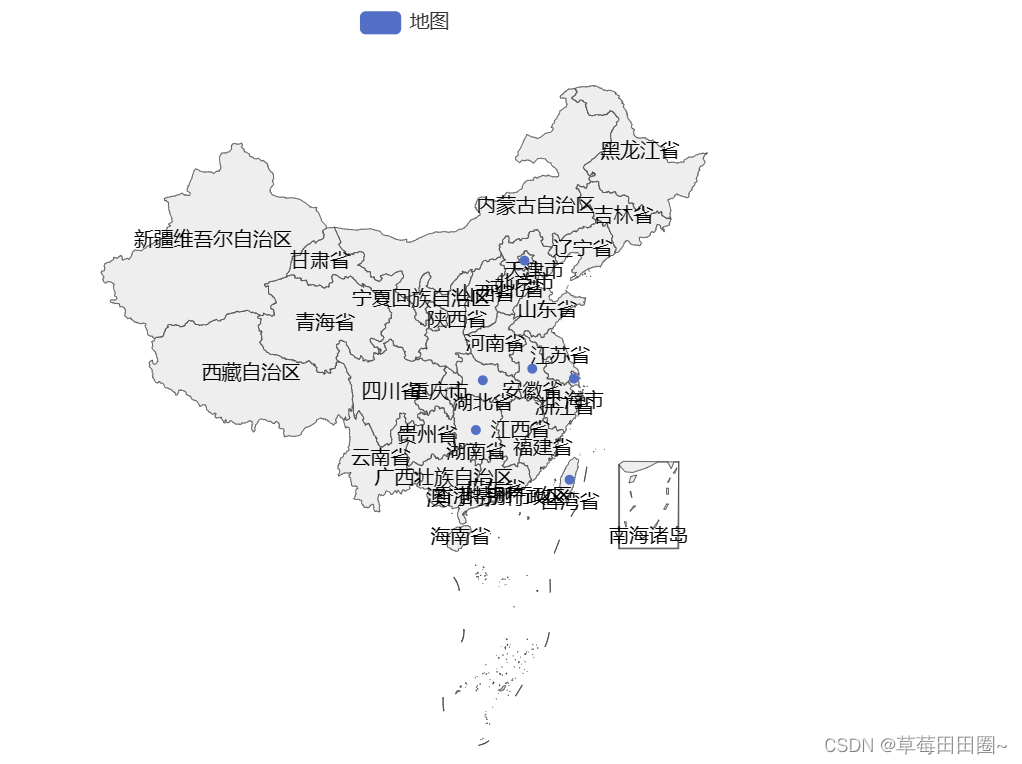
ax.set_title('中国各省某数据检出率')
# 显示图像
plt.show()