一、背景
工作中我们经常遇到CPU 负载高,CPU负载高意味着什么? CPU的负载是怎么计算的? top指令中的各个指标代表什么含义?
二、CPU 负载计算方法
在系统出现负载问题,通常会使用uptime和top确认负载,这两个命令代表的含义是什么?
1、首先看uptime
geek@CNSZX-4N7FGK3:~$ uptime
22:13:59, up 2 min, 0 users, load average: 0.52, 0.58, 0.59
当前时间, 系统启动的总时间, 当前user数, load average 后的三个数分别是 1分钟,5分钟,15 分钟的平均负载
man uptime System load averages is the average number of processes that are either in a runnable or uninterruptable state. A process in a runnable state is either using the CPU or waiting to use the CPU. A process in uninterruptable state is waiting for some I/O access, eg waiting for disk. The averages are taken over the three time intervals. Load averages are not normalized for the number of CPUs in a system, so a load average of 1 means a single CPU system is loaded all the time while on a 4 CPU system it means it was idle 75% of the time.
关于平均负载的解释(注意,如上面的),是进程处于runnable和uninterruptable状态的平均数;
当这个值为1时,如果我们的系统有4个CPU那么表示,系统大概有75%的时间处于空闲(idle状态);
如果我们只有2个CPU 表示 系统有50%时间处于空闲。
这三个值的差异反应了当前系统的负载变化情况,
如果 1 分钟、5 分钟、15 分钟的三个值相差不大,说明系统负载很稳定。
如果 1 分钟的值远小于 15 分钟的值,就说明系统最近 1 分钟的负载在减少,而过去 15 分钟内却有很大的负载。如果 1 分钟的值远大于 15 分钟的值,就说明最近 1 分钟的负载在增加,若 1 分钟的平均负载超过了 CPU 的个数,意味着系统遇到过载的问题,需要进行分析优化了。
通常负载数 > CPU数(70%~80%)认为异常
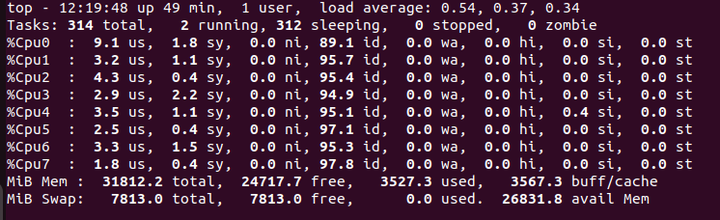
2、top指令
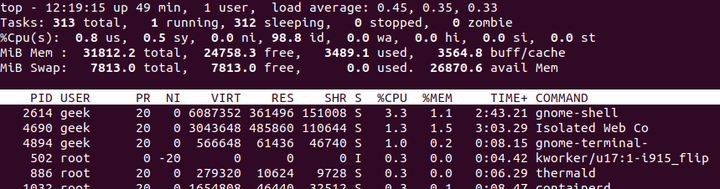
默认每3秒刷新一次, 按1 可以显示每个CPU上的详细信息
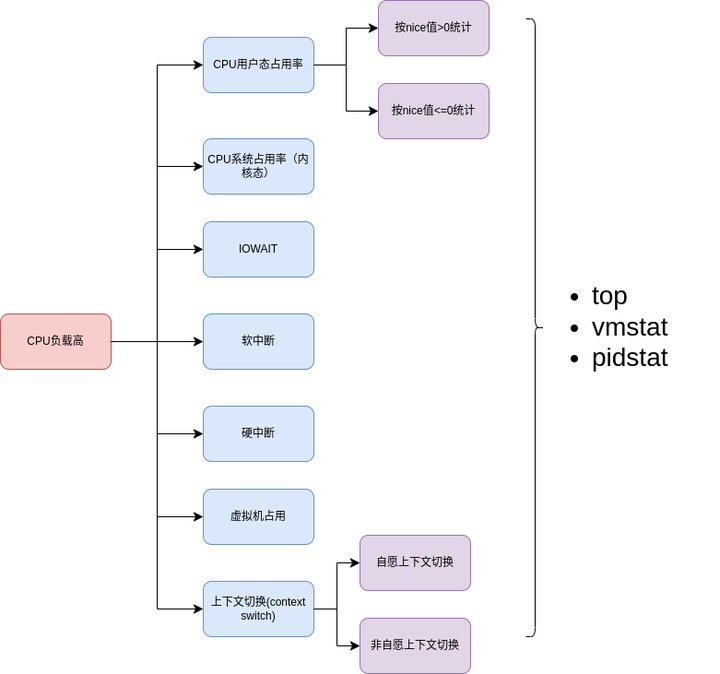
us, user : normal 进程,nice值 <= 0的cpu占用量
sy, system : process 内核态执行时间
ni, nice : normal进程, nice值> 0的cpu占用量
id, idle : idle占比,CPU空闲时间
wa, IO-wait : 等待I/O的时间
hi : 硬件中断的CPU占用时间
si : 软件中断的CPU占用时间
st : 当系统运行在虚拟机时,被其他虚拟机占用的时间
三、查看CPU负载高的原因
1、vmstat 工具

Procs
r: running/runable 的process数量 .
b: blocked process数量(uninterrupt状态)
Memory
swpd: swap 内存使用量(同/proc/meminfo)
free: 可用的free mem (同/proc/meminfo)
buff: buff 内存使用数量
cache: cache 内存使用量
Swap
si: swap 从disk换入 单位/s
so: swap从内存换出 单位 /s
IO
bi: Blocks received from a block device (blocks/s).
bo: Blocks sent to a block device (blocks/s).
System
in: interrupt 数量单位/s
cs: context switches /s
CPU
us: userspace执行消耗时间占比(user time 包括 nice time)
sy: 内核执行消耗时间占比
id: idle time (这里计算会包括iowait的时间)
wa: iowait time
st: 通过虚拟化运行其他操作系统的时间,被其他虚拟机占用的CPU时间
2、pidstat
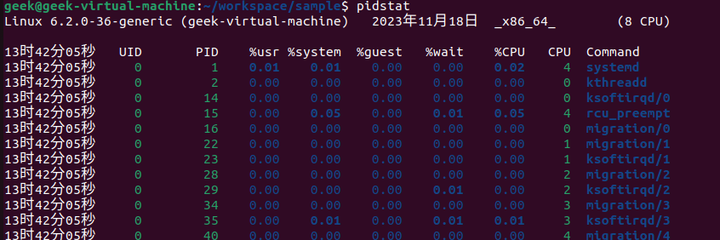
pidstat按进程分布,相比前面的vmstat和top还多了一个guest 参数,%guest代表运行虚拟机的CPU占用率;
pidstat -w 查看context switch的数量,context switch就是进程上下文切换
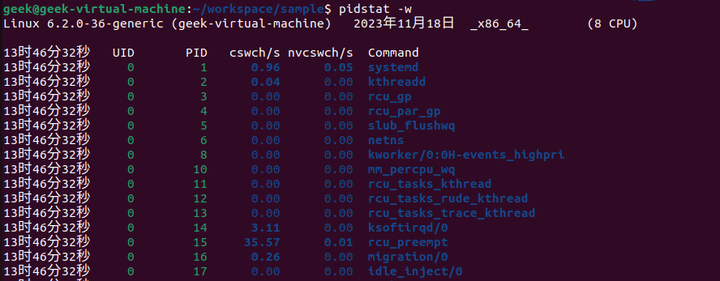
cswch/s:每秒自愿上下文切换的次数(voluntary context switch)
nvcswch/s: 每秒非自愿上下文切换的次数(non voluntary context switch)
cswch 当进程出发IO读写,malloc/mmap触发缺页异常,sleep等自愿上下文切换
nvcswch 通常是由于时间片运行完,被系统强制调度切换,当有大量CPU消耗性进程抢占CPU时,这个指标值就会很大
四、总结
CPU占用的指标大概有这些,通常我们用top,vmstat,pidstat来确认初步原因