目录
一.基本概念
Canvas是H5新增的一个标签, 我们可以通过JS在这个标签上绘制各种图案
Canvas 拥有多种绘制路径、矩形、圆形、字符以及图片的方法。
二.dmoe
2.1Canvas开篇
<!DOCTYPE html>
<html lang="en">
<head>
    <meta charset="UTF-8">
    <title>01-Canvas开篇</title>
    <style>
        *{
            margin: 0;
            padding: 0;
        }
        canvas{
            background: red;
        }
    </style>
</head>
<body>
<!--1.在body中创建一个canvas标签-->
<!--
注意点
canvas标签有默认的宽度和高度
默认的宽度是300px
默认的高度是150px
-->
<canvas></canvas>
<script>
    /*
    * */
    // 2.通过js代码拿到canvas标签
    let oCanvas = document.querySelector("canvas");
    // 3.从canvas标签中获取到绘图工具
    let oCtx = oCanvas.getContext("2d");
    // 4.通过绘图工具在canvas标签上绘制图形
    // 4.1设置路径的起点
    oCtx.moveTo(50, 50);
    // 4.2设置路径的终点
    oCtx.lineTo(200, 50);
    // 4.3告诉canvas将这些点连接起来
    oCtx.stroke();
</script>
</body>
</html>
2.2Canvas注意点
1.canvas有默认的宽度和高度
默认宽300px, 高150px
2.不能通过CSS设置画布的宽高
通过CSS设置画布宽高会在默认宽高的基础上拉伸
如果需要设置canvas宽高请通过元素行内属性width和height设置
3.线条默认宽度和颜色
通过canvas绘制的线条默认宽度是1px, 颜色是纯黑色
但是由于默认情况下canvas会将线条的中心点和像素的底部对齐,
所以会导致显示效果是2px和非纯黑色问题
<!DOCTYPE html>
<html lang="en">
<head>
    <meta charset="UTF-8">
    <title>02-Canvas注意点</title>
    <style>
        *{
            margin: 0;
            padding: 0;
        }
        canvas{
            background: red;
            /*width: 500px;*/
            /*height: 500px;*/
        }
    </style>
</head>
<body>
<!--1.创建一个画布-->
<canvas width="500" height="500"></canvas>
<script>
    /*
    1.canvas有默认的宽度和高度
    默认宽300px, 高150px
    */
    /*
    2.不能通过CSS设置画布的宽高
    通过CSS设置画布宽高会在默认宽高的基础上拉伸
    如果需要设置canvas宽高请通过元素行内属性width和height设置
    */
    /*
    3.线条默认宽度和颜色
    通过canvas绘制的线条默认宽度是1px, 颜色是纯黑色
    但是由于默认情况下canvas会将线条的中心点和像素的底部对齐,
    所以会导致显示效果是2px和非纯黑色问题
    * */

    // 2.拿到画布
    let oCanvas = document.querySelector("canvas");
    // 3.拿到绘制工具
    let oCtx = oCanvas.getContext("2d");
    // 4.利用绘制工具绘制直线
    // 4.1设置起始位置
    oCtx.moveTo(50, 50.5);
    // 4.2设置路径上的点
    oCtx.lineTo(200, 50.5);
    // 4.2绘制已定义的路径
    oCtx.stroke();
</script>
</body>
</html>
2.3Canvas线条属性
线条相关属性
lineWidth: 线条宽度
strokeStyle: 线条颜色
lineCap: 线末端类型:(butt默认)、round、square
<!DOCTYPE html>
<html lang="en">
<head>
    <meta charset="UTF-8">
    <title>03-Canvas线条属性</title>
    <style>
        *{
            margin: 0;
            padding: 0;
        }
        canvas{
            background: yellowgreen;
        }
    </style>
</head>
<body>
<canvas></canvas>
<script>
    /*
    1.线条相关属性
    lineWidth: 线条宽度
    strokeStyle: 线条颜色
    lineCap: 线末端类型:(butt默认)、round、square
    * */
    let oCanvas = document.querySelector("canvas");
    let oCtx = oCanvas.getContext("2d");
    // 修改线条的高度
    oCtx.lineWidth = 50;
    // 修改线条的颜色
    oCtx.strokeStyle = "blue";
    // 修改线条的两端样式
    oCtx.lineCap = "round";
    oCtx.moveTo(50, 50);
    oCtx.lineTo(200, 50);
    oCtx.stroke();
</script>
</body>
</html>
2.4 Canvas多根线条
1.多根线条注意点
如果是同一个路径, 那么路径样式会被重用(第二次绘制会复用第一次的样式)
如果是同一个路径, 那么后设置的路径样式会覆盖先设置的路径样式
2.如何给每根线条单独设置路径样式?
每根线条都开启一个新的路径即可
<!DOCTYPE html>
<html lang="en">
<head>
    <meta charset="UTF-8">
    <title>04-Canvas多根线条</title>
    <style>
        *{
            margin: 0;
            padding: 0;
        }
        canvas{
            background: yellowgreen;
        }
    </style>
</head>
<body>
<canvas></canvas>
<script>
    /*
    1.多根线条注意点
    如果是同一个路径, 那么路径样式会被重用(第二次绘制会复用第一次的样式)
    如果是同一个路径, 那么后设置的路径样式会覆盖先设置的路径样式

    2.如何给每根线条单独设置路径样式?
    每根线条都开启一个新的路径即可
    * */
    let oCanvas = document.querySelector("canvas");
    let oCtx = oCanvas.getContext("2d");
    oCtx.moveTo(50, 50);
    oCtx.lineTo(200, 50);
    oCtx.lineWidth = 20;
    oCtx.strokeStyle = "blue";
    oCtx.stroke();

    oCtx.beginPath(); // 重新开启一个路径
    oCtx.moveTo(50, 100);
    oCtx.lineTo(200, 100);
    oCtx.lineWidth = 10; // 重新设置当前路径样式
    oCtx.strokeStyle = "red";
    oCtx.stroke();

    oCtx.beginPath(); // 重新开启一个路径
    oCtx.moveTo(50, 150);
    oCtx.lineTo(200, 150);
    oCtx.lineWidth = 15; // 重新设置当前路径样式
    oCtx.strokeStyle = "green";
    oCtx.stroke();
</script>
</body>
</html>
2.5Canvas简单图形
1.closePath
自动创建从当前点回到起始点的路径
2.lineJoin
设置相交线的拐点样式 miter(默认)、round、bevel
<!DOCTYPE html>
<html lang="en">
<head>
    <meta charset="UTF-8">
    <title>05-Canvas简单图形</title>
    <style>
        *{
            margin: 0;
            padding: 0;
        }
        canvas{
            display: block;
            margin: 0 auto;
            background: red;
        }
    </style>
</head>
<body>
<canvas width="500" height="500"></canvas>
<script>
    /*
    1.closePath
    自动创建从当前点回到起始点的路径

    2.lineJoin
    设置相交线的拐点样式 miter(默认)、round、bevel
    * */
    let oCanvas = document.querySelector("canvas");
    let oCtx = oCanvas.getContext("2d");
    oCtx.moveTo(50, 50);
    oCtx.lineTo(200, 50);
    oCtx.lineTo(200, 200);
    // 注意点: 如果通过lineTo来闭合图形, 那么是不能很好的闭合
    // oCtx.lineTo(50, 50);
    oCtx.closePath();
    oCtx.lineWidth = 20;
    oCtx.lineJoin = "round";
    // 注意点: 默认情况下不会自动从最后一个点连接到起点
    oCtx.stroke();
</script>
</body>
</html>
2.6Canvas填充图形
1.stroke
绘制已定义的路径
2.fill
填充已定义的路径
注意点: 只要没有手动开启新的路径, 那么使用的都是默认路径
如果都是默认路径, 那么设置的样式在同一个路径中都是有效的
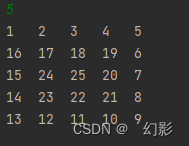
对于同一路径,在填充的时候回遵循非零环绕规则
从当前的区域拉出一条直线, 遇到顺时针相交的线就+1, 遇到逆时针相交的线就-1
最终计算的结果如何是0就不填充, 如果不是0就填充
<!DOCTYPE html>
<html lang="en">
<head>
    <meta charset="UTF-8">
    <title>06-Canvas填充图形</title>
    <style>
        *{
            margin: 0;
            padding: 0;
        }
        canvas{
            display: block;
            margin: 0 auto;
            background: red;
        }
    </style>
</head>
<body>
<canvas width="500" height="500"></canvas>
<script>
    /*
     1.stroke
    绘制已定义的路径

    2.fill
    填充已定义的路径
    */
    let oCanvas = document.querySelector("canvas");
    let oCtx = oCanvas.getContext("2d");
    /*
    oCtx.moveTo(50, 50);
    oCtx.lineTo(200, 50);
    oCtx.lineTo(200, 200);
    oCtx.closePath();
    // oCtx.stroke();
    oCtx.fillStyle = "blue";
    oCtx.fill();
    */
    oCtx.moveTo(100, 100);
    oCtx.lineTo(300, 100);
    oCtx.lineTo(300, 300);
    oCtx.lineTo(100, 300);
    oCtx.closePath();
    // oCtx.stroke();

    // oCtx.beginPath();
    /*
   oCtx.moveTo(150, 150);
   oCtx.lineTo(250, 150);
   oCtx.lineTo(250, 250);
   oCtx.lineTo(150, 250);
  */
   oCtx.moveTo(250, 150);
   oCtx.lineTo(150, 150);
   oCtx.lineTo(150, 250);
   oCtx.lineTo(250, 250);

    oCtx.closePath();
    /*
    注意点: 只要没有手动开启新的路径, 那么使用的都是默认路径
    如果都是默认路径, 那么设置的样式在同一个路径中都是有效的
    * */
    // oCtx.strokeStyle = "blue";
    // oCtx.stroke();
    oCtx.fill();
    /*
    对于同一路径,在填充的时候回遵循非零环绕规则
    从当前的区域拉出一条直线, 遇到顺时针相交的线就+1, 遇到逆时针相交的线就-1
    最终计算的结果如何是0就不填充, 如果不是0就填充
    * */
</script>
</body>
</html>
2.7Canvas虚线
1.setLineDash
[5,10] 数组是用来描述你的排列方式的
2.getLineDash
获取虚线的排列方式 获取的是不重复的那一段的排列方式
3.lineDashOffset
设置虚线的偏移位
<!DOCTYPE html>
<html lang="en">
<head>
    <meta charset="UTF-8">
    <title>07-Canvas虚线</title>
    <style>
        *{
            margin: 0px;
            padding: 0;
        }
        canvas{
            display: block;
            margin: 0 auto;
            background: red;
        }
    </style>
</head>
<body>
<canvas width="500" height="500"></canvas>
<script>
    let oCanvas = document.querySelector("canvas");
    let oCtx = oCanvas.getContext("2d");
    oCtx.moveTo(100, 100);
    oCtx.lineTo(400, 100);
    oCtx.lineWidth = 20;
    oCtx.strokeStyle = "blue";
    // oCtx.setLineDash([5, 20]);
    oCtx.setLineDash([5, 10, 20]);
    console.log(oCtx.getLineDash());
    oCtx.lineDashOffset = -50;
    oCtx.stroke();
    /*
    1.setLineDash
    [5,10] 数组是用来描述你的排列方式的

    2.getLineDash
    获取虚线的排列方式 获取的是不重复的那一段的排列方式

    3.lineDashOffset
    设置虚线的偏移位
    * */

</script>
</body>
</html>
2.8Canvas绘制表格
<!DOCTYPE html>
<html lang="en">
<head>
    <meta charset="UTF-8">
    <title>08-Canvas绘制表格</title>
    <style>
        *{
            margin: 0;
            padding: 0;
        }
        canvas{
            display: block;
            margin: 0 auto;
            background: red;
        }
    </style>
</head>
<body>
<canvas width="500" height="400"></canvas>
<script>
    // 1.拿到canvas
    let oCanvas = document.querySelector("canvas");
    // 2.从canvas中拿到绘图工具
    let oCtx = oCanvas.getContext("2d");
    // 3.定义变量保存小方格的尺寸
    let gridSize = 50;
    // console.log(oCanvas.offsetWidth);
    // console.log(oCanvas.offsetHeight);
    // console.log(oCtx.canvas.width);
    // console.log(oCtx.canvas.height);
    // 4.拿到canvas的宽高
    let canvasWidth = oCtx.canvas.width;
    let canvasHeight = oCtx.canvas.height;
    // 5.计算在垂直方向和水平方向可以绘制多少条横线
    let row = Math.floor(canvasHeight / gridSize);
    let col = Math.floor(canvasWidth / gridSize);
    // 6.绘制垂直方向的横线
    for(let i = 0; i < row; i++){
        oCtx.beginPath();
        oCtx.moveTo(0, i * gridSize - 0.5);
        oCtx.lineTo(canvasWidth, i * gridSize - 0.5);
        oCtx.strokeStyle = "#ccc";
        oCtx.stroke();
    }
    // 7.绘制水平方向的横线
    for(let i = 0; i < col; i++){
        oCtx.beginPath();
        oCtx.moveTo(i * gridSize - 0.5, 0);
        oCtx.lineTo(i * gridSize - 0.5, canvasHeight);
        oCtx.strokeStyle = "#ccc";
        oCtx.stroke();
    }
</script>
</body>
</html>
2.9Canvas绘制坐标系
<!DOCTYPE html>
<html lang="en">
<head>
    <meta charset="UTF-8">
    <title>09-Canvas绘制坐标系</title>
    <style>
        *{
            margin: 0;
            padding: 0;
        }
        canvas{
            display: block;
            margin: 0 auto;
            background: red;
        }
    </style>
</head>
<body>
<canvas width="500" height="400"></canvas>
<script>
    // 1.拿到canvas
    let oCanvas = document.querySelector("canvas");
    // 2.从canvas中拿到绘图工具
    let oCtx = oCanvas.getContext("2d");
    // 3.定义变量保存小方格的尺寸
    let gridSize = 50;
    // 4.拿到canvas的宽高
    let canvasWidth = oCtx.canvas.width;
    let canvasHeight = oCtx.canvas.height;
    // 5.计算在垂直方向和水平方向可以绘制多少条横线
    let row = Math.floor(canvasHeight / gridSize);
    let col = Math.floor(canvasWidth / gridSize);
    // 6.绘制垂直方向的横线
    for(let i = 0; i < row; i++){
        oCtx.beginPath();
        oCtx.moveTo(0, i * gridSize - 0.5);
        oCtx.lineTo(canvasWidth, i * gridSize - 0.5);
        oCtx.strokeStyle = "#ccc";
        oCtx.stroke();
    }
    // 7.绘制水平方向的横线
    for(let i = 0; i < col; i++){
        oCtx.beginPath();
        oCtx.moveTo(i * gridSize - 0.5, 0);
        oCtx.lineTo(i * gridSize - 0.5, canvasHeight);
        oCtx.strokeStyle = "#ccc";
        oCtx.stroke();
    }

    // 1.计算坐标系原点的位置
    let originX = gridSize;
    let originY = canvasHeight - gridSize;
    // 2.计算X轴终点的位置
    let endX = canvasWidth - gridSize;
    // 3.绘制X轴
    oCtx.beginPath();
    oCtx.moveTo(originX, originY);
    oCtx.lineTo(endX, originY);
    oCtx.strokeStyle = "#000";
    oCtx.stroke();
    // 4.绘制X轴的箭头
    oCtx.lineTo(endX - 10, originY + 5);
    oCtx.lineTo(endX - 10, originY - 5);
    oCtx.lineTo(endX, originY);
    oCtx.fill();

    // 5.计算Y轴终点的位置
    let endY = gridSize;
    // 3.绘制Y轴
    oCtx.beginPath();
    oCtx.moveTo(originX, originY);
    oCtx.lineTo(originX, endY);
    oCtx.strokeStyle = "#000";
    oCtx.stroke();
    // 4.绘制X轴的箭头
    oCtx.lineTo(originX - 5, endY + 10);
    oCtx.lineTo(originX + 5, endY + 10);
    oCtx.lineTo(originX, endY);
    oCtx.fill();
</script>
</body>
</html>
2.10Canvas绘制数据点
<!DOCTYPE html>
<html lang="en">
<head>
    <meta charset="UTF-8">
    <title>10-Canvas绘制数据点</title>
    <style>
        *{
            margin: 0;
            padding: 0;
        }
        canvas{
            display: block;
            margin: 0 auto;
            background: red;
        }
    </style>
</head>
<body>
<canvas width="500" height="400"></canvas>
<script>
    // 1.拿到canvas
    let oCanvas = document.querySelector("canvas");
    // 2.从canvas中拿到绘图工具
    let oCtx = oCanvas.getContext("2d");
    // 3.定义变量保存小方格的尺寸
    let gridSize = 50;
    // 4.拿到canvas的宽高
    let canvasWidth = oCtx.canvas.width;
    let canvasHeight = oCtx.canvas.height;
    // 5.计算在垂直方向和水平方向可以绘制多少条横线
    let row = Math.floor(canvasHeight / gridSize);
    let col = Math.floor(canvasWidth / gridSize);
    // 6.绘制垂直方向的横线
    for(let i = 0; i < row; i++){
        oCtx.beginPath();
        oCtx.moveTo(0, i * gridSize - 0.5);
        oCtx.lineTo(canvasWidth, i * gridSize - 0.5);
        oCtx.strokeStyle = "#ccc";
        oCtx.stroke();
    }
    // 7.绘制水平方向的横线
    for(let i = 0; i < col; i++){
        oCtx.beginPath();
        oCtx.moveTo(i * gridSize - 0.5, 0);
        oCtx.lineTo(i * gridSize - 0.5, canvasHeight);
        oCtx.strokeStyle = "#ccc";
        oCtx.stroke();
    }

    // 1.计算坐标系原点的位置
    let originX = gridSize;
    let originY = canvasHeight - gridSize;
    // 2.计算X轴终点的位置
    let endX = canvasWidth - gridSize;
    // 3.绘制X轴
    oCtx.beginPath();
    oCtx.moveTo(originX, originY);
    oCtx.lineTo(endX, originY);
    oCtx.strokeStyle = "#000";
    oCtx.stroke();
    // 4.绘制X轴的箭头
    oCtx.lineTo(endX - 10, originY + 5);
    oCtx.lineTo(endX - 10, originY - 5);
    oCtx.lineTo(endX, originY);
    oCtx.fill();

    // 5.计算Y轴终点的位置
    let endY = gridSize;
    // 3.绘制Y轴
    oCtx.beginPath();
    oCtx.moveTo(originX, originY);
    oCtx.lineTo(originX, endY);
    oCtx.strokeStyle = "#000";
    oCtx.stroke();
    // 4.绘制X轴的箭头
    oCtx.lineTo(originX - 5, endY + 10);
    oCtx.lineTo(originX + 5, endY + 10);
    oCtx.lineTo(originX, endY);
    oCtx.fill();

    // 1.拿到服务器返回数据
    let list = [
        {
            x: 100,
            y: 300
        },
        {
            x: 200,
            y: 200
        },
        {
            x: 300,
            y: 250
        },
        {
            x: 400,
            y: 100
        },
    ];
    let dotLocation = {
        x: 100,
        y: 300
    }
    let dotSize = 20;
    /*
    // 2.绘制数据点
    oCtx.beginPath();
    oCtx.moveTo(dotLocation.x - dotSize / 2, dotLocation.y - dotSize / 2);
    oCtx.lineTo(dotLocation.x + dotSize - dotSize / 2, dotLocation.y - dotSize / 2);
    oCtx.lineTo(dotLocation.x + dotSize - dotSize / 2, dotLocation.y + dotSize - dotSize / 2);
    oCtx.lineTo(dotLocation.x - dotSize / 2, dotLocation.y + dotSize - dotSize / 2);
    oCtx.closePath();
    oCtx.fill();
    */
    for(let i = 0; i < list.length; i++){
        oCtx.beginPath();
        oCtx.moveTo(list[i].x - dotSize / 2, list[i].y - dotSize / 2);
        oCtx.lineTo(list[i].x + dotSize - dotSize / 2, list[i].y - dotSize / 2);
        oCtx.lineTo(list[i].x + dotSize - dotSize / 2, list[i].y + dotSize - dotSize / 2);
        oCtx.lineTo(list[i].x - dotSize / 2, list[i].y + dotSize - dotSize / 2);
        oCtx.closePath();
        oCtx.fill();
    }
</script>
</body>
</html>
2.11Canvas绘制折线图
<!DOCTYPE html>
<html lang="en">
<head>
    <meta charset="UTF-8">
    <title>11-Canvas绘制折线图</title>
    <style>
        *{
            margin: 0;
            padding: 0;
        }
        canvas{
            display: block;
            margin: 0 auto;
            background: red;
        }
    </style>
</head>
<body>
<canvas width="500" height="400"></canvas>
<script>
    // 1.拿到canvas
    let oCanvas = document.querySelector("canvas");
    // 2.从canvas中拿到绘图工具
    let oCtx = oCanvas.getContext("2d");
    // 3.定义变量保存小方格的尺寸
    let gridSize = 50;
    // 4.拿到canvas的宽高
    let canvasWidth = oCtx.canvas.width;
    let canvasHeight = oCtx.canvas.height;
    // 5.计算在垂直方向和水平方向可以绘制多少条横线
    let row = Math.floor(canvasHeight / gridSize);
    let col = Math.floor(canvasWidth / gridSize);
    // 6.绘制垂直方向的横线
    for(let i = 0; i < row; i++){
        oCtx.beginPath();
        oCtx.moveTo(0, i * gridSize - 0.5);
        oCtx.lineTo(canvasWidth, i * gridSize - 0.5);
        oCtx.strokeStyle = "#ccc";
        oCtx.stroke();
    }
    // 7.绘制水平方向的横线
    for(let i = 0; i < col; i++){
        oCtx.beginPath();
        oCtx.moveTo(i * gridSize - 0.5, 0);
        oCtx.lineTo(i * gridSize - 0.5, canvasHeight);
        oCtx.strokeStyle = "#ccc";
        oCtx.stroke();
    }

    // 1.计算坐标系原点的位置
    let originX = gridSize;
    let originY = canvasHeight - gridSize;
    // 2.计算X轴终点的位置
    let endX = canvasWidth - gridSize;
    // 3.绘制X轴
    oCtx.beginPath();
    oCtx.moveTo(originX, originY);
    oCtx.lineTo(endX, originY);
    oCtx.strokeStyle = "#000";
    oCtx.stroke();
    // 4.绘制X轴的箭头
    oCtx.lineTo(endX - 10, originY + 5);
    oCtx.lineTo(endX - 10, originY - 5);
    oCtx.lineTo(endX, originY);
    oCtx.fill();

    // 5.计算Y轴终点的位置
    let endY = gridSize;
    // 3.绘制Y轴
    oCtx.beginPath();
    oCtx.moveTo(originX, originY);
    oCtx.lineTo(originX, endY);
    oCtx.strokeStyle = "#000";
    oCtx.stroke();
    // 4.绘制X轴的箭头
    oCtx.lineTo(originX - 5, endY + 10);
    oCtx.lineTo(originX + 5, endY + 10);
    oCtx.lineTo(originX, endY);
    oCtx.fill();

    // 1.拿到服务器返回数据
    let list = [
        {
            x: 100,
            y: 300
        },
        {
            x: 200,
            y: 200
        },
        {
            x: 300,
            y: 250
        },
        {
            x: 400,
            y: 100
        },
    ];
    let dotSize = 20;
    // 2.绘制数据点
    for(let i = 0; i < list.length; i++){
        oCtx.beginPath();
        oCtx.moveTo(list[i].x - dotSize / 2, list[i].y - dotSize / 2);
        oCtx.lineTo(list[i].x + dotSize - dotSize / 2, list[i].y - dotSize / 2);
        oCtx.lineTo(list[i].x + dotSize - dotSize / 2, list[i].y + dotSize - dotSize / 2);
        oCtx.lineTo(list[i].x - dotSize / 2, list[i].y + dotSize - dotSize / 2);
        oCtx.closePath();
        oCtx.fill();
    }

    // 1.绘制折线
    oCtx.beginPath();
    for(let i = 0; i < list.length; i++){
        if(i === 0){
            oCtx.moveTo(list[i].x, list[i].y);
        }else{
            oCtx.lineTo(list[i].x, list[i].y);
        }
    }
    oCtx.stroke();
</script>
</body>
</html>
2.12Canvas折线图封装
<!DOCTYPE html>
<html lang="en">
<head>
    <meta charset="UTF-8">
    <title>12-Canvas折线图封装</title>
    <!---->
    <style>
        *{
            margin: 0;
            padding: 0;
        }
        canvas{
            display: block;
            margin: 0 auto;
            background: red;
        }
    </style>
</head>
<body>
<script>
    /*
    面向过程: 亲力亲为
    面向对象: 找对象, 让对象做事情
    找一个折线图对象, 你给我画格子, 你给我画坐标系, 你给我画数据点, 你给我画折线
    * */
    class LineChart{
        constructor(width=300, height=150){
            // 1.创建canvas
            this.canvas = document.createElement("canvas");
            this.canvas.width = width;
            this.canvas.height = height;
            document.body.appendChild(this.canvas);
            // 2.拿到绘图工具
            this.ctx = this.canvas.getContext("2d");
        }
        drawGrid(gridSize=20){
            let oCtx = this.ctx;
            // 4.拿到canvas的宽高
            let canvasWidth = oCtx.canvas.width;
            let canvasHeight = oCtx.canvas.height;
            // 5.计算在垂直方向和水平方向可以绘制多少条横线
            let row = Math.floor(canvasHeight / gridSize);
            let col = Math.floor(canvasWidth / gridSize);
            // 6.绘制垂直方向的横线
            for(let i = 0; i < row; i++){
                oCtx.beginPath();
                oCtx.moveTo(0, i * gridSize - 0.5);
                oCtx.lineTo(canvasWidth, i * gridSize - 0.5);
                oCtx.strokeStyle = "#ccc";
                oCtx.stroke();
            }
            // 7.绘制水平方向的横线
            for(let i = 0; i < col; i++){
                oCtx.beginPath();
                oCtx.moveTo(i * gridSize - 0.5, 0);
                oCtx.lineTo(i * gridSize - 0.5, canvasHeight);
                oCtx.strokeStyle = "#ccc";
                oCtx.stroke();
            }
        }
        drawCoor(gridSize=20){
            let oCtx = this.ctx;
            let canvasWidth = this.ctx.canvas.width;
            let canvasHeight = this.ctx.canvas.height;

            // 1.计算坐标系原点的位置
            let originX = gridSize;
            let originY = canvasHeight - gridSize;
            // 2.计算X轴终点的位置
            let endX = canvasWidth - gridSize;
            // 3.绘制X轴
            oCtx.beginPath();
            oCtx.moveTo(originX, originY);
            oCtx.lineTo(endX, originY);
            oCtx.strokeStyle = "#000";
            oCtx.stroke();
            // 4.绘制X轴的箭头
            oCtx.lineTo(endX - 10, originY + 5);
            oCtx.lineTo(endX - 10, originY - 5);
            oCtx.lineTo(endX, originY);
            oCtx.fill();

            // 5.计算Y轴终点的位置
            let endY = gridSize;
            // 3.绘制Y轴
            oCtx.beginPath();
            oCtx.moveTo(originX, originY);
            oCtx.lineTo(originX, endY);
            oCtx.strokeStyle = "#000";
            oCtx.stroke();
            // 4.绘制X轴的箭头
            oCtx.lineTo(originX - 5, endY + 10);
            oCtx.lineTo(originX + 5, endY + 10);
            oCtx.lineTo(originX, endY);
            oCtx.fill();
        }
        drawDot(list, dotSize=10){
            let oCtx = this.ctx;
            // 2.绘制数据点
            for(let i = 0; i < list.length; i++){
                oCtx.beginPath();
                oCtx.moveTo(list[i].x - dotSize / 2, list[i].y - dotSize / 2);
                oCtx.lineTo(list[i].x + dotSize - dotSize / 2, list[i].y - dotSize / 2);
                oCtx.lineTo(list[i].x + dotSize - dotSize / 2, list[i].y + dotSize - dotSize / 2);
                oCtx.lineTo(list[i].x - dotSize / 2, list[i].y + dotSize - dotSize / 2);
                oCtx.closePath();
                oCtx.fill();
            }
        }
        drawLine(list){
            let oCtx = this.ctx;
            oCtx.beginPath();
            for(let i = 0; i < list.length; i++){
                if(i === 0){
                    oCtx.moveTo(list[i].x, list[i].y);
                }else{
                    oCtx.lineTo(list[i].x, list[i].y);
                }
            }
            oCtx.stroke();
        }
    }

    let list = [
        {
            x: 100,
            y: 300
        },
        {
            x: 200,
            y: 200
        },
        {
            x: 300,
            y: 250
        },
        {
            x: 400,
            y: 100
        },
    ];
    let lineChart = new LineChart(500, 400);
    lineChart.drawGrid(50);
    lineChart.drawCoor(50);
    lineChart.drawDot(list);
    lineChart.drawLine(list);
</script>
</body>
</html>
2.13-Canvas绘制矩形
<!DOCTYPE html>
<html lang="en">
<head>
    <meta charset="UTF-8">
    <title>13-Canvas绘制矩形</title>
    <style>
        *{
            margin: 0;
            padding: 0;
        }
        canvas{
            display: block;
            margin: 0 auto;
            background: red;
        }
    </style>
</head>
<body>
<canvas width="500" height="400"></canvas>
<script>
    // 1.拿到canvas
    let oCanvas = document.querySelector("canvas");
    // 2.从canvas中拿到绘图工具
    let oCtx = oCanvas.getContext("2d");
    /*
    oCtx.moveTo(100, 100);
    oCtx.lineTo(300, 100);
    oCtx.lineTo(300, 300);
    oCtx.lineTo(100, 300);
    oCtx.closePath();
    // oCtx.stroke();
    oCtx.fill();
    */
    /*
    oCtx.moveTo(100, 100);
    oCtx.lineTo(300, 100);
    oCtx.lineWidth = 200;
    oCtx.stroke();
    */
    /*
    第一个参数: x的坐标
    第二个参数: y的坐标
    第三个参数: 矩形的宽度
    第四个参数: 矩形的高度
    * */
    /*
    oCtx.rect(100, 100, 200, 200);
    oCtx.stroke();
    // oCtx.fill();

    oCtx.beginPath();
    oCtx.rect(150, 150, 100, 100);
    oCtx.strokeStyle = "blue";
    oCtx.stroke();
    */
    /*
    oCtx.strokeRect(100, 100, 200, 200);

    oCtx.strokeStyle = "blue";
    oCtx.strokeRect(150, 150, 100, 100);
    */

    oCtx.fillRect(100, 100, 200, 200);

    oCtx.fillStyle = "blue";
    oCtx.fillRect(150, 150, 100, 100);

    // oCtx.clearRect(0, 0, 150, 150);
    let canvasWidth = oCtx.canvas.width;
    let canvasHeight = oCtx.canvas.height;
    oCtx.clearRect(0, 0, canvasWidth, canvasHeight);
</script>
</body>
</html>
2.14-Canvas绘制柱状图
<!DOCTYPE html>
<html lang="en">
<head>
    <meta charset="UTF-8">
    <title>14-Canvas绘制柱状图</title>
    <style>
        *{
            margin: 0;
            padding: 0;
        }
        canvas{
            display: block;
            margin: 0 auto;
            background: red;
        }
    </style>
</head>
<body>
<canvas width="500" height="400"></canvas>
<script>
    // 1.拿到canvas
    let oCanvas = document.querySelector("canvas");
    // 2.从canvas中拿到绘图工具
    let oCtx = oCanvas.getContext("2d");
    // 3.定义变量保存小方格的尺寸
    let gridSize = 50;
    // 4.拿到canvas的宽高
    let canvasWidth = oCtx.canvas.width;
    let canvasHeight = oCtx.canvas.height;
    // 5.计算在垂直方向和水平方向可以绘制多少条横线
    let row = Math.floor(canvasHeight / gridSize);
    let col = Math.floor(canvasWidth / gridSize);
    // 6.绘制垂直方向的横线
    for(let i = 0; i < row; i++){
        oCtx.beginPath();
        oCtx.moveTo(0, i * gridSize - 0.5);
        oCtx.lineTo(canvasWidth, i * gridSize - 0.5);
        oCtx.strokeStyle = "#ccc";
        oCtx.stroke();
    }
    // 7.绘制水平方向的横线
    for(let i = 0; i < col; i++){
        oCtx.beginPath();
        oCtx.moveTo(i * gridSize - 0.5, 0);
        oCtx.lineTo(i * gridSize - 0.5, canvasHeight);
        oCtx.strokeStyle = "#ccc";
        oCtx.stroke();
    }

    // 1.计算坐标系原点的位置
    let originX = gridSize;
    let originY = canvasHeight - gridSize;
    // 2.计算X轴终点的位置
    let endX = canvasWidth - gridSize;
    // 3.绘制X轴
    oCtx.beginPath();
    oCtx.moveTo(originX, originY);
    oCtx.lineTo(endX, originY);
    oCtx.strokeStyle = "#000";
    oCtx.stroke();
    // 4.绘制X轴的箭头
    oCtx.lineTo(endX - 10, originY + 5);
    oCtx.lineTo(endX - 10, originY - 5);
    oCtx.lineTo(endX, originY);
    oCtx.fill();

    // 5.计算Y轴终点的位置
    let endY = gridSize;
    // 3.绘制Y轴
    oCtx.beginPath();
    oCtx.moveTo(originX, originY);
    oCtx.lineTo(originX, endY);
    oCtx.strokeStyle = "#000";
    oCtx.stroke();
    // 4.绘制X轴的箭头
    oCtx.lineTo(originX - 5, endY + 10);
    oCtx.lineTo(originX + 5, endY + 10);
    oCtx.lineTo(originX, endY);
    oCtx.fill();

    // 1.拿到服务器返回数据
    let list = [
        {
            x: 100,
            y: 300
        },
        {
            x: 200,
            y: 200
        },
        {
            x: 300,
            y: 250
        },
    ];
    let data = {
        x: 100,
        y: 300
    }
    // 2.绘制矩形
    for(let i = 0; i < list.length; i++){
        let barHeight = originY - list[i].y;
        oCtx.fillRect(list[i].x, list[i].y, gridSize, barHeight);
    }

</script>
</body>
</html>
2.15Canvas渐变色
1.渐变背景颜色
和普通的标签一样我们也可以给填充的图形设置线性渐变和径向渐变的背景颜色
2.设置图形渐变背景颜色步骤
2.1通过绘图工具创建渐变背景颜色
2.2指定渐变的范围
2.3将渐变背景颜色设置给对应的图形
<!DOCTYPE html>
<html lang="en">
<head>
    <meta charset="UTF-8">
    <title>15-Canvas渐变色</title>
    <style>
        *{
            margin: 0;
            padding: 0;
        }
        canvas{
            display: block;
            margin: 0 auto;
            background: red;
        }
    </style>
</head>
<body>
<canvas width="500" height="400"></canvas>
<script>
    /*
    1.渐变背景颜色
    和普通的标签一样我们也可以给填充的图形设置线性渐变和径向渐变的背景颜色

    2.设置图形渐变背景颜色步骤
    2.1通过绘图工具创建渐变背景颜色
    2.2指定渐变的范围
    2.3将渐变背景颜色设置给对应的图形
    * */
    // 1.拿到canvas
    let oCanvas = document.querySelector("canvas");
    // 2.从canvas中拿到绘图工具
    let oCtx = oCanvas.getContext("2d");

    // 1.创建一个渐变的方案
    /*
    可以通过x0,y0 / x1,y1确定渐变的方向和渐变的范围
    * */
    let linearGradient = oCtx.createLinearGradient(100, 100, 300, 300);
    /*
    第一个参数是一个百分比 0~1
    第二个参数是一个颜色
    * */
    linearGradient.addColorStop(0, "green");
    linearGradient.addColorStop(0.5, "yellow");
    linearGradient.addColorStop(1, "blue");

    // oCtx.createRadialGradient();
    // oCtx.fillStyle = "blue";
    oCtx.fillStyle = linearGradient;
    oCtx.fillRect(100, 100, 200, 200);
</script>
</body>
</html>
2.16Canvas绘制圆弧
x, y: 确定圆心
radius: 确定半径
startAngle: 确定开始的弧度
endAngle: 确定结束的弧度
Boolean: 默认是false, false就是顺时针绘制, true就是逆时针绘制
context.arc(x, y, radius, startAngle, endAngle, Boolean);
<!DOCTYPE html>
<html lang="en">
<head>
    <meta charset="UTF-8">
    <title>16-Canvas绘制圆弧</title>
    <style>
        *{
            margin: 0;
            padding: 0;
        }
        canvas{
            display: block;
            margin: 0 auto;
            background: red;
        }
    </style>
</head>
<body>
<canvas width="500" height="400"></canvas>
<script>
    /*
    1.基本概念(请翻开初中数学课本)
    角度: 一个圆360度, 一个半圆是180度
    弧度: 一个圆2π, 一个半圆π

    2.角度转换弧度公式:
    ∵ 180角度 = π弧度
    ∴ 1角度 = π/180;
    ∴ 弧度 = 角度 * π/180;
       90角度 * π/180 = π/2

    3.弧度转换角度公式:
    ∵ π弧度 = 180角度
    ∴ 1弧度 = 180/π
    ∴ 角度 = 弧度 * 180/π
       π/2 * 180/π = 180/2 = 90度
    * */
    // 1.拿到canvas
    let oCanvas = document.querySelector("canvas");
    // 2.从canvas中拿到绘图工具
    let oCtx = oCanvas.getContext("2d");
    /*
    x, y: 确定圆心
    radius: 确定半径
    startAngle: 确定开始的弧度
    endAngle: 确定结束的弧度
    Boolean: 默认是false, false就是顺时针绘制, true就是逆时针绘制
    context.arc(x, y, radius, startAngle, endAngle, Boolean);
    * */
    // oCtx.arc(100, 100, 100, 0, Math.PI);
    // oCtx.arc(100, 100, 100, 0, Math.PI, true);
    oCtx.arc(100, 100, 100, 0, Math.PI * 2);
    oCtx.stroke();
</script>
</body>
</html>
2.17Canvas绘制扇形
<!DOCTYPE html>
<html lang="en">
<head>
    <meta charset="UTF-8">
    <title>17-Canvas绘制扇形</title>
    <style>
        *{
            margin: 0;
            padding: 0;
        }
        canvas{
            display: block;
            margin: 0 auto;
            background: red;
        }
    </style>
</head>
<body>
<canvas width="500" height="400"></canvas>
<script>
    // 1.拿到canvas
    let oCanvas = document.querySelector("canvas");
    // 2.从canvas中拿到绘图工具
    let oCtx = oCanvas.getContext("2d");
    oCtx.moveTo(100, 100);
    oCtx.arc(100, 100, 100, 0, Math.PI/2);
    oCtx.closePath();
    // oCtx.stroke();
    oCtx.fill();
</script>
</body>
</html>
2.18Canvas绘制饼状图
<!DOCTYPE html>
<html lang="en">
<head>
    <meta charset="UTF-8">
    <title>18-Canvas绘制饼状图</title>
    <style>
        *{
            margin: 0;
            padding: 0;
        }
        canvas{
            display: block;
            margin: 0 auto;
            background: red;
        }
    </style>
</head>
<body>
<canvas width="500" height="400"></canvas>
<script>
    // 1.拿到canvas
    let oCanvas = document.querySelector("canvas");
    // 2.从canvas中拿到绘图工具
    let oCtx = oCanvas.getContext("2d");

    // 1.计算圆心的位置
    let rx = oCtx.canvas.width/2;
    let ry = oCtx.canvas.height/2;

    /*
    // 2.绘制第一个扇形
    oCtx.moveTo(rx, ry);
    oCtx.arc(rx, ry, 100, 0, Math.PI/2);
    oCtx.fillStyle = randomColor();
    oCtx.fill();

    // 3.绘制第二个扇形
    oCtx.beginPath();
    oCtx.moveTo(rx, ry);
    oCtx.arc(rx, ry, 100, Math.PI/2, Math.PI);
    oCtx.fillStyle = randomColor();
    oCtx.fill();

    // 4.绘制第三个扇形
    oCtx.beginPath();
    oCtx.moveTo(rx, ry);
    oCtx.arc(rx, ry, 100, Math.PI, Math.PI + Math.PI/2);
    oCtx.fillStyle = randomColor();
    oCtx.fill();

    // 5.绘制第四个扇形
    oCtx.beginPath();
    oCtx.moveTo(rx, ry);
    oCtx.arc(rx, ry, 100, Math.PI + Math.PI/2, Math.PI * 2);
    oCtx.fillStyle = randomColor();
    oCtx.fill();
    */
    let startAngle = 0;
    for(let i = 1; i <= 4; i++){
        let endAngle = i * Math.PI/2;
        oCtx.beginPath();
        oCtx.moveTo(rx, ry);
        oCtx.arc(rx, ry, 100, startAngle, endAngle);
        oCtx.fillStyle = randomColor();
        oCtx.fill();
        startAngle = endAngle;
    }
    function randomColor() {
        let r = Math.floor(Math.random() * 256);
        let g = Math.floor(Math.random() * 256);
        let b = Math.floor(Math.random() * 256);
        return `rgb(${r},${g},${b})`;
    }
</script>
</body>
</html>
2.19Canvas绘制文字
<!DOCTYPE html>
<html lang="en">
<head>
    <meta charset="UTF-8">
    <title>19-Canvas绘制文字</title>
    <style>
        *{
            margin: 0;
            padding: 0;
        }
        canvas{
            display: block;
            margin: 0 auto;
            background: red;
        }
    </style>
</head>
<body>
<canvas width="500" height="400"></canvas>
<script>
    // 1.拿到canvas
    let oCanvas = document.querySelector("canvas");
    // 2.从canvas中拿到绘图工具
    let oCtx = oCanvas.getContext("2d");
    // 3.绘制参考线
    let canvasWidth = oCtx.canvas.width;
    let canvasHeight = oCtx.canvas.height;
    oCtx.moveTo(0, canvasHeight/2);
    oCtx.lineTo(canvasWidth, canvasHeight/2);
    oCtx.stroke();
    oCtx.moveTo(canvasWidth/2, 0);
    oCtx.lineTo(canvasWidth/2, canvasHeight);
    oCtx.stroke();
    // 4.绘制文字
    let str = "知播渔教育";
    // 通过font属性可以设置文字的大小和样式
    oCtx.font = "50px 微软雅黑";
    // 通过textBaseline属性可以设置文字垂直方向的对齐方式
    // 注意点: 在对齐的时候是以绘制文字的y作为参考点进行对齐的
    oCtx.textBaseline = "middle";
    // 通过textAlign属性可以设置文字水平方向的对齐方式
    // 注意点: 在对齐的时候是以绘制文字的x作为参考点进行对齐的
    oCtx.textAlign = "center";
    /*
    注意点:
    在绘制文字的时候, 是以文字的左下角作为参考点进行绘制
    * */
    // oCtx.strokeText(str, canvasWidth/2, canvasHeight/2);
    oCtx.fillText(str, canvasWidth/2, canvasHeight/2);

    // oCtx.fillRect(canvasWidth/2, canvasHeight/2, 100, 100);
</script>
</body>
</html>
2.20-Canvas绘制图片
<!DOCTYPE html>
<html lang="en">
<head>
    <meta charset="UTF-8">
    <title>20-Canvas绘制图片</title>
    <style>
        *{
            margin: 0;
            padding: 0;
        }
        canvas{
            display: block;
            margin: 0 auto;
            background: red;
        }
    </style>
</head>
<body>
<canvas width="500" height="400"></canvas>
<script>
    // 1.拿到canvas
    let oCanvas = document.querySelector("canvas");
    // 2.从canvas中拿到绘图工具
    let oCtx = oCanvas.getContext("2d");
    // 3.加载图片
    let oImg = new Image();
    oImg.onload = function () {
        // 如果只有三个参数, 那么第一个参数就是需要绘制的图片
        // 后面的两个参数是指定图片从什么位置开始绘制
        // oCtx.drawImage(oImg, 100, 100);

        // 如果只有五个参数, 那么第一个参数就是需要绘制的图片
        // 后面的两个参数是指定图片从什么位置开始绘制
        // 最后的两个参数是指定图片需要拉伸到多大
        // oCtx.drawImage(oImg, 100, 100, 100, 100);

        // 如果有九个参数, 那么第一个参数就是需要绘制的图片
        // 最后的两个参数是指定图片需要拉伸到多大
        // 第6~7个参数指定图片从什么位置开始绘制
        // 第2~3个参数指定图片上定位的位置
        // 第4~5个参数指定从定位的位置开始截取多大的图片
        oCtx.drawImage(oImg, 50, 50, 100, 100, 100, 100, 100, 100);
    }
    oImg.src = "images/lnj.jpg";
</script>
</body>
</html>
2.21Canvas帧动画
<!DOCTYPE html>
<html lang="en">
<head>
    <meta charset="UTF-8">
    <title>23-Canvas帧动画</title>
    <style>
        *{
            margin: 0;
            padding: 0;
        }
        canvas{
            display: block;
            margin: 0 auto;
            background: red;
        }
    </style>
</head>
<body>
<canvas width="500" height="400"></canvas>
<script>
    // 1.拿到canvas
    let oCanvas = document.querySelector("canvas");
    // 2.从canvas中拿到绘图工具
    let oCtx = oCanvas.getContext("2d");
    /*
    面向对象思想:
    找到小人对象, 你给我画到指定的位置, 你给我走起来, 你给我停下来
    * */
    class Person{
        constructor(canvas, x, y){
            this.canvas = canvas;
            this.x = x;
            this.y = y;
            this.oCtx = canvas.getContext("2d");
            this.index = 1;
            this.timerId = null;
            // 0正面/1左面/2右面/3后面
            this.direction = 0;
        }
        render(){
            let oImg = new Image();
            oImg.onload = () => {
                // 1.计算每一张图片的宽高
                let imageWidth = oImg.width;
                let imageHeight = oImg.height;
                let personWidth = imageWidth / 4;
                let personHeight = imageHeight / 4;
                // 2.绘制图片
                this.oCtx.drawImage(
                    oImg, // 需要绘制的图片
                    0, this.direction * personHeight, // 图片定位的位置
                    personWidth, personHeight, // 图片裁剪的大小
                    this.x, this.y, // 图片绘制的位置
                    personWidth, personHeight // 指定图片绘制的大小
                );
                this.oImg= oImg;
                this.personWidth = personWidth;
                this.personHeight = personHeight;
            }
            oImg.src = "images/person.png";
        }
        run(stepX, stepY){
            let canvasWidth = this.oCtx.canvas.width;
            let canvasHeight = this.oCtx.canvas.height;
            clearInterval(this.timerId);
            this.timerId = setInterval(() => {
                if(stepX !== 0){
                    this.x += stepX;
                }
                if(stepY !== 0){
                    this.y += stepY;
                }
                this.oCtx.clearRect(0, 0, canvasWidth, canvasHeight);
                this.oCtx.drawImage(
                    this.oImg, // 需要绘制的图片
                    this.index * this.personWidth, this.direction * this.personHeight, // 图片定位的位置
                    this.personWidth, this.personHeight, // 图片裁剪的大小
                    this.x, this.y, // 图片绘制的位置
                    this.personWidth, this.personHeight // 指定图片绘制的大小
                );
                this.index++;
                if(this.index > 3){
                    this.index = 0;
                }
            }, 500);
        }
        moveDown(){
            this.direction = 0;
            this.run(0, 5);
        }
        moveUp(){
            this.direction = 3;
            this.run(0, -5);
        }
        moveLeft(){
            this.direction = 1;
            this.run(-5, 0);
        }
        moveRight(){
            this.direction = 2;
            this.run(5, 0);
        }
        stop(){
            clearInterval(this.timerId);
        }
    }
    let person = new Person(oCanvas, 100, 100);
    person.render();
    person.moveDown();
    // person.run(0, 5);
    // person.run(0, -5);
    // person.run(-5, 0);
    // person.run(5, 0);
    // person.moveRight();
    // person.stop();

    window.onkeydown = function (event) {
        let key = event.key;
        // console.log(key);
        switch (key.toLowerCase()){
            case "w":
                person.moveUp();
                break;
            case "s":
                person.moveDown();
                break;
            case "a":
                person.moveLeft();
                break;
            case "d":
                person.moveRight();
                break;
        }
    }
</script>
</body>
</html>
2.22Canvas形变
// 注意点: 在canvas中所有的形变属性操作的都是坐标系, 而不是图形
<!DOCTYPE html>
<html lang="en">
<head>
    <meta charset="UTF-8">
    <title>24-Canvas形变</title>
    <style>
        *{
            margin: 0;
            padding: 0;
        }
        canvas{
            display: block;
            margin: 0 auto;
            background: red;
        }
    </style>
</head>
<body>
<canvas width="500" height="400"></canvas>
<script>
    // 1.拿到canvas
    let oCanvas = document.querySelector("canvas");
    // 2.从canvas中拿到绘图工具
    let oCtx = oCanvas.getContext("2d");
    // 注意点: 在canvas中所有的形变属性操作的都是坐标系, 而不是图形
    // oCtx.translate(100, 0);
    // oCtx.translate(0, 100);
    // oCtx.translate(100, 100);

    // oCtx.rotate(Math.PI/6);

    oCtx.scale(0.5, 1);
    // 3.绘制一个矩形
    oCtx.strokeRect(100, 100, 200, 100);
</script>
</body>
</html>
2.23Canvas事件监听
整个canvas是一个标签, 所以只能通过监听鼠标在canvas上的位置来判断是否需要处理对应的图形
当然也可以通过第三方框架来解决交互问题
诸如: zrender.js / Knova.js /three.js / egret.js / pixi.js等等
<!DOCTYPE html>
<html lang="en">
<head>
    <meta charset="UTF-8">
    <title>25-Canvas事件监听</title>
    <style>
        *{
            margin: 0;
            padding: 0;
        }
        canvas{
            display: block;
            margin: 0 auto;
            background: red;
        }
    </style>
</head>
<body>
<canvas width="500" height="400"></canvas>
<script>
    /*
    因为整个canvas是一个标签, 所以只能通过监听鼠标在canvas上的位置来判断是否需要处理对应的图形
    当然也可以通过第三方框架来解决交互问题
    诸如: zrender.js / Knova.js /three.js / egret.js / pixi.js等等
    * */
    // 1.拿到canvas
    let oCanvas = document.querySelector("canvas");
    // 2.从canvas中拿到绘图工具
    let oCtx = oCanvas.getContext("2d");
    // 3.绘制矩形
    let rectX = 100;
    let rectY = 100;
    let rectWidth = 100;
    let rectHeight = 100;
    oCtx.rect(rectX, rectY, rectWidth, rectHeight);
    oCtx.fill();

    oCtx.beginPath();
    oCtx.rect(200, 200, 100, 100);
    oCtx.fill();
    // 4.添加点击事件
    oCanvas.onclick = function (event) {
        let x = event.offsetX;
        let y = event.offsetY;
        /*
        if(x >= rectX && x <= rectX + rectWidth &&
            y >= rectY && y <= rectY + rectHeight){
            console.log("矩形被点击了");
        }else{
            console.log("矩形没有被点击");
        }
        */
        /*
        注意点:
        isPointInPath方法如果开启了一个新的路径, 那么判断的就是点是否在新的路径的图形中
        * */
        console.log(oCtx.isPointInPath(x, y));
    }
</script>
</body>
</html>
2.24综合案例 Canvas炫彩小球
<!DOCTYPE html>
<html lang="en">
<head>
    <meta charset="UTF-8">
    <title>26-Canvas炫彩小球</title>
    <style>
        *{
            margin: 0;
            padding: 0;
        }
        canvas{
            display: block;
            margin: 0 auto;
            background: red;
        }
    </style>
</head>
<body>
<canvas width="500" height="400"></canvas>
<script>
    // 1.拿到canvas
    let oCanvas = document.querySelector("canvas");
    // 2.从canvas中拿到绘图工具
    let oCtx = oCanvas.getContext("2d");
    class Ball{
        constructor(canvas, x, y){
            this.canvas = canvas;
            this.x = x;
            this.y = y;
            this.r = 30;
            this.color = this._randomColor();
            this.oCtx = canvas.getContext("2d");
            this.canvasWidth = this.oCtx.canvas.width;
            this.canvasHeight = this.oCtx.canvas.height;
            // 生成偏移位
            this.dx = this._getRandomArbitrary(-5, 6); // -5~5
            this.dy = this._getRandomArbitrary(-5, 6); // -5~5
            this.dr = this._getRandomArbitrary(0.5, 1);
        }
        render(){
            // this.oCtx.clearRect(0, 0, this.canvasWidth, this.canvasHeight);
            this.oCtx.beginPath();
            this.oCtx.arc(this.x, this.y, this.r, 0, Math.PI * 2);
            this.oCtx.fillStyle = this.color;
            this.oCtx.fill();
        }
        update(){
            // x = 100; dx = -5; dx = 5
            // x = 95/ 90 / 85
            // x = 105/ 110/ 115
            this.x += this.dx;
            this.y += this.dy;
            // r = 30; dr = 0.5;
            // 29.5 29 28.5
            this.r -= this.dr;

            if(this.r <= 0 || this.x <= 0 || this.y <= 0 ||
            this.x >= this.canvasWidth || this.y >= this.canvasHeight){
                return false;
            }
            return true;
        }
        _randomColor(){
            let r = Math.floor(this._getRandomArbitrary(0, 256));
            let g = Math.floor(this._getRandomArbitrary(0, 256));
            let b = Math.floor(this._getRandomArbitrary(0, 256));
            return `rgb(${r}, ${g}, ${b})`;
        }
        _getRandomArbitrary(min, max) {
            return Math.random() * (max - min) + min;
        }
    }
    // let ball = new Ball(oCanvas, 100, 100);
    // ball.render();
    // setInterval(function () {
    //     ball.update();
    //     ball.render();
    // }, 50);
    let list = [];
    oCanvas.onmousemove = function (event) {
        let x = event.offsetX;
        let y = event.offsetY;
        let ball = new Ball(oCanvas, x, y);
        ball.render();
        list.push(ball);
    }
    setInterval(function () {
        oCtx.clearRect(0, 0, oCtx.canvas.width, oCtx.canvas.height);
        for(let i = 0; i < list.length; i++){
            let ball = list[i];
            let res = ball.update();
            if(res){
                ball.render();
            }else{
                list.splice(i, 1);
            }
        }
    }, 50);
</script>
</body>
</html>